Waiting for lower timeframe confirmation is our main tool to confirm strength within higher timeframe zones, and has really been the key to our trading success. It takes a little time to understand the subtle nuances, however, as each trade is never the same, but once you master the rhythm so to speak, you will be saved from countless unnecessary losing trades. The following is a list of what we look for:
- A break/retest of supply or demand dependent on which way you’re trading.
- A trendline break/retest.
- Buying/selling tails/wicks – essentially we look for a cluster of very obvious spikes off of lower timeframe support and resistance levels within the higher timeframe zone.
- Candlestick patterns. We tend to stick with pin bars and engulfing bars as these have proven to be the most effective.
We typically search for lower-timeframe confirmation between the M15 and H1 timeframes, since most of our higher-timeframe areas begin with the H4. Stops are usually placed 1-3 pips beyond confirming structures.
EUR/USD:
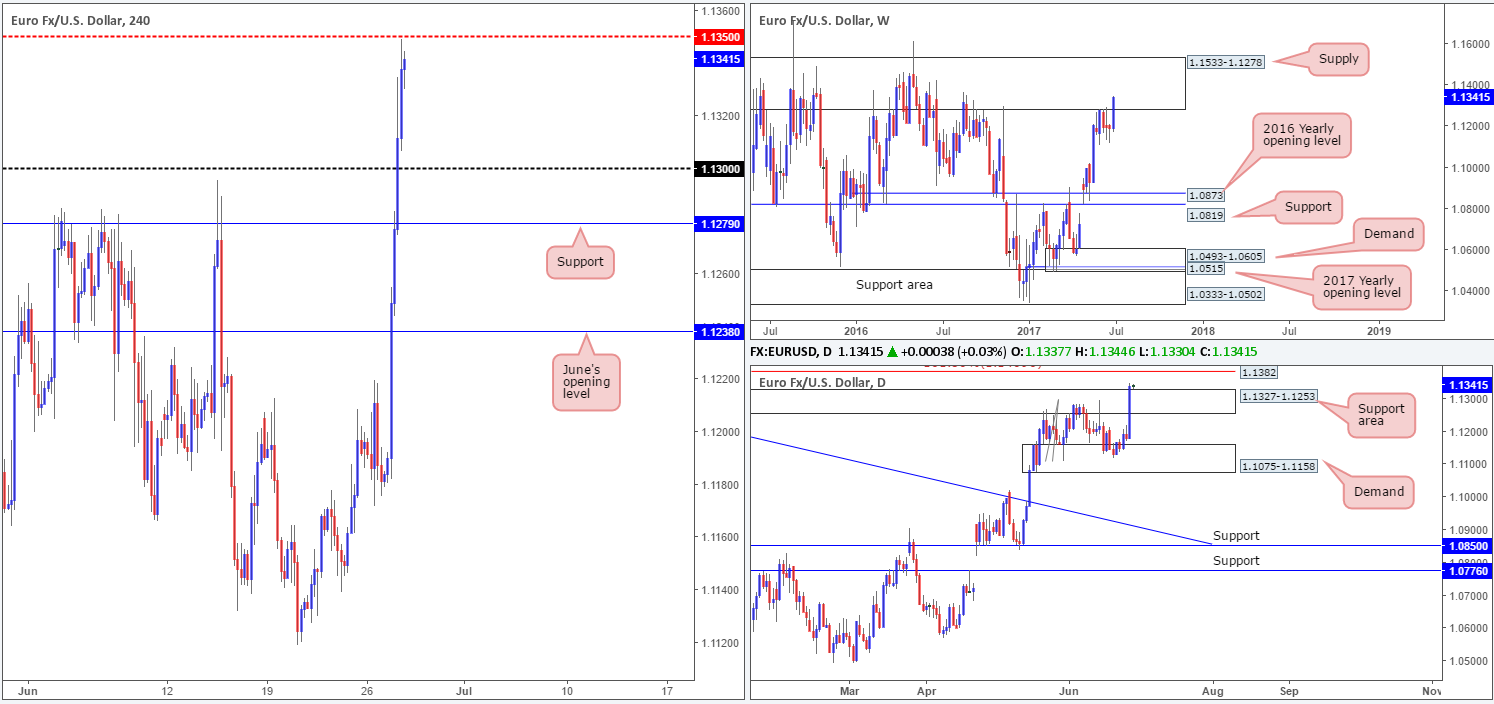
In response to ECB President Mario Draghi’s comments yesterday, the EUR shifted northbound and swallowed June’s opening level at 1.1238. The dollar continued to sink throughout both the London and US sessions, despite US consumer confidence coming in higher than expected. The day ended with the single currency topping just ahead of the H4 mid-level resistance at 1.1350.
Over on the daily chart, the recent bout of buying also saw price trade through a resistance area coming in at 1.1327-1.1253, consequently opening up the path north to a daily Quasimodo resistance level seen at 1.1382. Weekly action on the other hand remains trading within the walls of a major weekly supply at 1.1533-1.1278.
Our suggestions: Quite simply, the main interest today is the daily Quasimodo resistance at 1.1382. Not only is the level fresh, it’s also positioned within the weekly supply mentioned above and is located just below a daily AB=CD 161.8% ext. at 1.1409 and the psychological band 1.14. Given this, a short from 1.1382, with stops placed above 1.1409, is certainly an option today.
Data points to consider: ECB President Mario Draghi speaks at 2.30pm. US Pending home sales at 3pm GMT+1.
Levels to watch/live orders:
- Buys: Flat (stop loss: N/A).
- Sells: 1.1382 (stop loss: 1.1415).
GBP/USD:
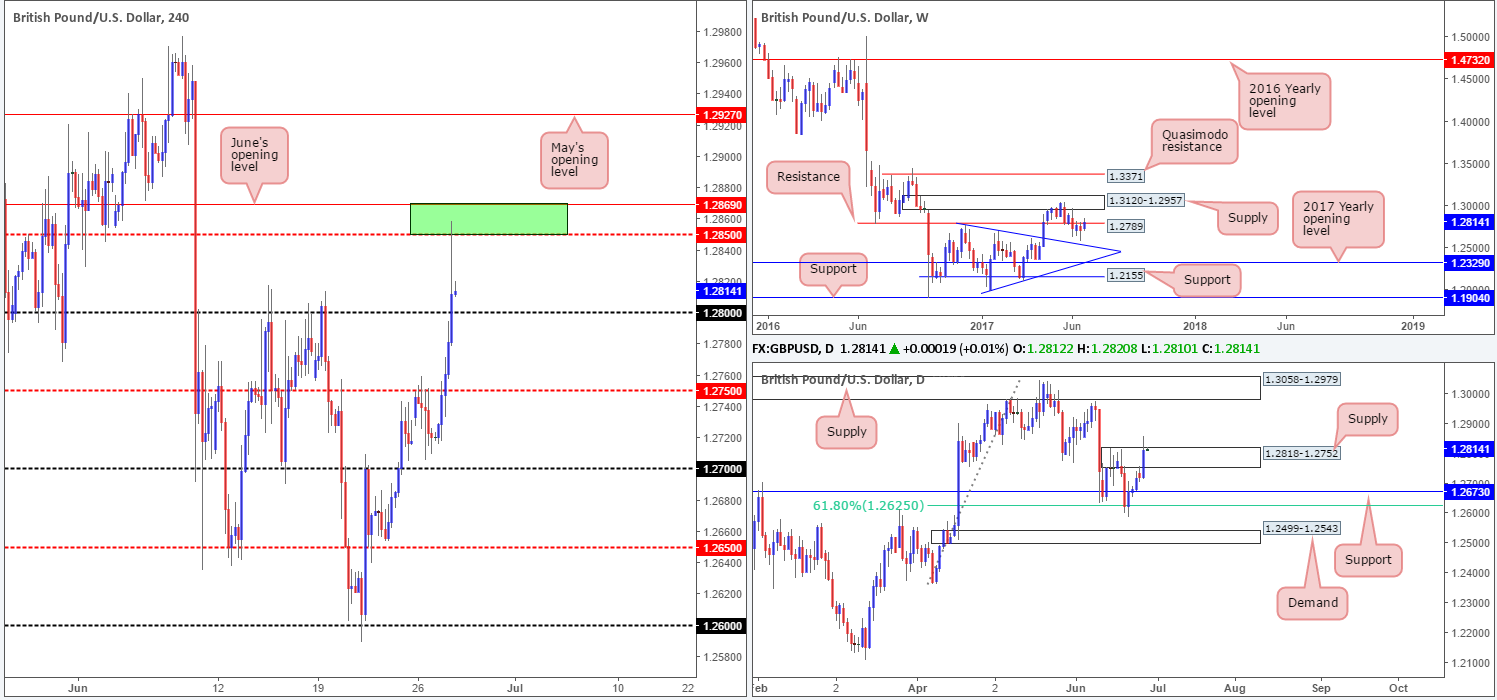
In a similar fashion to the EUR/USD the GBP/USD also went on the offensive yesterday. Chomping its way through the H4 mid-level resistance at 1.2750 and 1.28 handle, the unit ended the day crossing swords with 1.2869/1.2850 (June’s opening level/mid-level resistance – green area).
Daily supply at 1.2818-1.2752, thanks to yesterday’s advance, suffered a rather aggressive whipsaw. A truckload of stop-loss orders have likely been triggered here, possibly clearing the path north up to daily supply drawn from 1.3058-1.2979. However, to prove genuine consumption here, we would require a daily close to take shape beyond this area.
Our suggestions: Entering long from the 1.28 handle today is not something we’d recommend, as it’s difficult to know if the current daily supply is truly consumed. A H4 decisive close below 1.28 may signal buyer weakness, but is not a move we would consider trying to sell. Therefore, our desk will remain on the sidelines for the time being and reassess price action going into tomorrow’s open.
Data points to consider: BoE Gov. Carney speaks at 2.30pm. US Pending home sales at 3pm GMT+1.
Levels to watch/live orders:
- Buys: Flat (stop loss: N/A).
- Sells: Flat (stop loss: N/A).
AUD/USD:
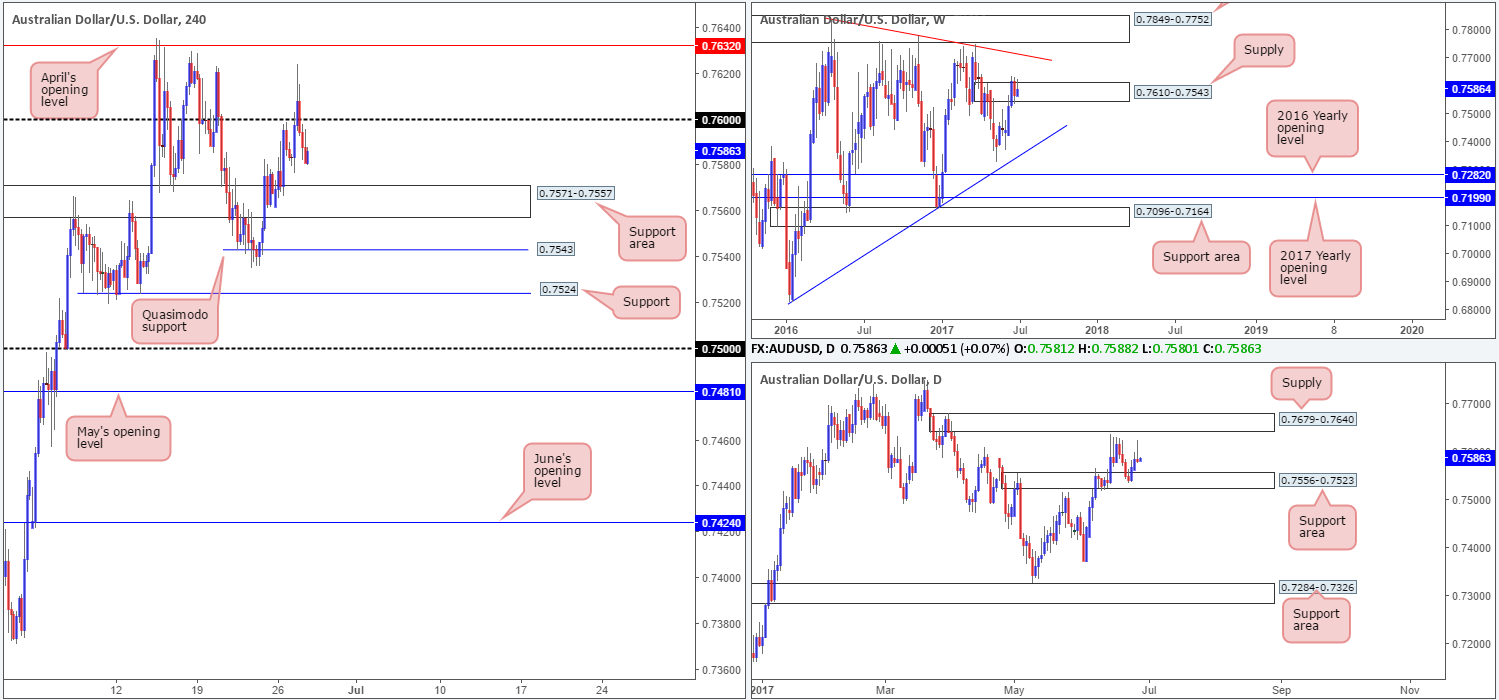
Failing to sustain gains beyond the 0.76 handle, the commodity currency concluded yesterday’s trade relatively unchanged. Consequent to this, a bearish daily selling wick took shape and could potentially send the unit south to retest the daily support area drawn from 0.7556-0.7523. Weekly price, as you can see, remains consolidating within the walls of supply coming in at 0.7610-0.7543.
Similar to Tuesday’s report, between 0.76 and the H4 support area at 0.7571-0.7557 (located just above the aforementioned daily support area), we have thirty pips of room to play with. While this is enough to profit if one is able to pin down a tight stop loss, it is not something we will be looking into.
Beyond 0.76 we see April’s opening level at 0.7632, a line that happens to be positioned eight pips below the underside of a daily supply area at 0.7679-0.7640. Below the current H4 support area, there’s not much room for price to stretch its legs. Close by is a H4 Quasimodo support at 0.7543, followed by H4 support at 0.7524. As is evident from the H4 timeframe, the unit remains restricted as far as structure is concerned.
Our suggestions: On account of the above, neither a long nor short seems attractive at this time. With that being the case, our team, once again, intends to watch today’s action from the safety of the bench and will look to reassess price action going into tomorrow’s open.
Data points to consider: US Pending home sales at 3pm GMT+1.
Levels to watch/live orders:
- Buys: Flat (stop loss: N/A).
- Sells: Flat (stop loss: N/A).
USD/JPY:
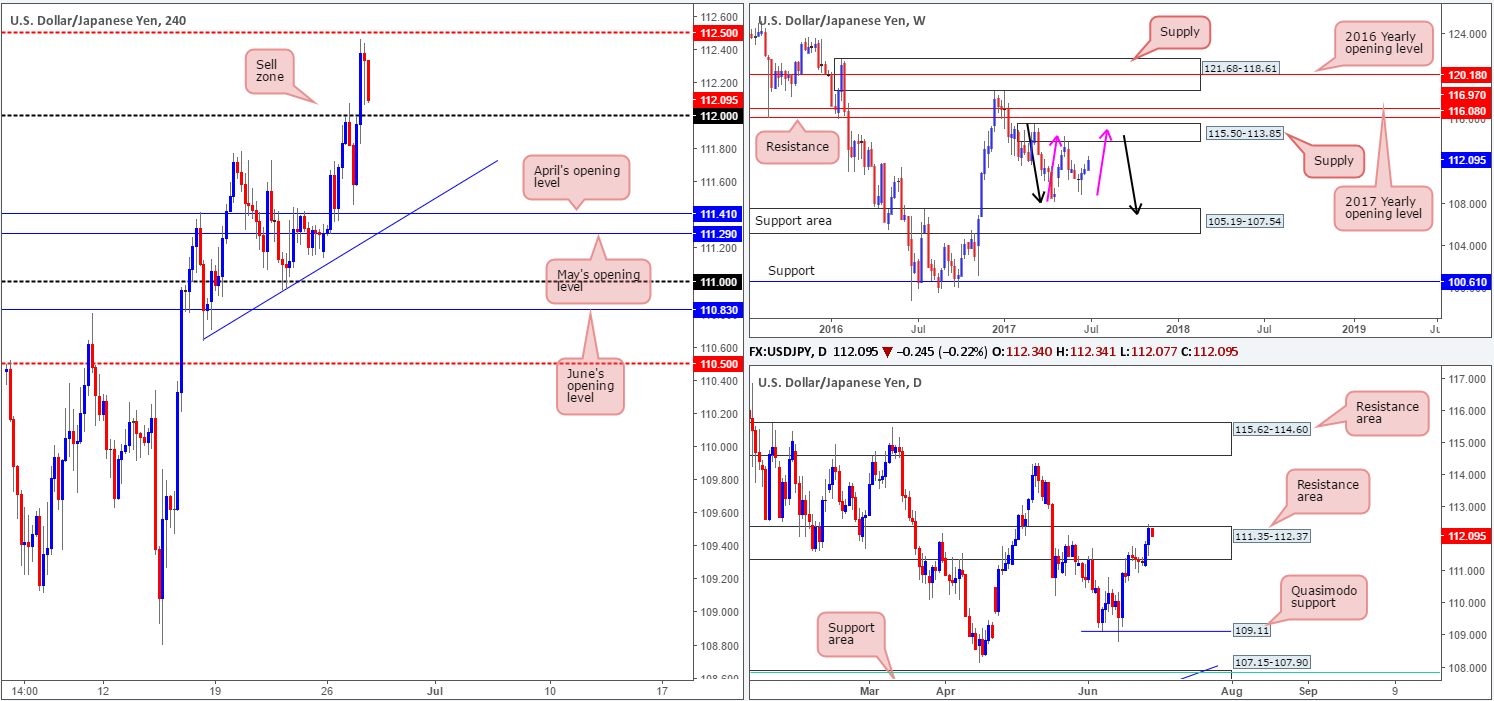
For those who read Tuesday’s report you may recall that our desk underscored the 112 handle as a particularly interesting level to short from. This was due to 112 merging with a left shoulder i.e. a H4 Quasimodo pattern at 112.05, and also being sited within a daily resistance area at 111.35-112.37 as well as converging closely with a H4 AB=CD 127.2% ext. at 112.09 taken from the low 110.64. As you can see, price responded beautifully to 112 and dropped to a low of 111.46, before reversing into the London open. Well done to any of our readers who managed to jump aboard here.
With weekly price showing room to advance up to supply pegged at 115.50-113.85, in the shape of a weekly AB=CD correction (see pink arrows), and daily flow teasing the upper edge of the said daily resistance area, selling is not something we are keen on.
Our suggestions: Although we are not keen sellers right now, buying from the 112 neighborhood without any H4 confluence present is also not a trade we could be confident in unfortunately. As such, our team is reluctant to commit to this market today.
Data points to consider: BoJ Gov. Kuroda speaks at 2.30pm. US Pending home sales at 3pm GMT+1.
Levels to watch/live orders:
- Buys: Flat (stop loss: N/A).
- Sells: Flat (stop loss: N/A).
USD/CAD:
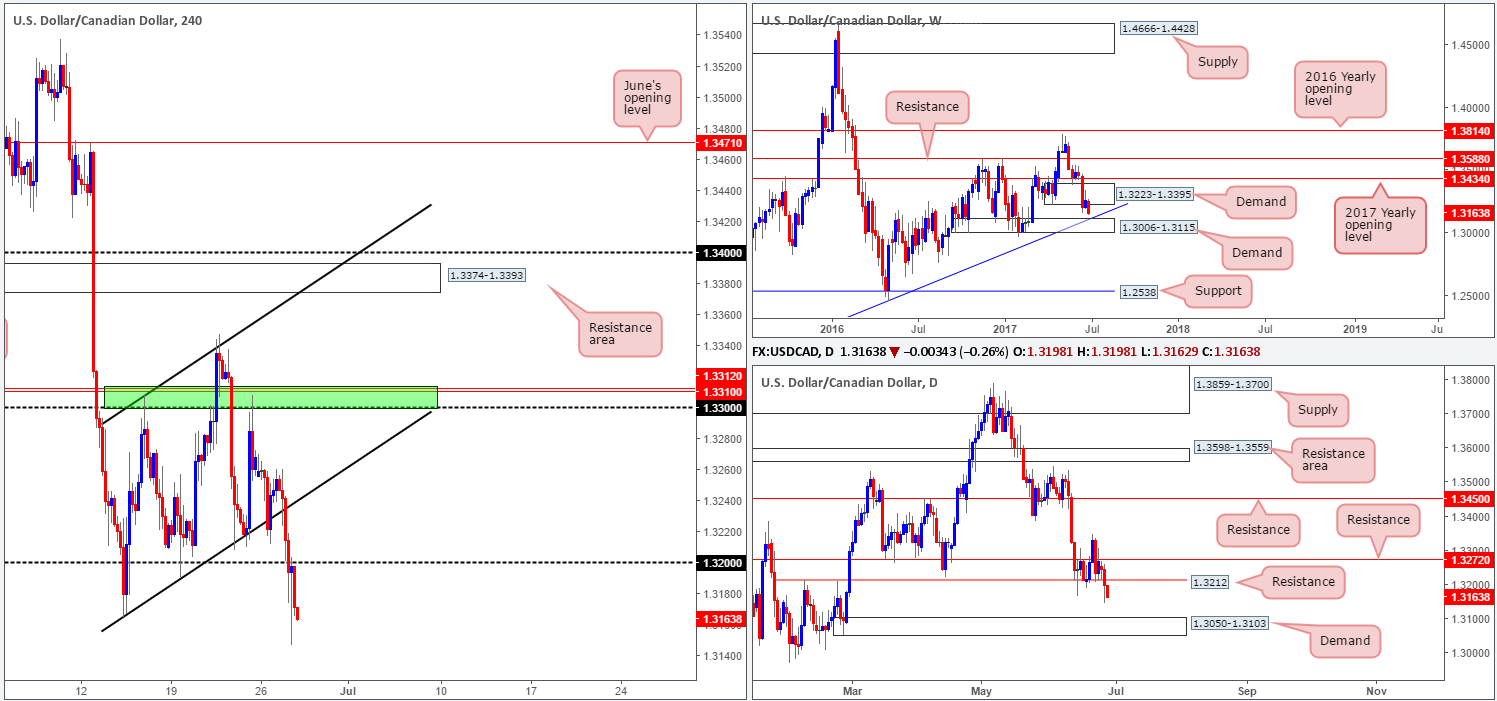
As anticipated, the H4 ascending channel formation (1.3165/1.3308) gave way during yesterday’s sessions. This was something we mentioned in past reports, and the reason we believed this to be the case was not only did we have daily resistance at 1.3272 in play, but let’s also not forget that the current weekly demand was also hanging on by a thin thread.
In seeing that H4 price breached the 1.32 handle, our desk is predominantly bearish right now. The reason for this, other than the recent break of 1.32, is simply due to daily support at 1.3212 also being engulfed. Technically speaking, this has possibly cleared the path south down to a daily demand area coming in at 1.3050-1.3103, which happens to be positioned within the walls of a weekly demand at 1.3006-1.3115/weekly trendline support extended from the high 1.1278 (the next downside target on the weekly timeframe).
Our suggestions: We mentioned in yesterday’s report that should 1.32 be consumed and retested as resistance, we would consider shorting this market and targeting the top edge of the weekly demand at 1.3115. Well, given the recent bearish rejection seen from the underside of 1.32, we have decided to sell at market from 1.3171, with a stop positioned at 1.3205 (34pips). Now, the distance to the take-profit is 56 pips, so there’s at least one and a half times the risk to be had here.
Data points to consider: US Pending home sales at 3pm, followed closely by Crude oil inventories at 3.30pm. BoC Gov. Poloz speaks at 2.30pm GMT+1.
Levels to watch/live orders:
- Buys: Flat (Stop loss: N/A).
- Sells: 1.3171 ([live] stop loss: 1.3205).
USD/CHF:
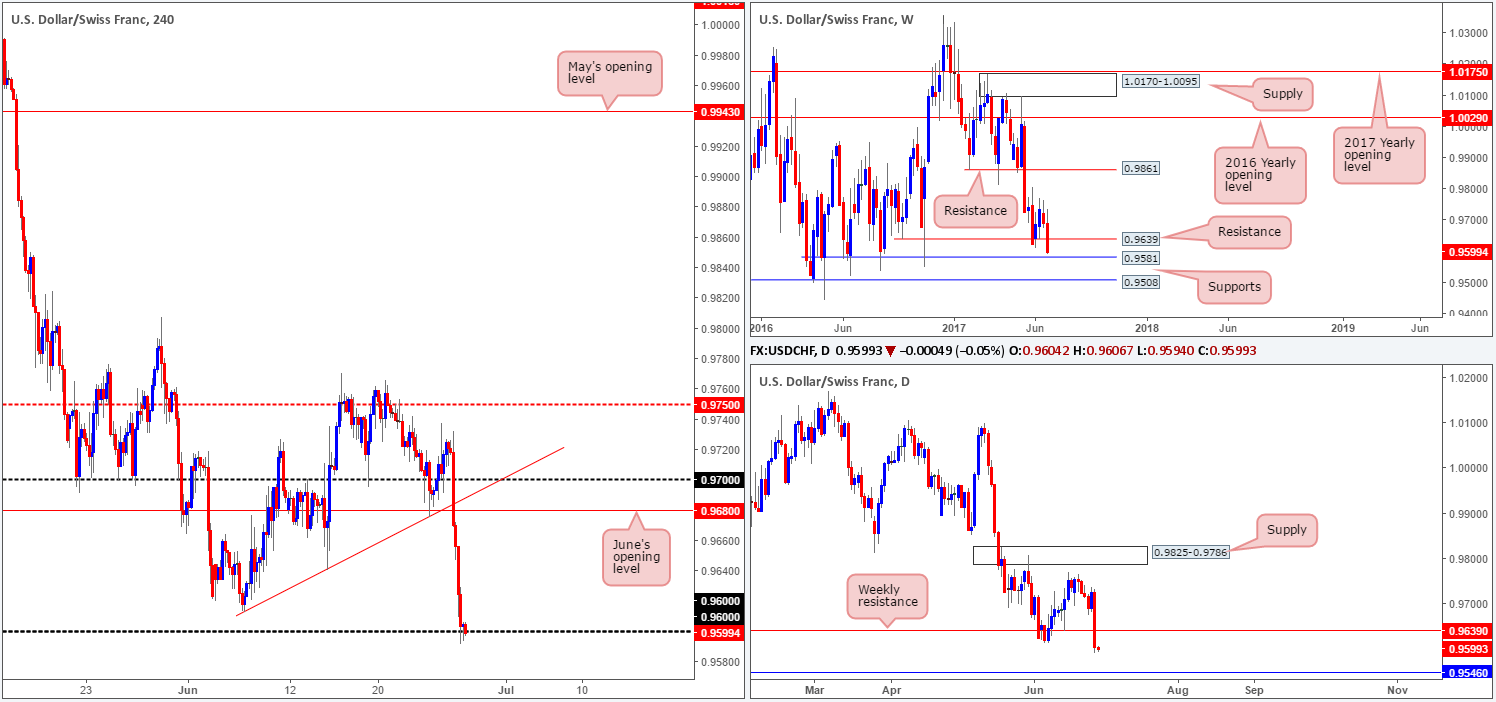
Beginning with the weekly timeframe this morning, we can clearly see that price is now trading within shouting distance of a weekly support level coming in at 0.9581. Looking down to the daily timeframe on the other hand, support does not come into view until we reach 0.9546.
Over on the H4 timeframe, however, the 0.96 handle is currently seeing some action, following yesterday’s rather one-sided move south. With the bulls failing to print anything of note from 0.96 as of yet, this could lead to a break of this level. Be that as it may, trying to short this move could end in tears since let’s remember that only 20 pips below sits weekly support at 0.9581, and 35 pips below that is daily support at 0.9546.
Our suggestions: With stop-loss orders below 0.96 just begging to be filled, along with breakout sellers’ orders (this will likely provide liquidity for the big boys to buy), we believe a long trade from between 0.9546/0.9581 is high probability today. To be on the safe side, we would only consider a buy from here in the event that a H4 bullish engulfing candle takes shape. This will, for us, confirm buyer intent.
Data points to consider: US Pending home sales at 3pm GMT+1.
Levels to watch/live orders:
- Buys: 0.9546/0.9581 ([waiting for a reasonably sized H4 bull candle to form – preferably a full-bodied candle – following the retest is advised] stop loss: ideally beyond the candle’s tail).
- Sells: Flat (stop loss: N/A).
DOW 30:
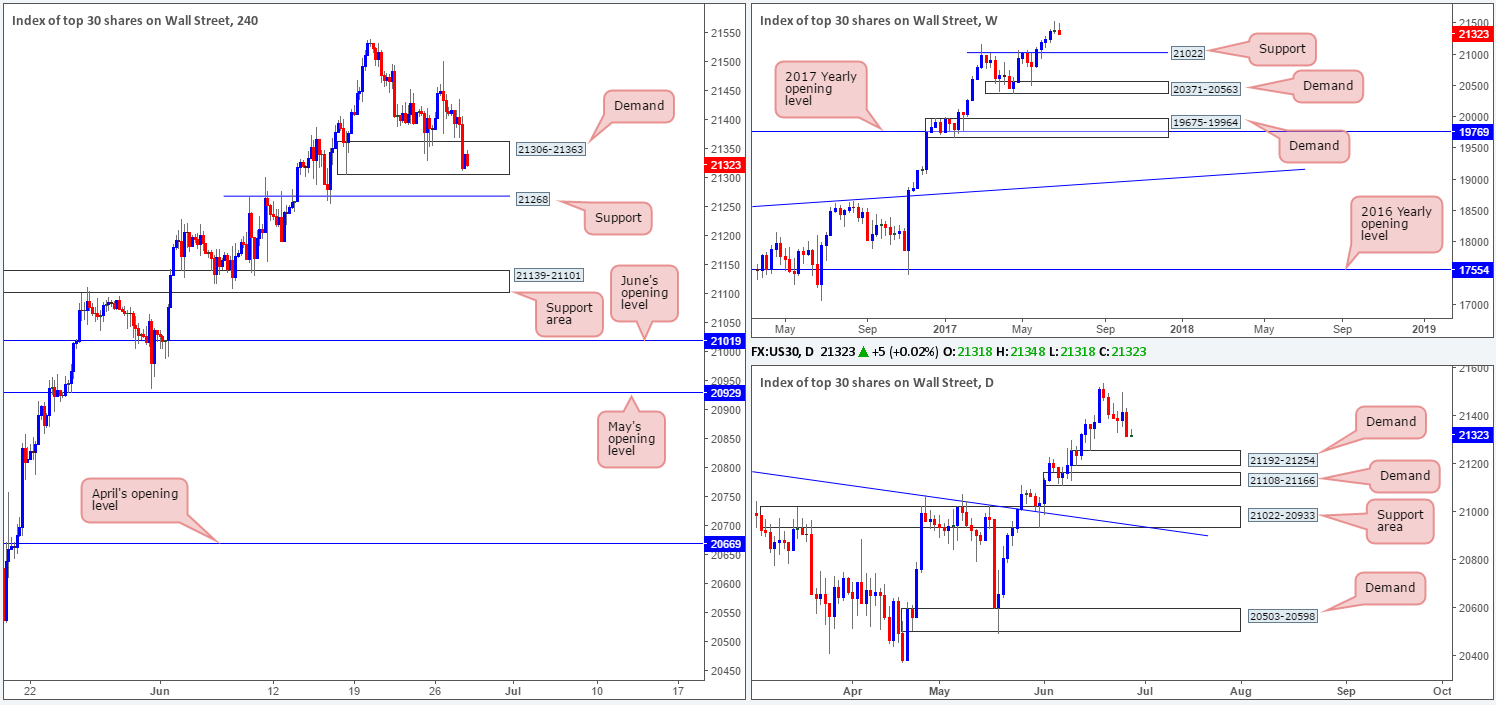
The H4 demand at 21306-21363 is now seen under pressure, following yesterday’s selloff. For those who follow our analysis on a regular basis, you may recall that our desk is currently long from 21164. 50% of that position was quickly liquidated at 21234, with the remaining 50% left in the market to run since we intend on trailing this trend long term. Therefore, recent price action is particularly concerning for us considering that we have a stop-loss order located just beneath this zone!
Should the current H4 demand base be taken out, it is likely that the unit will challenge H4 support pegged at 21268, which happens to be located just above daily demand fixed at 21192-21254. For that reason, looking to sell the breakout beneath the said H4 demand is not something we would recommend.
Our suggestions: At the time of writing, there is not much else to hang our hat on. Of course, we would like to see the aforementioned H4 demand stabilize price, but judging H4 price action right now, it’s likely to punch lower today.
If that’s the case, why not then look for longs from the 21268 neighborhood? Personally, entering into a buy position just beneath a broken demand base, which could act as a resistance area, is too much of a risk in this situation.
Data points to consider: US Pending home sales at 3pm GMT+1.
Levels to watch/live orders:
- Buys: 21164 ([live] stop loss: 21298).
- Sells: Flat (stop loss: N/A).
GOLD:
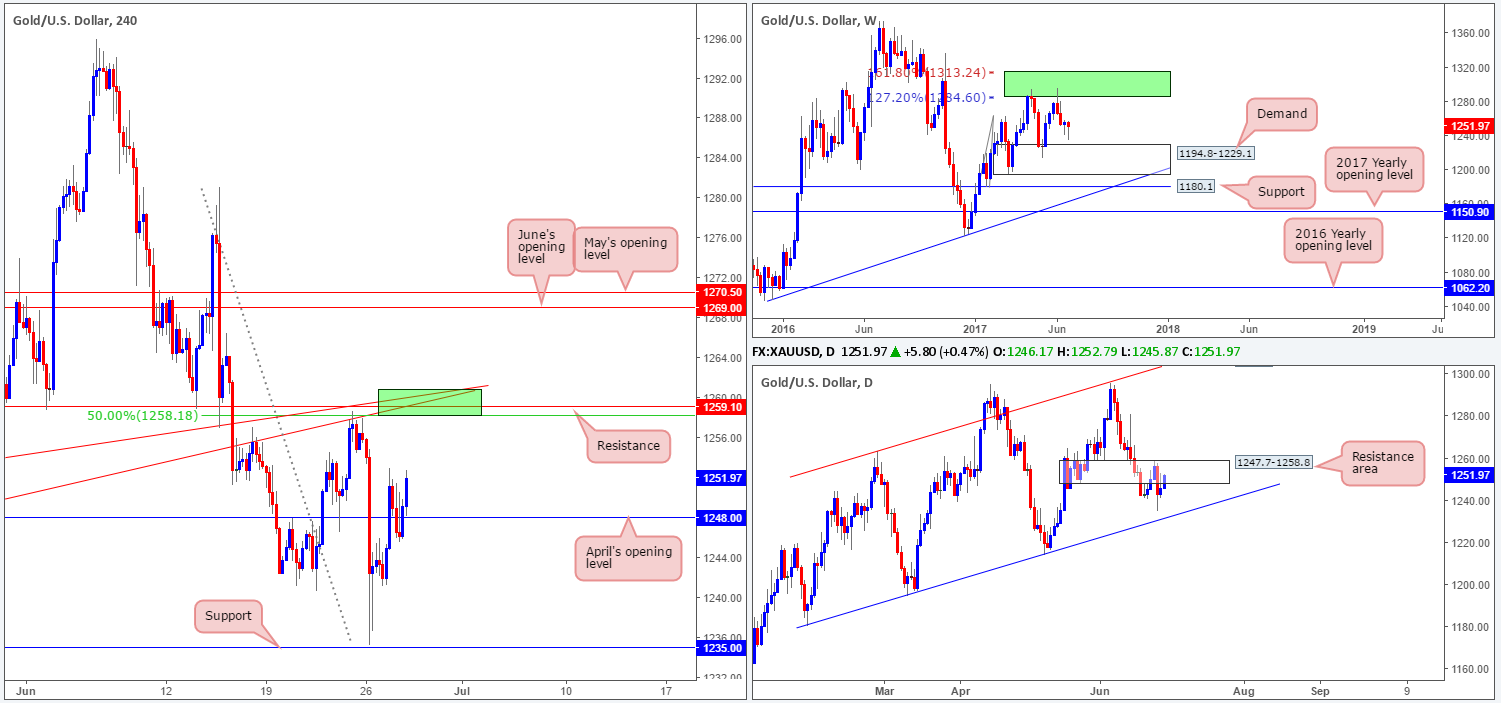
Looking at this market from the top this morning shows that weekly price is on course to print yet another buying tail, just ahead of weekly demand coming in at 1194.8-1229.1. What’s also interesting is that daily action is seen retesting a resistance area at 1247.7-1258.8.
Jumping across to the H4 timeframe, we can see that the bulls have found a temporary home above April’s opening level at 1248.0. Continual buying here could see the H4 candles connect with the green H4 area which we deem to be a sell zone. The reasons as to why are as follows:
- H4 resistance at 1259.1.
- Two H4 trendline resistances taken from lows of 1245.9/1252.9.
- H4 50.0% retracement value at 1258.1 taken from the high 1281.1.
- Located within the upper limits of a daily resistance area at 1247.7-1258.8.
Our suggestions: H4 price is likely to test the above noted green H4 sell zone today. However, with little weekly connection seen around this area, there’s a chance that a fakeout could take shape. Therefore, we will only consider a sell from here valid if, and only if, a H4 bearish candle forms, preferably a full-bodied candle.
Levels to watch/live orders:
- Buys: Flat (stop loss: N/A).
- Sells: 1259.1 region ([waiting for a reasonably sized H4 bear candle – preferably a full-bodied candle – to form before pulling the trigger is advised] stop loss: ideally beyond the candle’s wick).


