EUR/USD:
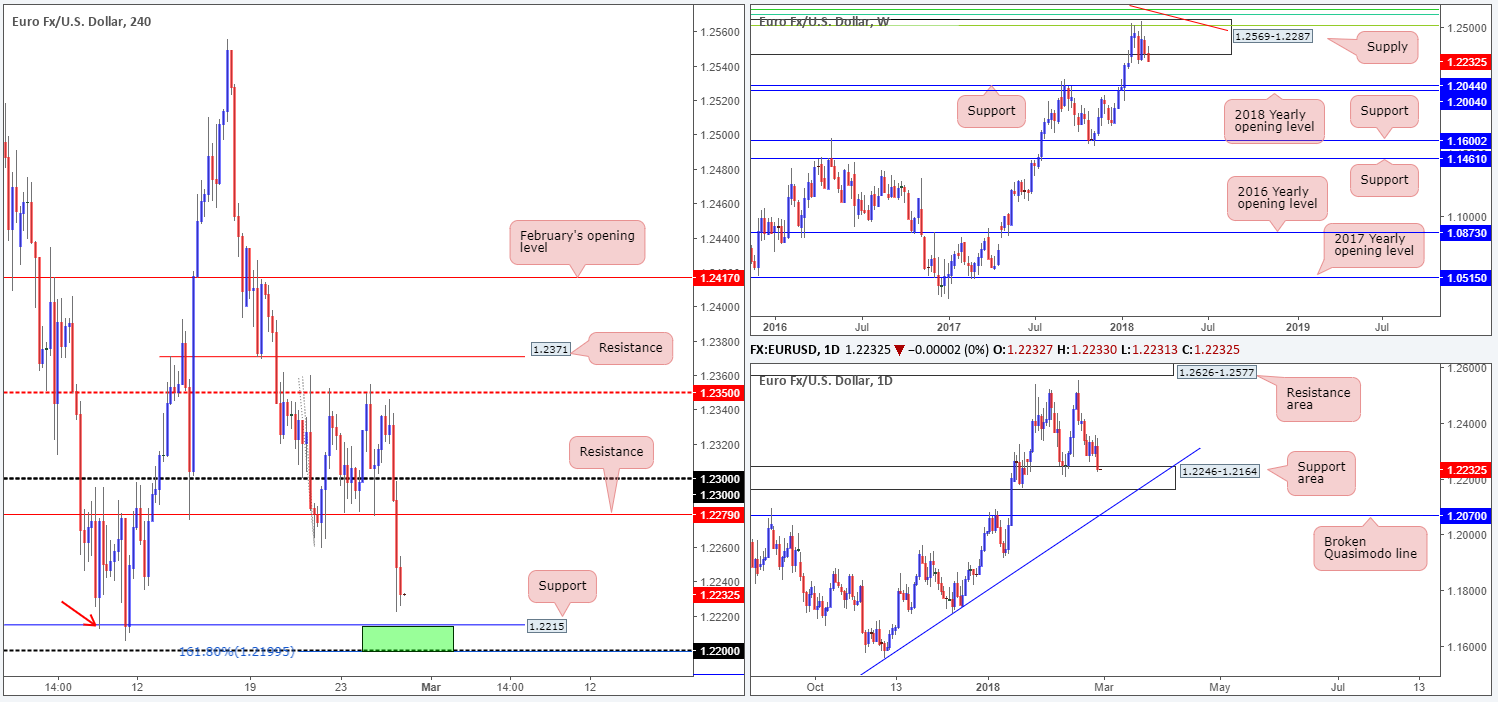
Influenced by Fed Powell’s first congressional testimony, the EUR/USD suffered a blow to the mid-section on Tuesday. The new Federal Reserve Chairman stressed that the economic outlook remained strong and foresees a tightening cycle continuing at a gradual pace over the 2018-2020 period, thus bolstering the US dollar.
Amid the recent selloff, the 1.23 milestone seen marked on the H4 timeframe was engulfed, leaving price free to close a few pips ahead of a H4 support level at 1.2215. Traders may have also noticed that this support houses a H4 Quasimodo left shoulder marked with a red arrow at 1.2212, therefore adding weight to the line.
Weekly movement remains trading around the lower limits of a major weekly supply area coming in at 1.2569-1.2287, and indicates that there’s room to push as far south as weekly support plugged in at 1.2044. On another note, however, the daily candles recently shook hands with a daily support area registered at 1.2246-1.2164. Given that this zone dates back to as far as Dec 2014 and has already proved its worth on two occasions this year, this is not an area to ignore.
Potential trading zones:
With weekly sellers looking to punch lower and daily buyers likely to try and counter this move, this remains a tricky market to trade at the moment, especially for those looking for medium to long-term positions.
Despite the above, the team has shown interest in the nearby H4 support level at 1.2215, in particular the 1.22 handle and its converging 161.8% H4 Fib ext. point. This area (marked in green) is likely to offer the unit support today. However, traders do need to take into consideration that psychological bands tend to attract fakeouts, which could lead to a move being seen down to an M30 Quasimodo support line at 1.2181. The base of this formation (1.2173) could be used as a place for stops. As for take-profit targets, the initial port of call will likely be around the 1.2250 mark, followed by H4 resistance plugged in at 1.2279.
Data points to consider: EUR CPI flash estimate y/y at 10am; US prelim GDP q/q at 1.30pm; Chicago PMI at 2.45pm; US pending home sales m/m at 3pm GMT.
Areas worthy of attention:
Supports: 1.22 handle; 1.2215; 1.2246-1.2164; 1.2044.
Resistances: 1.2250; 1.2279.
GBP/USD:
The British pound came under pressure on Tuesday amid ongoing Brexit talks and dollar strength following Fed Powell’s first congressional testimony.
Leaving the key 1.40 psychological level unchallenged, the GBP/USD turned lower and aggressively whipsawed through the 1.39 band. This move has likely filled a truckload of buyer’s stops and also filled breakout sellers’ orders (a painful place to be). Directly below this number – apart from the local H4 double-bottom formation marked with two green arrows at 1.3856 – we do not see much stopping the unit from connecting with 1.38/H4 demand at 1.3756-1.3794. Also notice that the approach to this area could very well be in the form of a H4 AB=CD pattern (red arrows).
Providing additional support to the above noted H4 demand base, we can see there is a 61.8% daily Fib support at 1.3804. Opposing this level, nevertheless, is weekly selling from below resistance plotted at 1.4079.
Potential trading zones:
Given that the higher timeframes indicate room to push lower, the team’s attention is drawn to 1.39. A H4 close beneath this number, followed up with a successful retest in the shape of a full or near-full-bodied H4 bearish candle would, in our humble opinion, be enough to validate shorts, ultimately targeting the 1.38 area. Traders will do well to keep an eye on the noted H4 double-bottom formation, which could be an ideal position to consider reducing risk to breakeven.
Data points to consider: US prelim GDP q/q at 1.30pm; Chicago PMI at 2.45pm; US pending home sales m/m at 3pm GMT.

Areas worthy of attention:
Supports: 1.39/8 handle; 1.3756-1.3794; 1.3804.
Resistances: 1.4079; 1.40 handle.
AUD/USD:
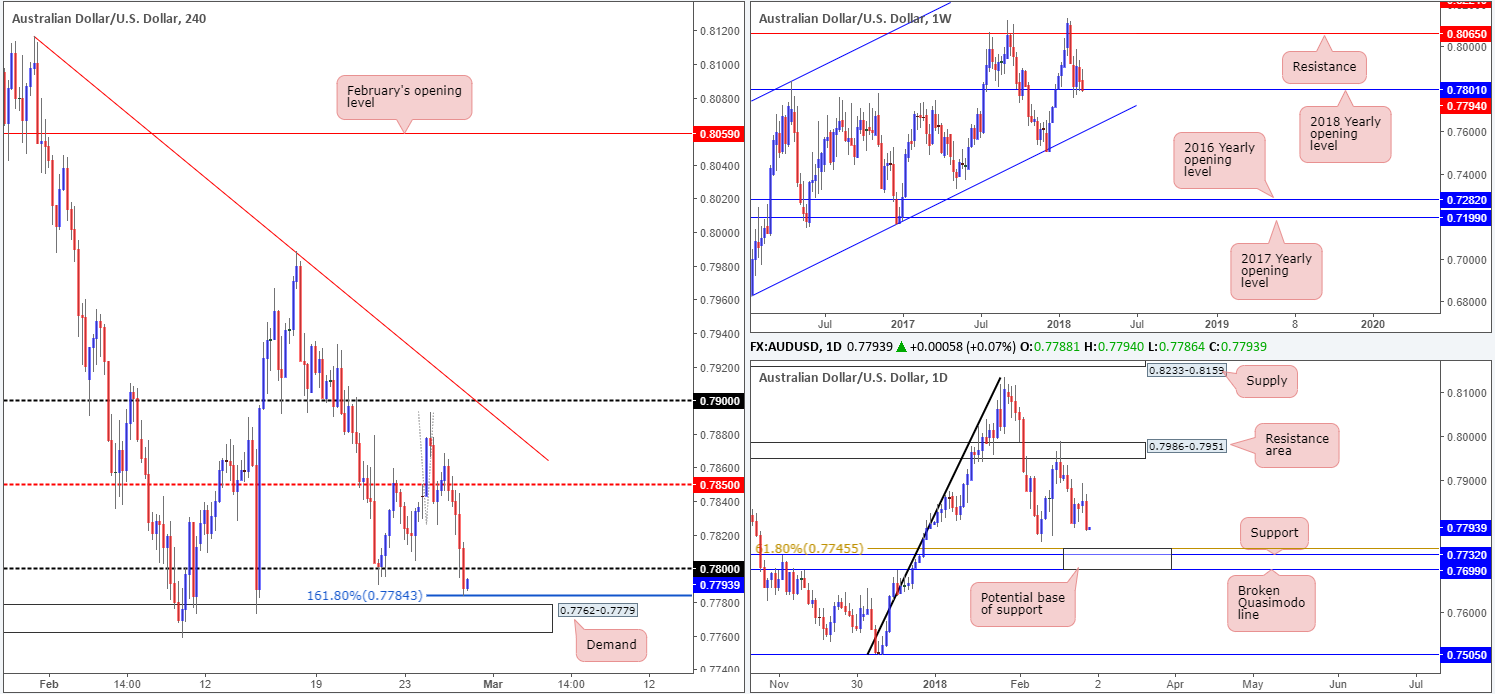
The AUD/USD experienced a somewhat dominant round of selling on Tuesday on the back of broad-based dollar strength. Fed Powell’s first congressional testimony aired optimism for the US economy, consequently pulling the US dollar index firmly above the 90.00 mark.
As you can see, the Aussie ended the day with H4 price driving through the 0.78 handle and crossing swords with a 161.8% H4 Fib ext. point at 0.7784, which is positioned just ahead of a H4 demand base at 0.7762-0.7779. It is also worth noting that the 0.78 handle represents a key level on the weekly timeframe: the 2018 yearly opening level at 0.7801. Daily price, on the other hand, shows that downside is reasonably free until we reach a daily support area at 0.7699/0.7745 (comprised of a broken Quasimodo line, a support level and a 61.8% daily Fib support).
Potential trading zones:
As should be obvious from our notes, selling this market, despite the pair’s recent weakness, is challenging given the nearby H4, daily and weekly support structures.
In order to take advantage of the current support structures offered in this market, the cue for bullish strength, in our opinion, would be a DECISIVE close back above 0.78 on a H4 basis. This will likely clear the path up to at least the 0.7850s and possibly beyond. Waiting for a H4 close higher helps avoid drawdown since price could effectively drive as low as 0.7745 (the top edge of the daily support area) before buyers make an appearance.
Data points to consider: Chinese manufacturing PMI and non-manufacturing PMI at 1am; US prelim GDP q/q at 1.30pm; Chicago PMI at 2.45pm; US pending home sales m/m at 3pm GMT.
Areas worthy of attention:
Supports: 0.7762-0.7779; 0.7784; 0.769/0.7745; 0.7801.
Resistances: 0.7850; 0.78 handle.
USD/JPY:
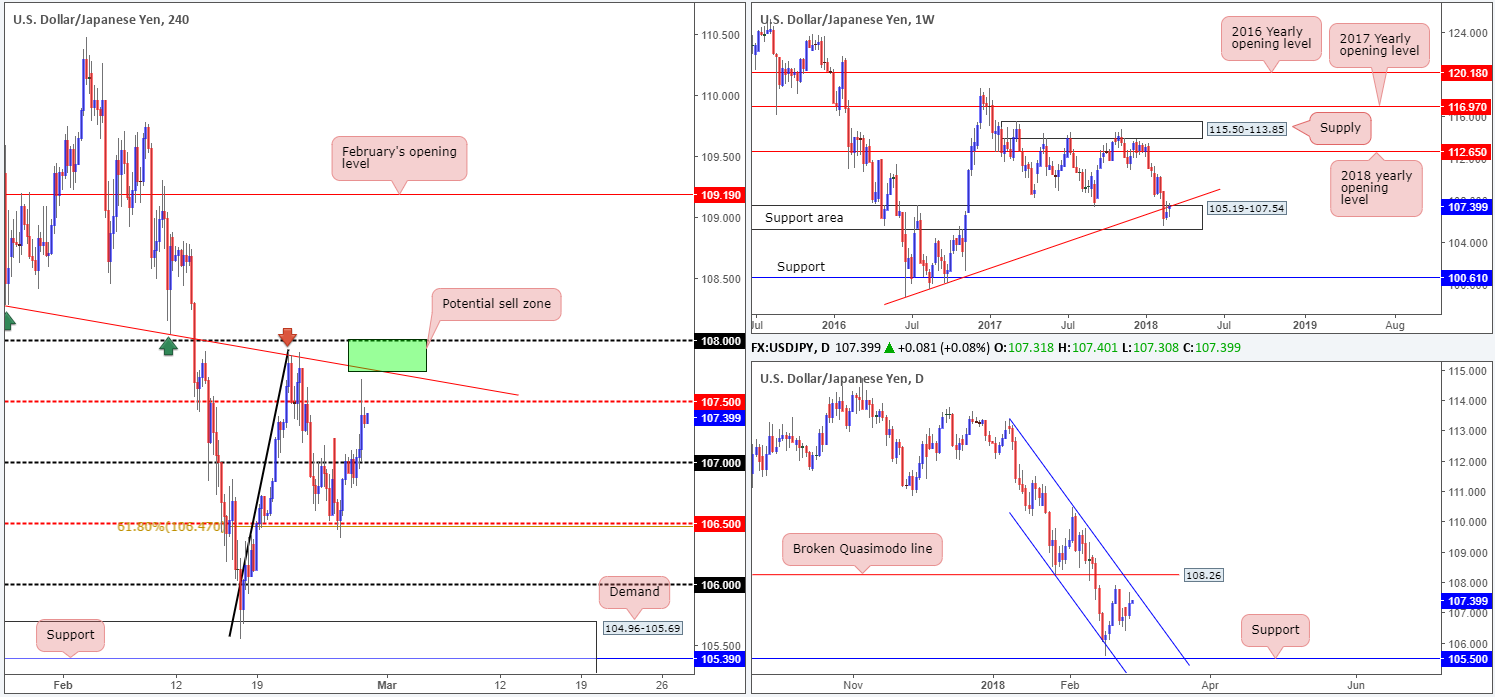
Underpinned by Fed Powell’s first congressional testimony, the US dollar rose higher against its Japanese counterpart on Tuesday. Once price broke through a ceiling of offers around the 107 handle, the pair moved into a higher gear and challenged the H4 mid-level resistance base at 107.50 – just missing the nearby H4 trendline resistance taken from the low 108.28.
According to daily structure, there could be trouble ahead. Since the beginning of the year, the unit has been compressing within a bearish channel (113.38/108.28) and, as you can see, price is nearing the upper limit of this formation. What’s more, we also see additional daily resistance nearby in the form of a broken Quasimodo line at 108.26.
Weekly movement, on the other hand, is seen trading from a weekly support area at 105.19-107.54. However, as highlighted in previous writings, the pair is having trouble overcoming a weekly trendline support-turned resistance extended from the low 98.78.
Potential trading zones:
The aforementioned H4 trendline resistance coupled with the 108 psychological level (green area) is, we believe, an attractive area for shorts. Not only because of the trendline’s history, but also due to the nearby daily channel resistance and weekly trendline resistance mentioned above! Let’s also not forget that this market has been entrenched within a downtrend since the start of the year.
If you intend on trading the above noted H4 sell zone, remain aware that there is a strong possibility of a fakeout through 108 up to 108.26 (the daily broken Quasimodo line). Therefore, consider waiting for additional confirmation before pressing the sell button.
Should the area hold ground, we’d be looking for 107.50 to be taken out relatively quickly. Evidence of buying pressure from this angle is a sign that the trade may fail.
Data points to consider: US prelim GDP q/q at 1.30pm; Chicago PMI at 2.45pm; US pending home sales m/m at 3pm GMT.
Areas worthy of attention:
Supports: 107 handle; 105.19-107.54.
Resistances: 107.50; H4 trendline resistance; weekly trendline resistance; daily channel resistance; 108.26.
USD/CAD:
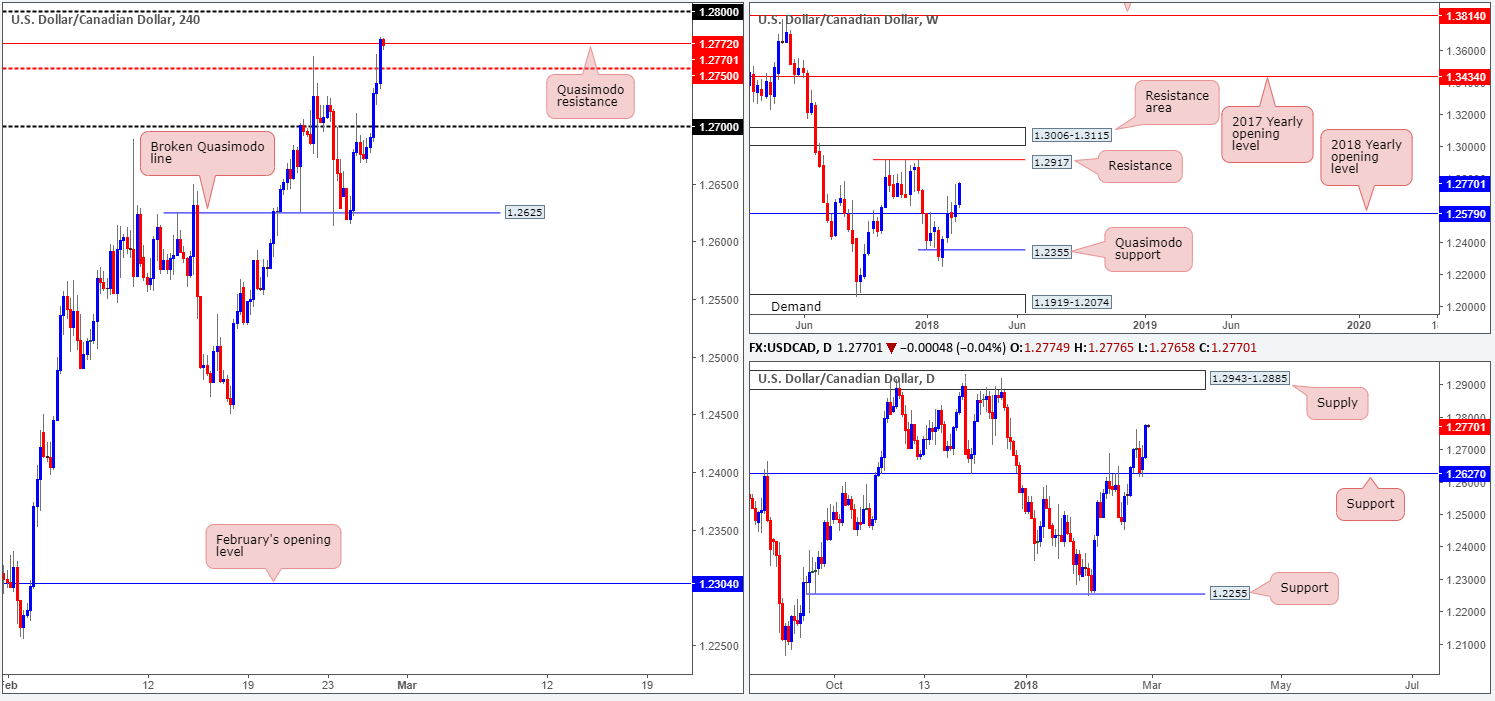
Bolstered by a robust US dollar, thanks to Fed Powell’s optimism, the USD/CAD cranked it up a gear on Tuesday. Breaking through the 1.27 handle and the H4 mid-level resistance base at 1.2750, the pair concluded trade in the shape of a near-full-bodied daily candle at a H4 Quasimodo line drawn from 1.2772.
Despite the current H4 resistance in play, the bigger picture suggests further upside could be on the cards. Daily flow, after beautifully retesting daily support at 1.2627, shows upside is relatively free until we bump heads with daily supply fixed at 1.2943-1.2885. This is further emphasized on the weekly timeframe, as the unit boasts little resistance until the 1.2917 level, which happens to be housed within the said daily supply!
Potential trading zones:
While we absolutely adore Quasimodo levels, shorting from the current H4 Quasimodo resistance is not a trade we would stamp high probability. Besides potential support lurking just below in the form of 1.2750 and the 1.28 handle likely to act as a magnet to price, selling when we know higher-timeframe flow is blowing in a northerly direction is really not a great path to take, in our humble view.
Buying above 1.28 could be an option, however, targeting the noted daily supply. There’s one caveat here, though, and that is a fresh H4 supply formed in Dec 2017 at 1.2846-1.2821. Therefore, constant monitoring is necessary!
Data points to consider: US prelim GDP q/q at 1.30pm; Chicago PMI at 2.45pm; US pending home sales m/m at 3pm; CAD RMPI m/m at 1.30pm; Crude oil inventories at 3.30pm GMT.
Areas worthy of attention:
Supports: 1.2750; 1.27 handle; 1.2627.
Resistances: 1.2772; 1.28 handle; 1.2943-1.2885; 1.2917.
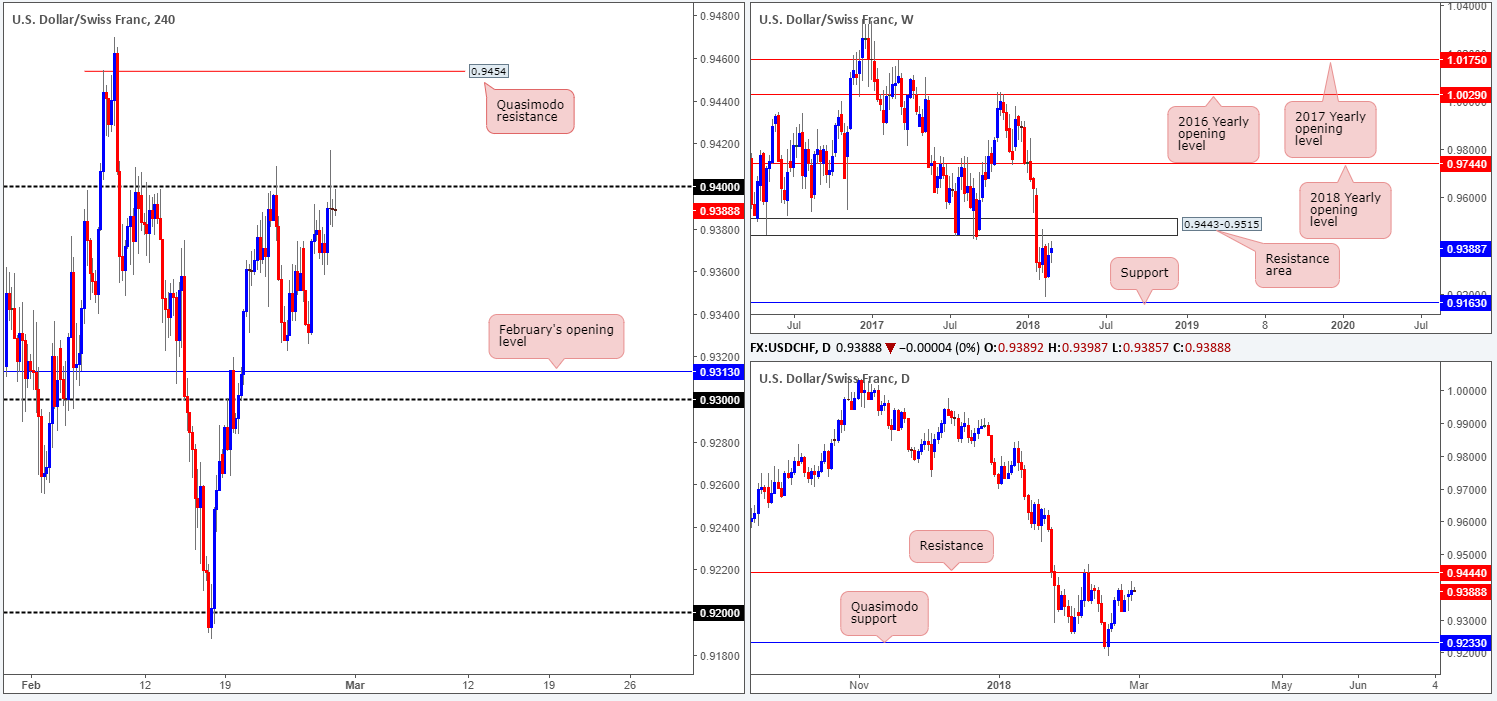
USD/CHF:
Amid a generally well-bid dollar across the board, we witnessed the USD/CHF reconnect with the 0.94 handle on Tuesday. Despite an earnest attempt to push higher from here, registering a session high of 0.9416, the pair failed to sustain gains above this number. Although 0.94 is a clear line of resistance, the H4 Quasimodo resistance marked at 0.9454 remains eyed.
Meanwhile, over on the bigger picture, weekly price shows room to stretch up to the weekly resistance area plotted at 0.9443-0.9515. On the daily chart, the underside of the noted weekly resistance area is represented in the form of a daily resistance level coming in at 0.9444. Do keep an eyeball on these higher-timeframe areas should 0.94 be taken out.
Potential trading zones:
In view of the unit’s close proximity to higher-timeframe resistances, going long is not really something that sparks interest at the moment.
For shorts, eyes are likely on the H4 Quasimodo resistance level marked at 0.9454, despite 0.94 holding firm as resistance. Why we like the Quasimodo is simply due to where it’s positioned on the bigger picture: within the aforesaid weekly resistance area and a few pips above the current daily resistance.
Data points to consider: US prelim GDP q/q at 1.30pm; Chicago PMI at 2.45pm; US pending home sales m/m at 3pm; CHF KOF economic barometer at 8am; CHF Credit Suisse economic projections at 9am GMT.
Areas worthy of attention:
Supports: 0.93 handle; 0.9313.
Resistances: 0.94 handle; 0.9454; 0.9444; 0.9443-0.9515.
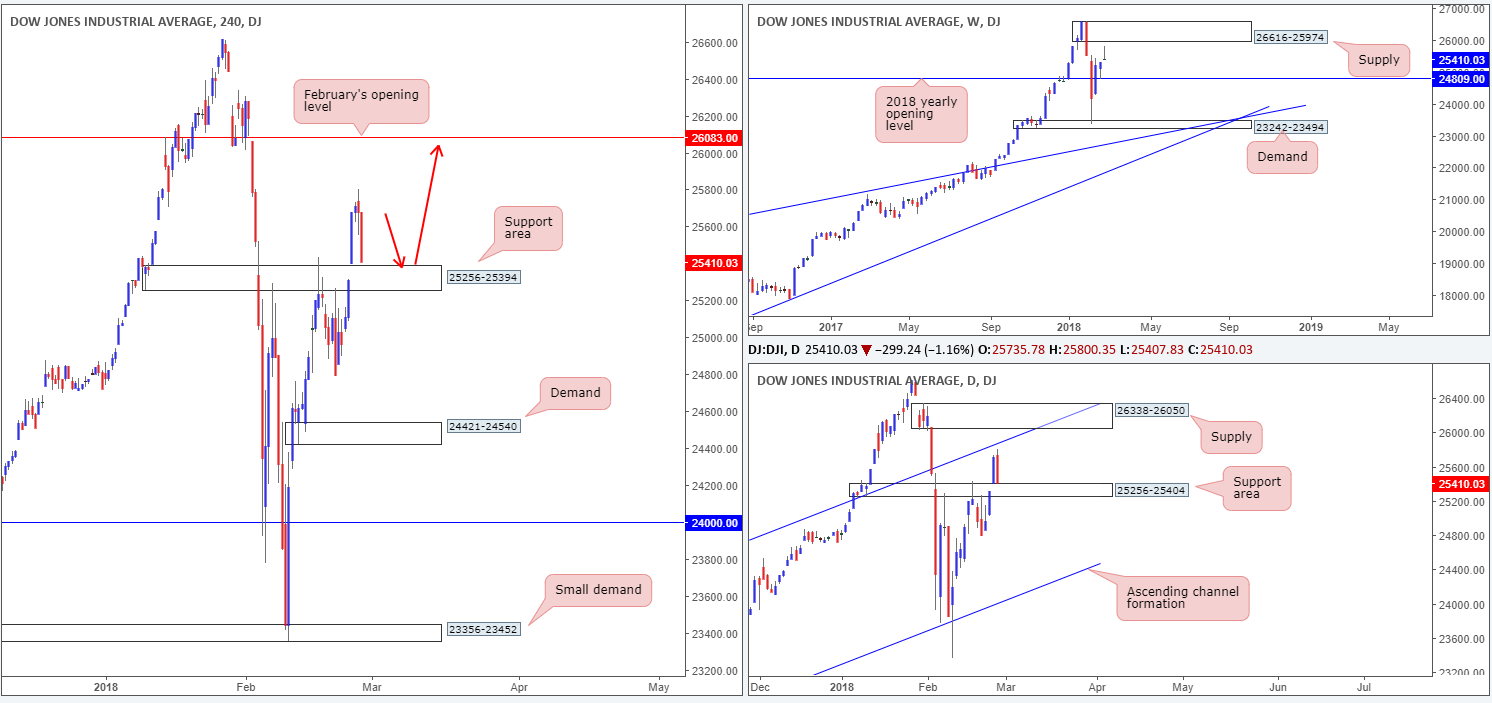
DOW 30:
US equity indexes turned lower on Tuesday, as Federal Reserve Chairman Jerome Powell posted his official first wording on monetary policy. Powell stated that the central bank can continue gradually raising interest rates as the outlook for growth remains strong.
H4 price has pulled back down to just ahead of a H4 support area at 25256-25394. With this area having been a reasonably strong barrier of resistance in the past, there’s a chance the zone will offer support. Also worthy of mention is that this H4 area is seen housed within the limits of a daily support area coming in at 25256-25404. This – coupled with weekly price showing room to move up to the weekly supply zone printed at 26616-25974 – further buying is likely on the cards according to the technicals.
Potential trading zones:
Put simply, buying the dip on a retest of the recently broken H4 resistance area at 25256-25394 should be something to consider today given upside is free on all three timeframes. A retest of the H4 zone, followed up with a H4 full or near-full-bodied bull candle would, in our technical book, be enough to warrant a long trade in this market, targeting February’s opening level at 26803.
Data points to consider: US prelim GDP q/q at 1.30pm; Chicago PMI at 2.45pm; US pending home sales m/m at 3pm GMT.
Areas worthy of attention:
Supports: 25256-25394; 25256-25404.
Resistances: 26083; 26616-25974; daily channel resistance.
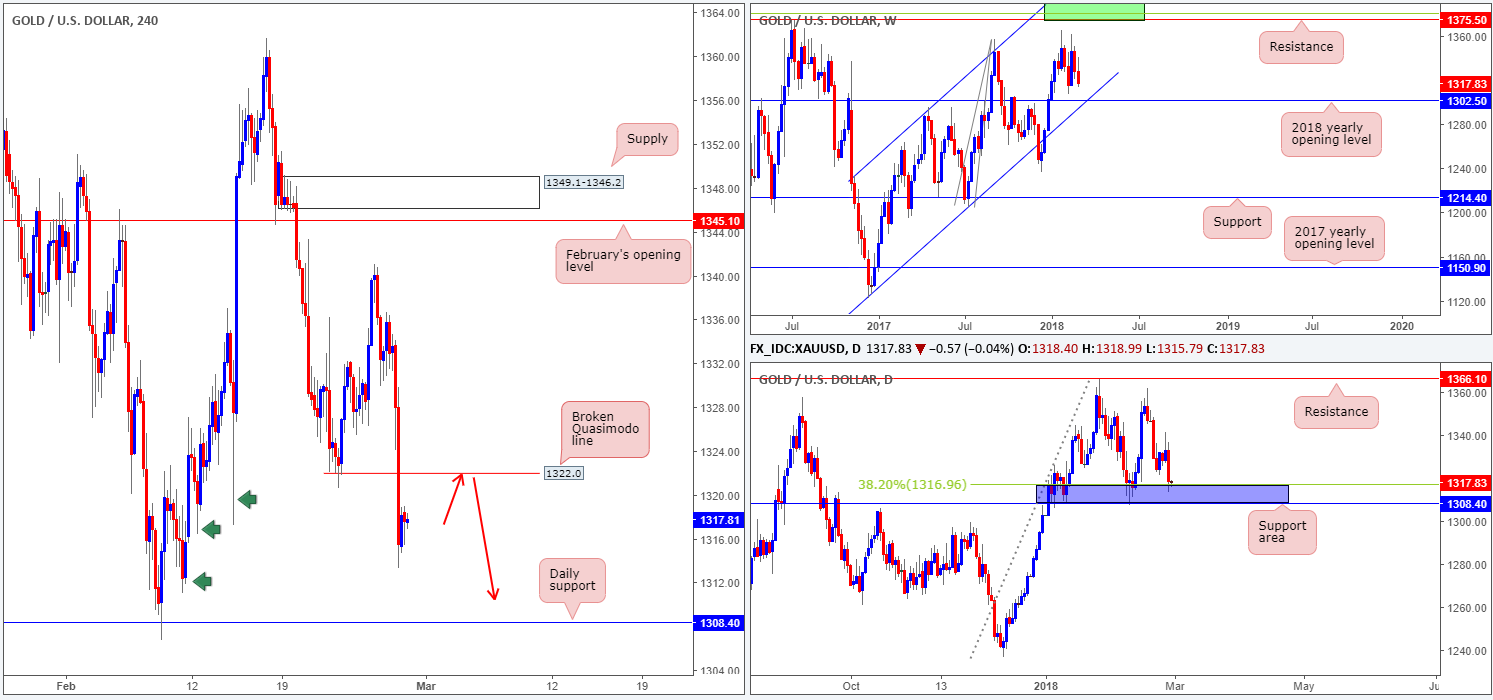
GOLD:
With the US dollar recently climbing above the 90.00 mark on the back of Fed Powell’s first congressional testimony, the gold market fell sharply.
On the weekly chart, this has positioned the yellow metal within a reasonably close proximity to the 2018 yearly opening level at 1302.5, which combines with a weekly channel support extended from the low 1122.8. In other words, weekly action shows room for bullion to extend losses. Meanwhile, down on the daily timeframe, the recent bout of selling has brought the candles to a daily support area marked in blue at 1308.4-1316.9 (comprised of a daily support and 38.2% Fib support level). As you can see, there’s a clear difference of opinion in terms of higher-timeframe flows at the moment.
Potential trading zones:
With the H4 Quasimodo support at 1322.0 now out of the picture, this could be a level to consider shorting on a retest play (see red arrows). By selling this level, however, you would be shorting into a potential buy zone on the daily chart. The flip side to this, of course, is that you would simultaneously be selling alongside weekly flow as price on that scale shows room to push lower.
Should you consider the short as a valid opportunity, we would strongly advise waiting for additional candle confirmation in the form of a full or near-full-bodied H4 bearish candle. Although this will not guarantee a winning trader, it will show seller intent. As for take-profit targets, we would look to partially close out some at the top edge of the daily support area at 1316.9, and leave the rest to run down to daily support at 1308.4, followed closely by the 2018 yearly opening level mentioned above at 1302.5.
Areas worthy of attention:
Supports: 1308.4/1316.9; 1302.5; weekly channel support.
Resistances: 1332.0.
This site has been designed for informational and educational purposes only and does not constitute an offer to sell nor a solicitation of an offer to buy any products which may be referenced upon the site. The services and information provided through this site are for personal, non-commercial, educational use and display. IC Markets does not provide personal trading advice through this site and does not represent that the products or services discussed are suitable for any trader. Traders are advised not to rely on any information contained in the site in the process of making a fully informed decision.
This site may include market analysis. All ideas, opinions, and/or forecasts, expressed or implied herein, information, charts or examples contained in the lessons, are for informational and educational purposes only and should not be construed as a recommendation to invest, trade, and/or speculate in the markets. Any trades, and/or speculations made in light of the ideas, opinions, and/or forecasts, expressed or implied herein, are committed at your own risk, financial or otherwise.
The use of the site is agreement that the site is for informational and educational purposes only and does not constitute advice in any form in the furtherance of any trade or trading decisions.
The accuracy, completeness and timeliness of the information contained on this site cannot be guaranteed. IC Markets does not warranty, guarantee or make any representations, or assume any liability with regard to financial results based on the use of the information in the site.
News, views, opinions, recommendations and other information obtained from sources outside of www.icmarkets.com.au, used in this site are believed to be reliable, but we cannot guarantee their accuracy or completeness. All such information is subject to change at any time without notice. IC Markets assumes no responsibility for the content of any linked site. The fact that such links may exist does not indicate approval or endorsement of any material contained on any linked site.
IC Markets is not liable for any harm caused by the transmission, through accessing the services or information on this site, of a computer virus, or other computer code or programming device that might be used to access, delete, damage, disable, disrupt or otherwise impede in any manner, the operation of the site or of any user’s software, hardware, data or property.


