A note on lower timeframe confirming price action…
Waiting for lower timeframe confirmation is our main tool to confirm strength within higher timeframe zones, and has really been the key to our trading success. It takes a little time to understand the subtle nuances, however, as each trade is never the same, but once you master the rhythm so to speak, you will be saved from countless unnecessary losing trades. The following is a list of what we look for:
- A break/retest of supply or demand dependent on which way you’re trading.
- A trendline break/retest.
- Buying/selling tails/wicks – essentially we look for a cluster of very obvious spikes off of lower timeframe support and resistance levels within the higher timeframe zone.
- Candlestick patterns. We tend to only stick with pin bars and engulfing bars as these have proven to be the most effective.
We search for lower timeframe confirmation between the M15 and H1 timeframes, since most of our higher-timeframe areas begin with the H4. Stops are usually placed 5-10 pips beyond confirming structures.
EUR/USD:
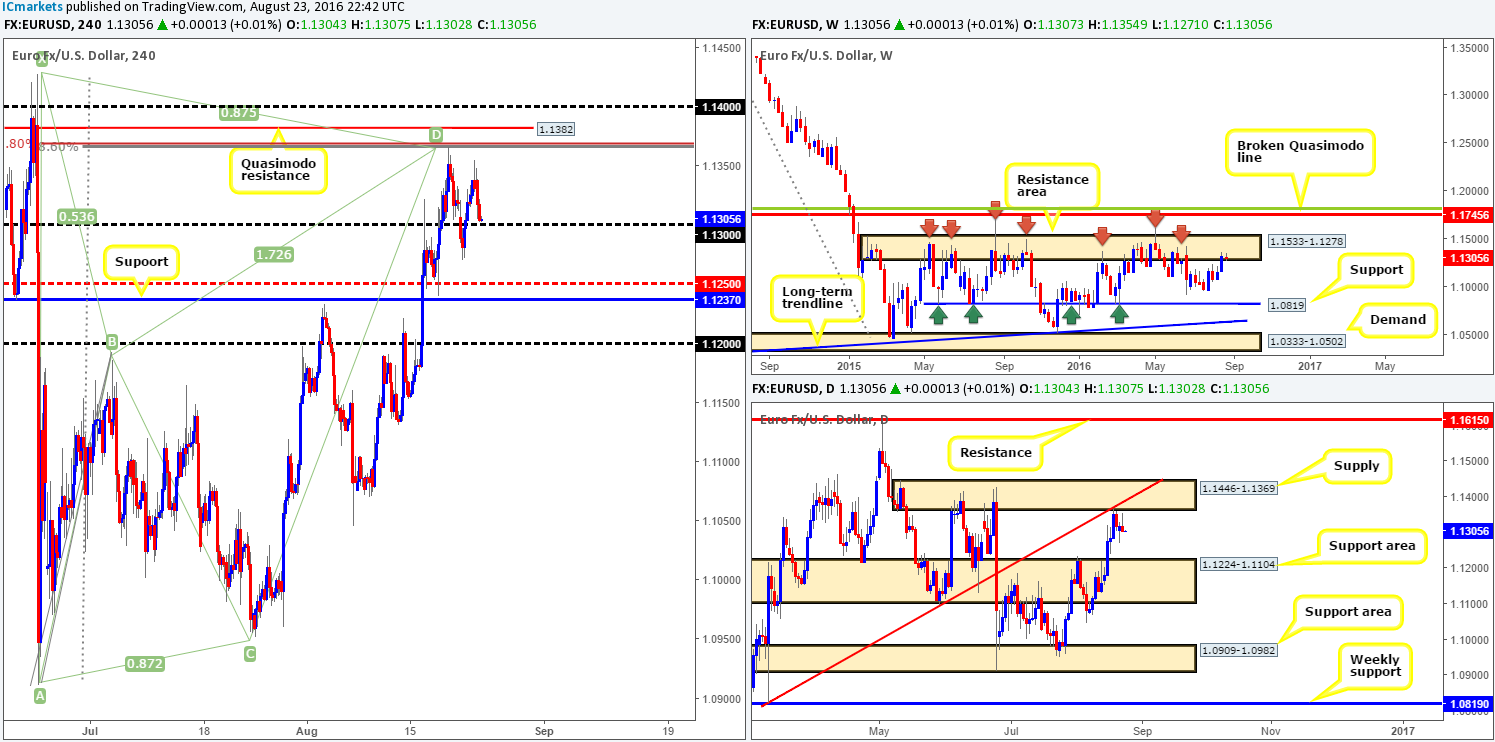
In recent trading, we saw the shared currency top out around the 1.1350ish area and close the day just ahead of the 1.13 handle. For those who have been following our reports you may recall that our team remains short from 1.1362 with 50% of our position already banked and the stop set firmly at breakeven.
Since weekly action currently occupies a major weekly resistance zone at 1.1533-1.1278, and daily price is seen trading from a nearby daily supply area at 1.1446-1.1369, we feel that the 1.13 band will likely be consumed today. A decisive close beyond 1.13 would likely open the gates for the EUR to challenge the 1.1250/1.1237 range (H4 mid-way support/H4 support), which sits just above the daily support area seen at 1.1224-1.1104: the next downside target on the daily timeframe.
Our suggestions: For traders who shorted alongside us at 1.1362, we suggest holding your position since price looks set to break through 1.13 and attack the 1.1250/1.1237 region (our final take-profit zone). For those that missed our initial call to sell, a close below 1.13 followed by a retest and a lower timeframe sell signal (see the top of this report for guidance) would, in our opinion, be enough to constitute an intraday sell position, targeting 1.1250/1.1237.
Levels to watch/live orders:
- Buys: Flat (Stop loss: N/A).
- Sells: 1.1362 [LIVE] (Stop loss: Breakeven). Watch for price to close below 1.13 and then look to trade any retest seen thereafter (lower timeframe confirmation required).
GBP/USD:
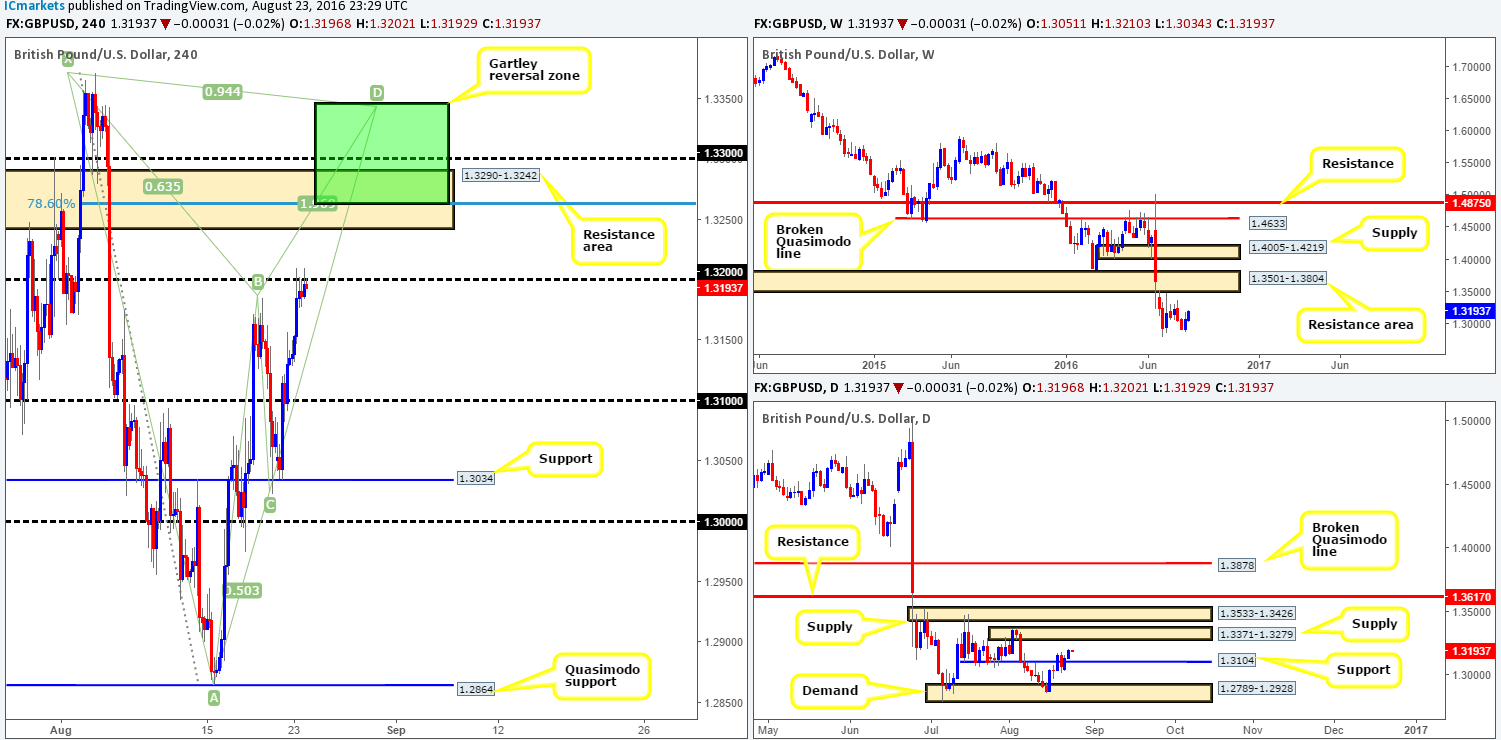
The buyers managed to find their feet early on in the day yesterday, bidding sterling up to the 1.32 handle going into the early hours of the European open, which shortly after saw price consolidate for the remainder of the trading day. Looking at the H4 candle action, it appears that the bulls remain in the driving seat for the time being.
With that being said, how do things stand on the higher timeframes? Daily action has put in some space above the recently broken resistance level at 1.3104 (now acting support), suggesting that the bulls may continue to march north today to shake hands with the daily supply zone seen at 1.3371-1.3279. In addition to this, weekly candles recently chalked up a relatively nice-looking bullish engulfing candle, which seems to have sparked a bullish reaction in the market. However, while further upside is possible let’s not forget that this pair remains in a relatively strong downtrend at present!
Our suggestions: Watch for the unit to breach the 1.32 handle today as this would likely prompt further buying up to a H4 resistance area at 1.3290-1.3242, and more importantly, the H4 harmonic Gartley reversal zone seen between 1.3346/1.3263 (green zone). Seeing as how this H4 harmonic area is lodged within the daily supply mentioned above at 1.3371-1.3279 and the predominant trend is pointing south, a short within this region is certainly something that interests us. Ideally, we’re looking to sell around the 1.33ish region with our stops placed above the X point of the H4 harmonic pattern.
Levels to watch/live orders:
- Buys: Flat (Stop loss: N/A).
- Sells: 1.33 region (Stop loss: 1.3374).
AUD/USD:
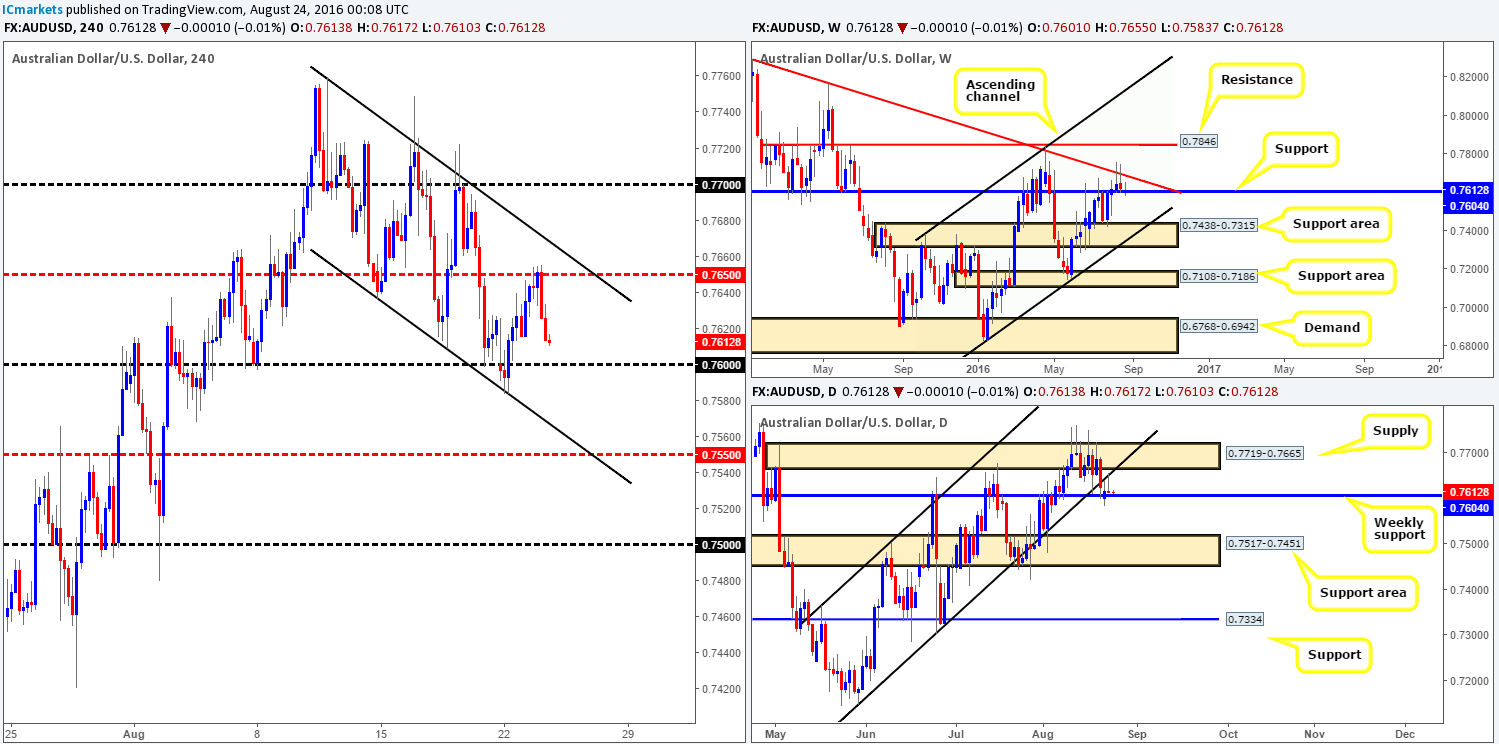
Weekly buyers appear sluggish around the current weekly support level drawn from 0.7604. Any sustained move below this barrier would likely place the weekly support area at 0.7438-0.7315 (merges with a weekly channel support line taken from the low 0.6827) in the firing range. In addition to the weekly picture, daily price ended the day chalking up a picture-perfect bearish pin bar off the underside of the recently broken channel support line extended from the low 0.7148. Beyond the above said weekly support level, the next downside target on the daily scale can be seen at 0.7517-0.7451: a daily support area (positioned just above the aforementioned weekly support area). Stepping across to the H4 chart, the 0.7650 mid-way number provided a solid resistance line for the market yesterday, consequently pushing the commodity currency to lows of 0.7613.
Our suggestions: Buying this pair, given the higher-timeframe’s response to the current weekly support (see above), is not something we’d stamp high probability. In regard to selling, however, with both the weekly support and the 0.76 handle now seen within striking distance, selling this market is also not something we’d feel comfortable participating in UNTIL we see a daily close beyond the weekly support barrier.
Therefore, until this comes into view, opting to stand on the sidelines here may very well be the best path to take today.
Levels to watch/live orders:
- Buys: Flat (Stop loss: N/A).
- Sells: Flat (Stop loss: N/A).
USD/JPY:
(Since there was little change seen yesterday, much of the following analysis is similar to Tuesday’s report)
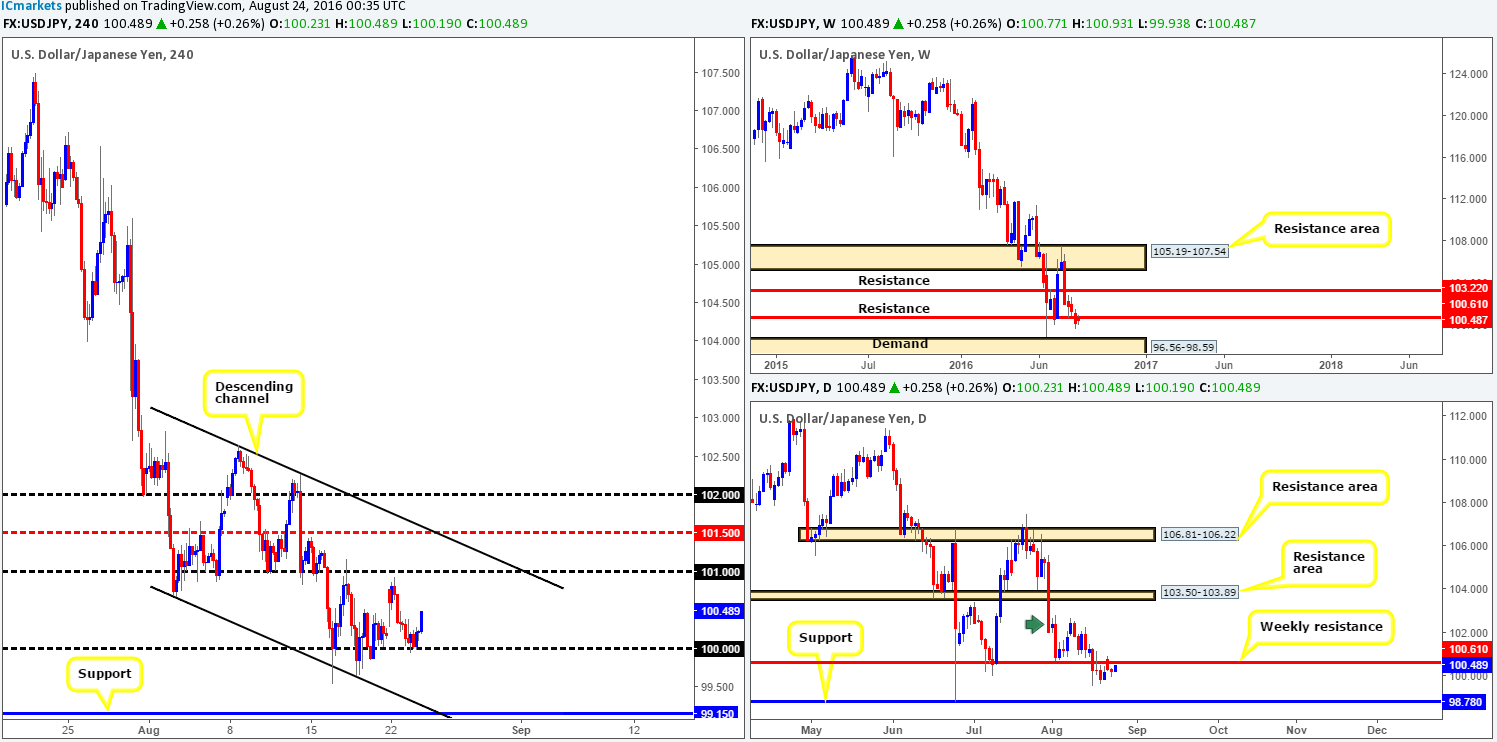
Based on recent price action, we can see that the buyers (once again) defended the key figure 100, and is at the time of writing, advancing north. As mentioned in our previous report, the USD/JPY pair has entered into a phase of consolidation fixed between the key figure 100 and the 101 handle. The 101 band is likely to remain a strong resistance with it having been a solid support on several occasions at the beginning of August. Nevertheless, the 100 hurdle is also proving to be a stubborn beast!
However, with the higher timeframes loitering around a weekly resistance level at 100.61 at the moment, the 100 figure is likely to be taken out soon. A decisive H4 close below here followed by a strong retest would, at least in our book, confirm selling strength in this market and likely push the unit south to test H4 support at 99.15, which merges beautifully with a H4 channel support line drawn from the low 100.68 (sits above a daily support at 98.78 which is also positioned above weekly demand at 96.56-98.59).
Our suggestions: An ideal setup would be to witness a decisive close below 100 along with a retest and a lower timeframe sell signal (see the top of this report), targeting the above noted H4 support.
Levels to watch/live orders:
- Buys: Flat (Stop loss: N/A).
- Sells: Watch for price to close below the 100 handle and then look to trade any retest seen thereafter (lower timeframe confirmation required).
USD/CAD:
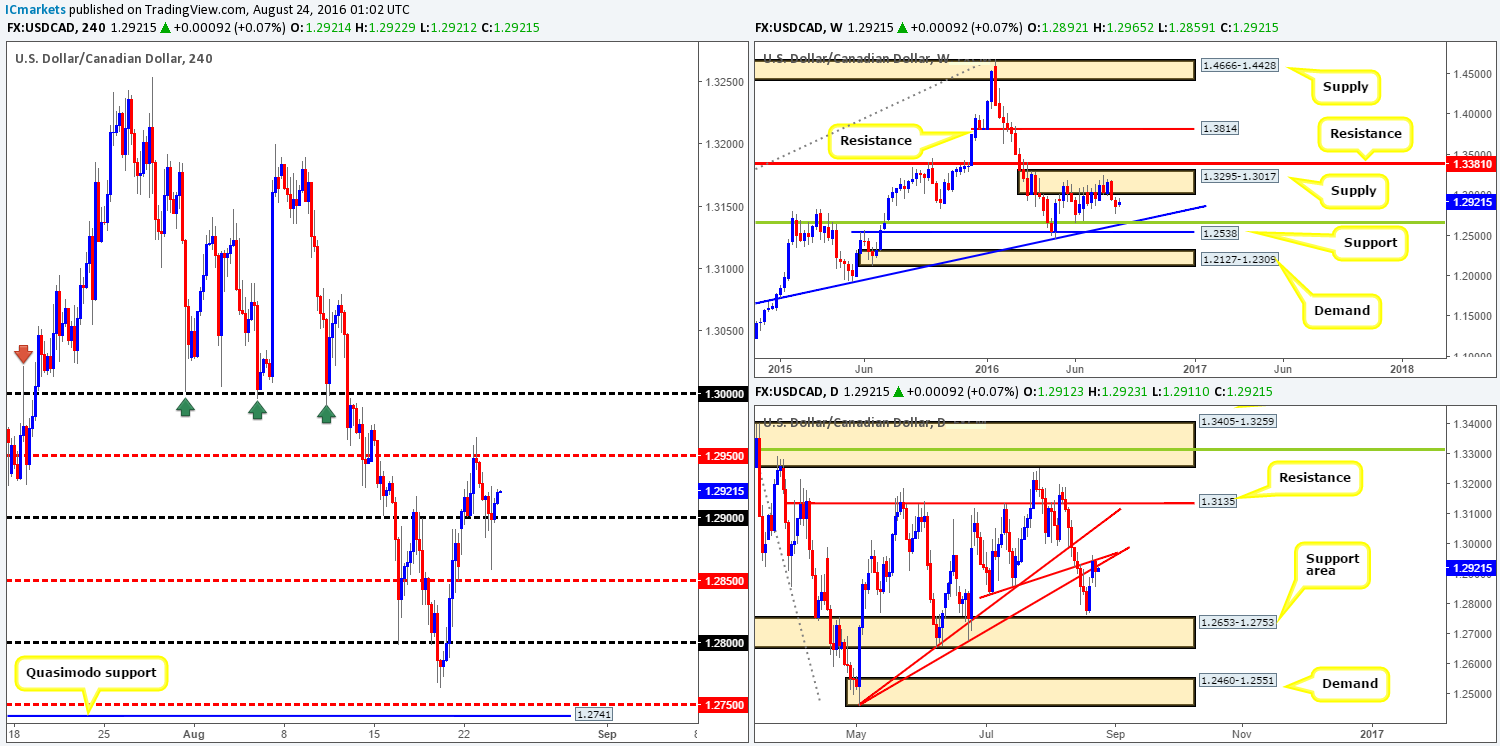
After price shook hands with the H4 mid-way resistance 1.2950, a relatively strong wave of offers flooded the market. The psychological band 1.29 suffered an aggressive whipsaw going into yesterday’s US open, missing the H4 mid-way support 1.2850 by ten or so pips! Despite this, the 1.29 number remains firm.
Although the loonie is currently bid from 1.29, higher-timeframe technicals indicate further selling could be on the cards today. Daily candles are currently seen flirting with two daily trendline resistances (1.2460/1.2831), while a weekly supply area coming in at 1.3295-1.3017 continues to cap upside.
Our suggestions: Look for the H4 to close beyond 1.29, as this could trigger further selling. To enter short below 1.29, however, we’d need to see price retest this number as resistance alongside a lower timeframe sell signal (see the top of this report). Assuming we manage to pin down an entry here, we’d trail price (using the psychological barriers) down to the 1.2750ish range. Why 1.2750? Well, this is simply because this number represents the top edge of the daily support area at 1.2653-1.2753: the next downside target on the higher timeframes.
Levels to watch/live orders
- Buys: Flat (Stop loss: N/A).
- Sells: Watch for price to close below the 1.29 handle and then look to trade any retest seen thereafter (lower timeframe confirmation required).
USD/CHF:
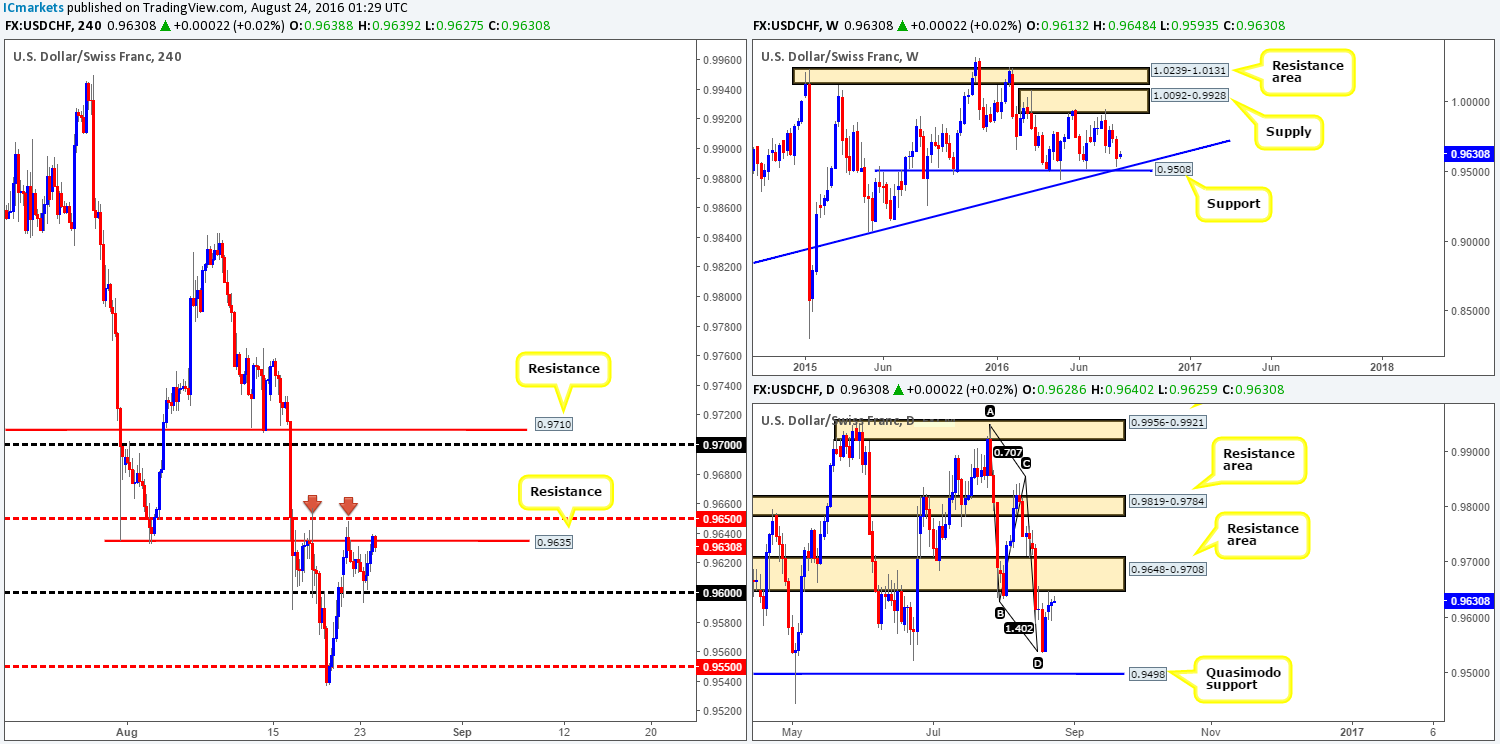
The Swissy managed to reclaim the 0.96 handle yesterday, consequently forcing the unit back up to the H4 resistance level registered at 0.9635 by the day’s close. Between this H4 resistance and the H4 mid-way resistance 0.9650, this area has held prices lower on two occasions already (see red arrows). Now, couple this with a daily resistance area at 0.9648-0.9708 that supports the 0.9650/0.9635 range, a sell off from this area could very well be seen again. Here’s the kicker though! Up on the weekly chart, price recently came within shouting distance of connecting with support at 0.9508 (fuses nicely with a trendline support extended from the low 0.8703). Under these circumstances, weekly bulls could have already potentially loaded up to rally north from here!
Our suggestions: Similar to what was mentioned in our previous report, there’s one of three ways that we see traders can approach this market:
- Remain flat.
- Traders could look to sell from the 0.9650/0.9635 region with the backing of a lower timeframe sell signal (see the top of this report), targeting 0.96, followed by the 0.9550 region.
- And finally, we could wait for a close above 0.9650 today and look to trade any retest seen thereafter (again with the backing of a lower timeframe buy signal), targeting the 0.9710/0.97 range.
Levels to watch/live orders:
- Buys: Watch for price to close above the 0.9650/0.9635 area and then look to trade any retest seen thereafter (lower timeframe confirmation required).
- Sells: 0.9650/0.9635 [Tentative – confirmation required] (Stop loss: dependent on where one confirms this area).
DOW 30:
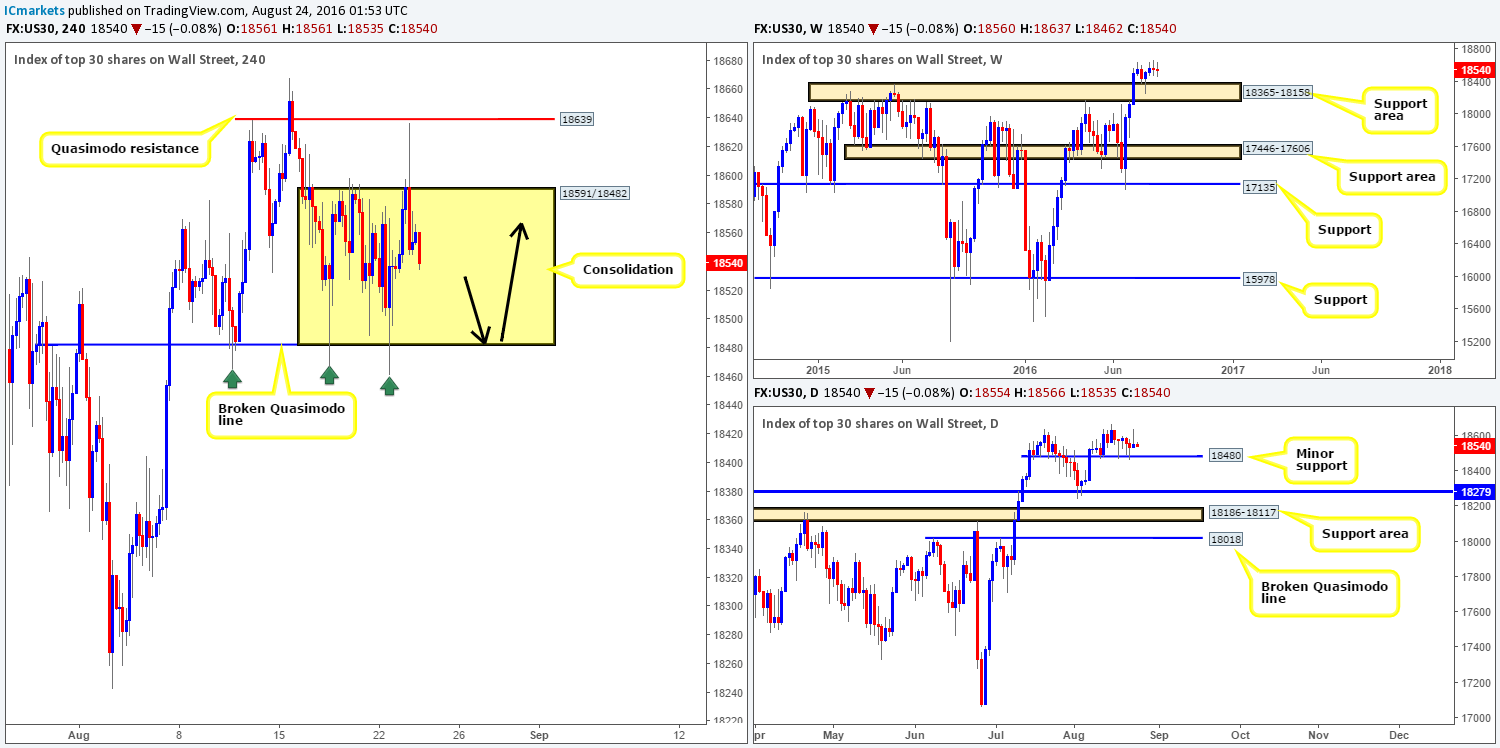
Despite seeing price aggressively spike towards the H4 Quasimodo resistance level at 18639 yesterday, the DOW remains trading within a H4 consolidation zone fixed between a broken Quasimodo line at 18482 and a resistance drawn in at 18591. Although, the index recently came under pressure, we do not consider this to be a bearish move until a daily close is seen beyond the minor daily support at 18480, as this will likely lead to continuation move south down to test daily support seen at 18279 (lodged within a weekly support area coming in at 18365-18158).
Our suggestions: Should price continue to trade in the red today, keep a close eye on the lower edge of the current H4 range: the H4 broken Quasimodo line at 18482. This barrier has managed to withstand three bearish attacks (see green arrows) and could, given the overall trend the US stock market is in right now, very well hold firm for a fourth time. With that being the case, watch for price to connect with this edge and wait for lower timeframe confirmation to enter long (see the top of this report for a list of lower timeframe entry techniques), targeting the upper edge of the H4 range (18591) as your first take-profit zone.
Levels to watch/live orders:
- Buys: 18482 region [Tentative – confirmation required] (Stop loss: dependent on where one confirms this area).
- Sells: Flat (Stop loss: N/A).
GOLD:
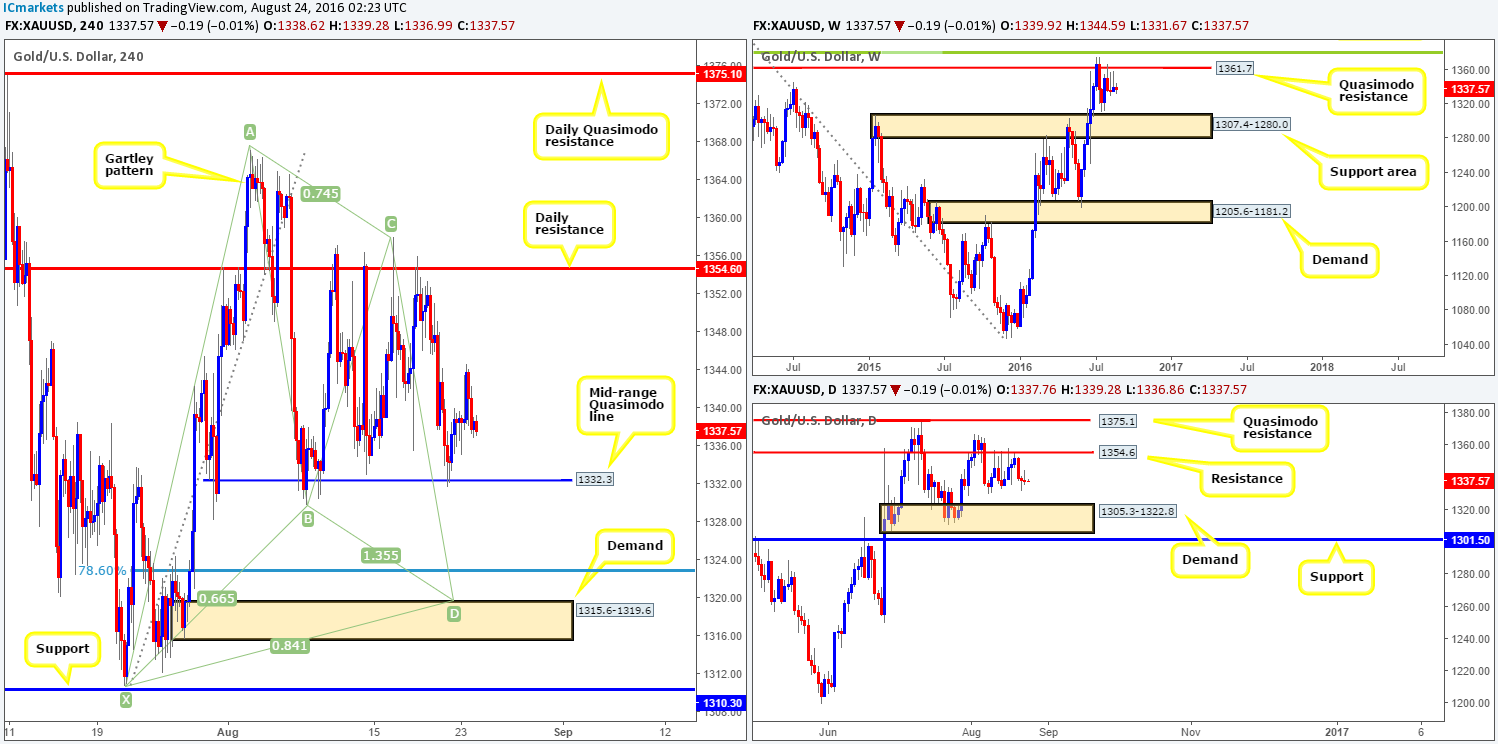
Looking at the H4 chart this morning, we’re not convinced that the mid-range Quasimodo line at 1332.3 is durable enough to support the yellow metal for long. Our reasoning behind this approach lies within the higher-timeframe structure. With weekly action recently printing its second consecutive selling wick just ahead of a Quasimodo resistance level at 1361.7, downward pressure could possibly be seen towards a support area coming in at 1307.4-1280.0. Adding to that, our team sees space for the bears to dig lower on the daily chart down to a demand seen at 1305.3-1322.8, which is located on top of the aforementioned weekly support area.
Our suggestions: Given the above points, we’re watching for a clean break below the current H4 mid-range Quasimodo line. Followed up with a retest to the underside of this level as well as a lower timeframe confirmed sell signal (see the top of this report), this is an ideal place to short from targeting the H4 demand at 1315.6-1319.6.
Should price reach this H4 demand base, all of our short positions will be liquidated and we’ll then go about looking to possibly enter long at market (dependent on the approach and time of day) from this area. However, do be prepared for price to drive below this zone before buyers step in! The reason as to why is because along with the H4 demand and it’s supporting higher-timeframe demands (see above in bold), we also have a merging H4 harmonic Gartley reversal zone seen between the H4 78.6% Fib support at 1322.8 and the X point of the H4 harmonic pattern at 1310.7.
Levels to watch/live orders:
- Buys: 1315.6-1319.6 [Dependent on the approach and time of day a market long is possible] (Stop loss: below the X point of the H4 harmonic formation: 1309.1, which is, as you can see, set just beyond the H4 support at 1310.3).
- Sells: Watch for price to close below the H4 mid-range Quasimodo level at 1332.3 and then look to trade any retest seen thereafter (lower timeframe confirmation required).


