A note on lower timeframe confirming price action…
Waiting for lower timeframe confirmation is our main tool to confirm strength within higher timeframe zones, andhas really been the key to our trading success. It takes a little time to understand the subtle nuances, however, as each trade is never the same, but once you master the rhythm so to speak, you will be saved from countless unnecessary losing trades. The following is a list of what we look for:
- A break/retest of supply or demand dependent on which way you’re trading.
- A trendline break/retest.
- Buying/selling tails – essentially we look for a cluster of very obvious spikes off of lower timeframe support and resistance levels within the higher timeframe zone.
- Candlestick patterns. We tend to only stick with pin bars and engulfing bars as these have proven to be the most effective.
EUR/USD:
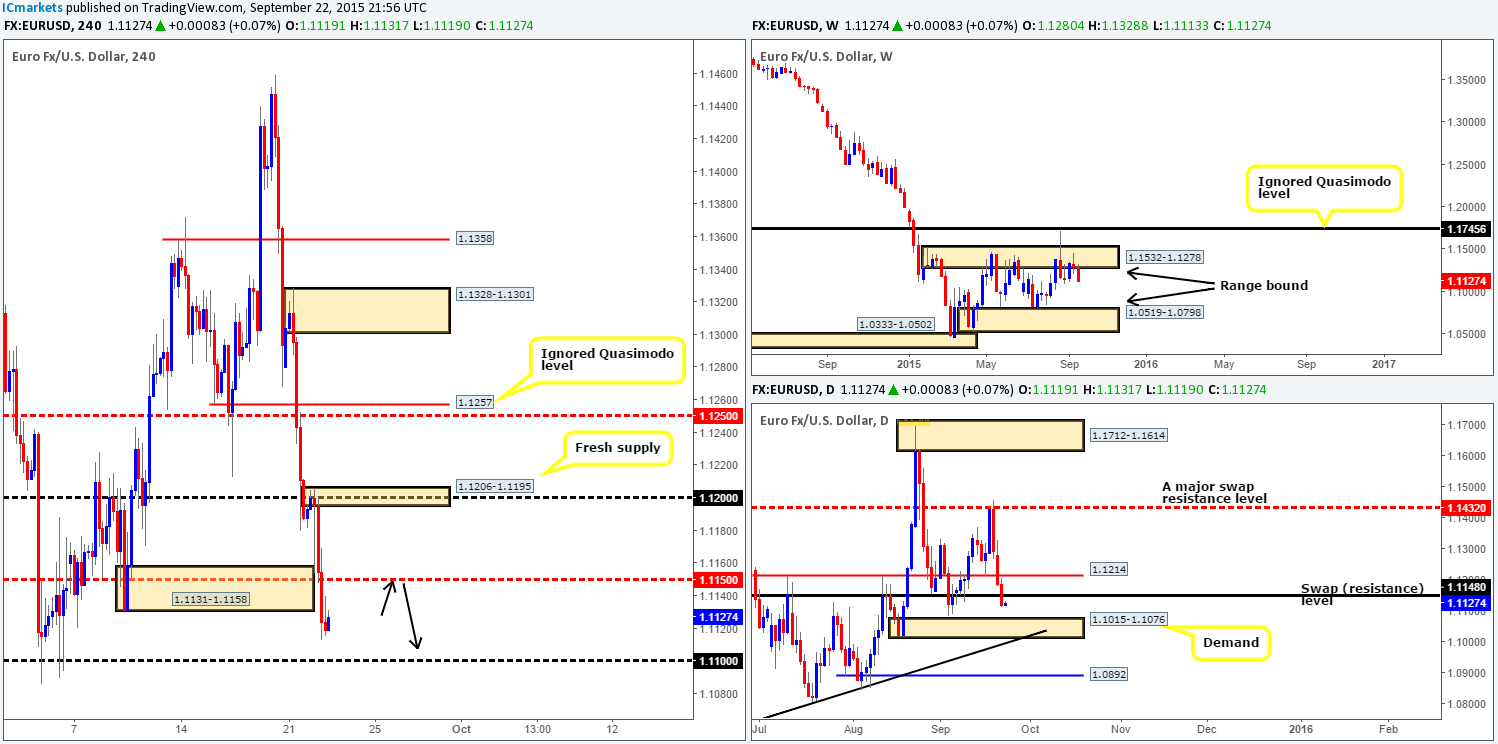
Using a top-down approach this morning, the weekly timeframe shows that price is currently selling off from supply at 1.1532-1.1278. As a consequence, this led to yet another swap support level (1.1148) being engulfed on the daily timeframe. The next downside target to watch on this scale falls in at 1.1015-1.1076 – a fresh demand zone with trendline confluence (1.0519).
For those who read our previous report: http://www.icmarkets.com/blog/tuesday-22nd-september-daily-technical-outlook-and-review/ you may remember us mentioning to keep a close eye on potential sells from the underside of 1.1200. As you can see, price respected this level beautifully going into London trade. Well done to any of our readers who managed to lock in some green pips from this move. In addition to this, we also said, should the EUR decline, we’d be interested in buying at demand drawn from 1.1131-1.1158, which unfortunatelyfailed to hold.
Pushing forward, given the market’s position on the higher timeframes (see above) at the moment, there is a strong possibility that the EUR will continue to depreciate today/the rest of this week. Therefore, at least for the time being, our attention will mostly be driven toward shorting this market.
Battle lines going into today’s sessions are the mid-level barrier 1.1150 and the fresh supply zone at 1.1206-1.1195. We chose 1.1150 simply because this number converges nicely with a daily swap (resistance) level mentioned above at 1.1148. Should price retest this number and we manage to spot lower timeframe selling confirmation from here, we’ll be eyeing 1.1100 as our immediate take-profit area, followed closely by 1.1076 – the top-side of daily demand. Alternatively, in the event that 1.1150 fails to hold this market lower today, our team will then shift their attention to the fresh 4hr supply zone sitting fifty pips above at 1.1206-1.1195 to look for potential (confirmed) shorts.
Levels to watch/live orders:
- Buys: Flat (Stop loss: N/A).
- Sells:1.1150 [Tentative- confirmation required] (Stop loss: dependent on where one confirms this level) 1.1206-1.1195 [Tentative- confirmation required] (Stop loss: dependent on where one confirms this area).
GBP/USD:
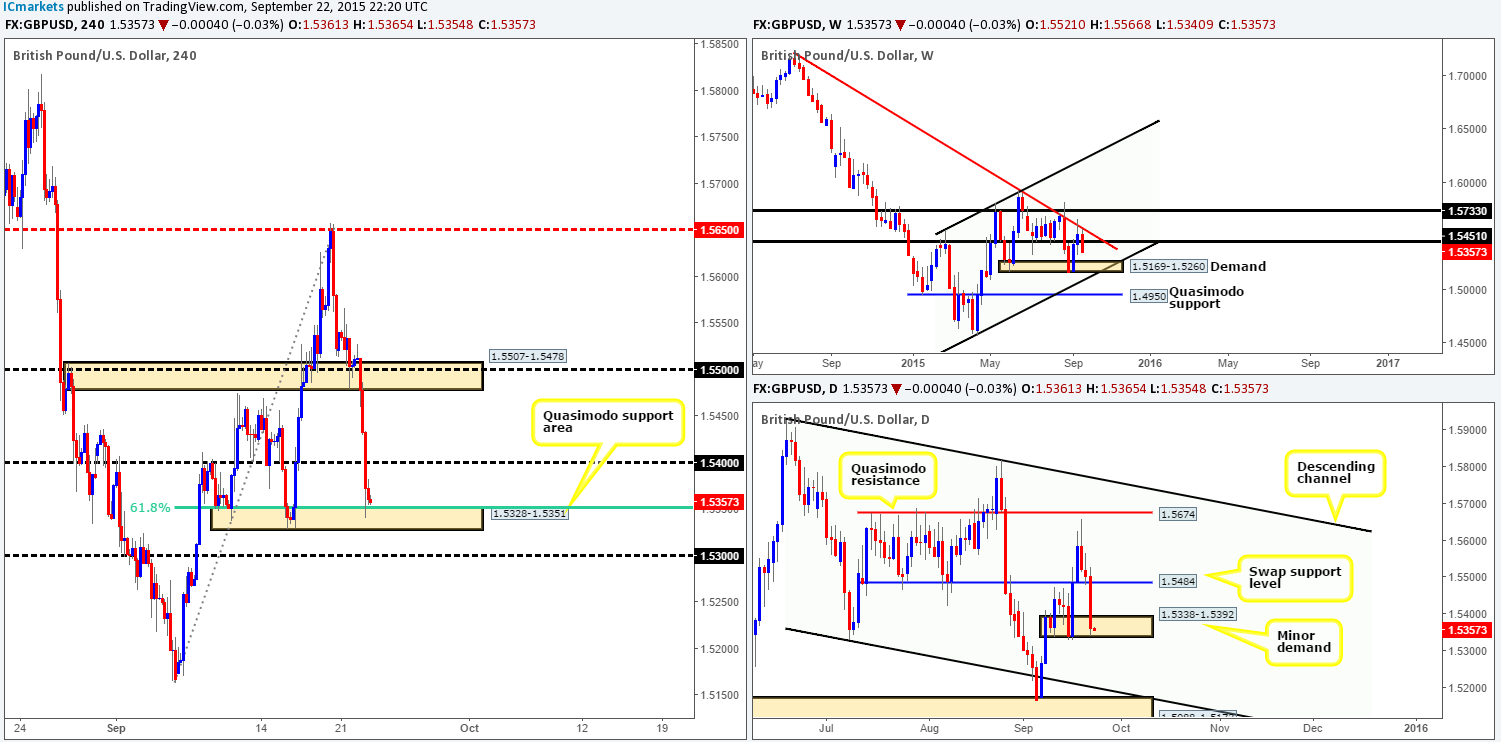
Pound Sterling continued to sink against the U.S. dollar during the course of yesterday’s sessions. The 150-pip sell-off punched through bids sitting not only at demand from 1.5507-1.5478, but also psychological support 1.5400. It was only once price crossed paths with a Quasimodo support area at 1.5328-1.5351 (converges beautifully with the 61.8% Fib level) did we see things begin to calm down.
Scanning across to the weekly timeframe, we can see that the swap support level at 1.5451 has been breached. In the event that the sellers maintain this momentum, we could see price reach demand at 1.5169-1.5260 sometime soon. Down on the daily chart, however, the buyers and sellers are currently battling for position deep within minor demand found at 1.5338-1.5392.
With the above points taken into consideration, here is what we have noted so far:
- Potential long trade from the 4hr Quasimodo support area at 1.5328-1.5351. Lower timeframe confirmation required due to the position of price on the weekly scale (see above). Should we enter into a long position here today, partial profits should be taken at 1.5400. Beyond here, however, we’ll be looking to ride the remaining position up to 1.5507-1.5478 – a swap supply barrier.
-
A push below the aforementioned Quasimodo support is, in our opinion, not a cue to begin looking for sells, since psychological support at 1.5300 is lurking just below.
Levels to watch/ live orders:
- Buys: 1.5328-1.5351 [Tentative – confirmation required] (Stop loss: 1.5320).
- Sells: Flat (Stop loss: N/A).
AUD/USD:
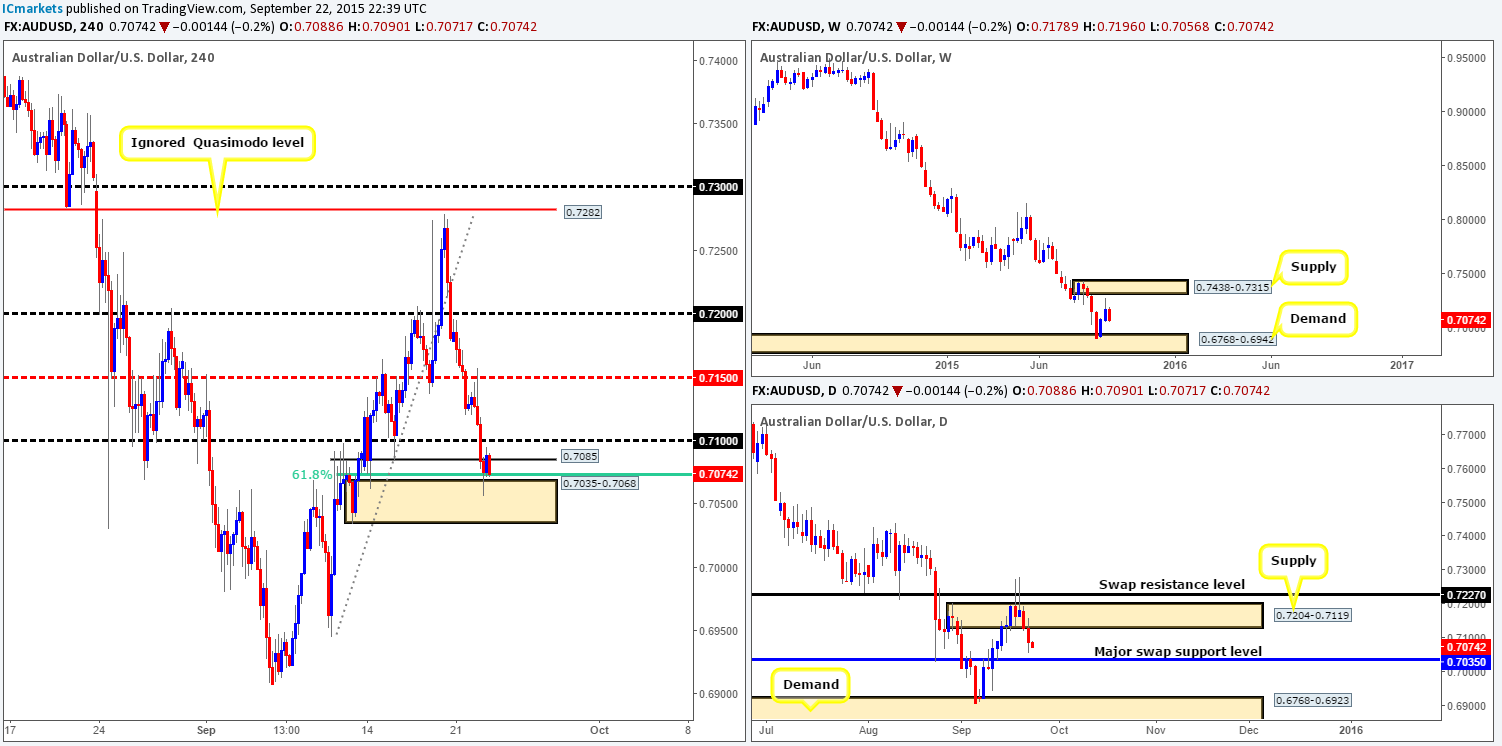
Following Monday’s plunge below the mid-level number 0.7150, price retested this barrier beautifully as resistance going into the London open yesterday. From here, price heavily sold off taking out both 0.7100/0.7085, and slam dunked itself into the jaws of demand coming in at 0.7035-0.7068. We do hope some of our readers locked in some green pips from the retest of 0.7150 yesterday as this was a noted level in our previous report: http://www.icmarkets.com/blog/tuesday-22nd-september-daily-technical-outlook-and-review/.
Now, as far as the weekly chart’s position is concerned, we see little in the way of support stopping this market continuing to fall until reaching demand at 0.6768-0.6942. Regarding the daily chart, on the other hand, price is now within shouting distance of connecting with a major swap support hurdle visible at 0.7035. However, even with this daily support providing additional backing to the current 4hr demand area mentioned above in bold, and also a converging 61.8% Fib level, we still cannot justify buying this market at current prices. Not only is there a minor swap resistance level sitting a few pips above here at 0.7085(which price seems to be rebounding from as we write), followed closely by 0.7100, let’s also not forget that the weekly chart indicates further selling is possible (see above)!
As such, remaining flat until more conducive price action presents itself is, in our book at least, the best way to go today.
Levels to watch/ live orders:
- Buys: Flat (Stop loss: N/A).
- Sells:Flat (Stop loss: N/A).
USD/JPY:
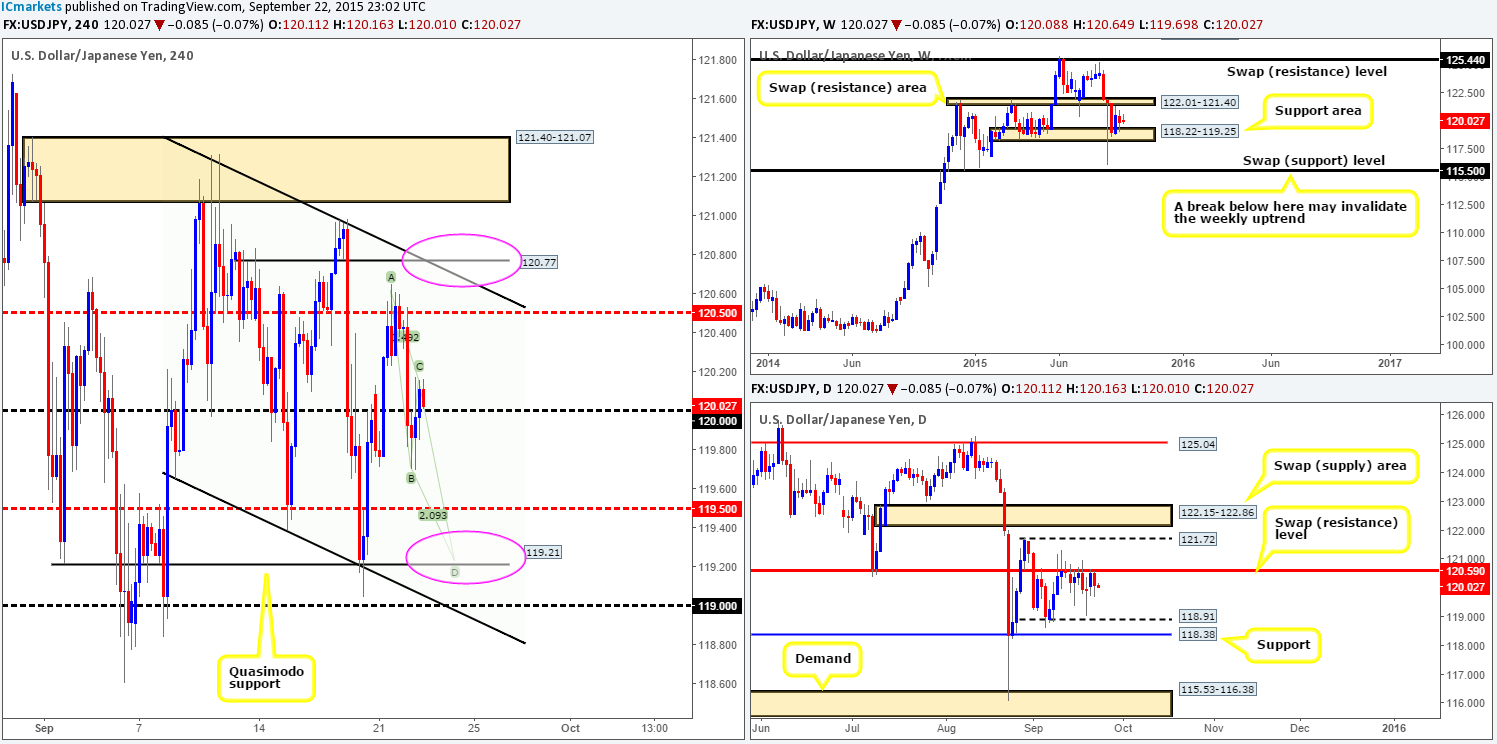
As far as we see it, the USD/JPY pair is caught within a 4hr descending channel (119.65/121.31) at the moment, and to be honest, trading anywhere other than the extremes of this area is considered to be mid-range for us. With that being said, we currently see two possible scenarios in this market:
- The first is a simple AB=CD pattern into a Quasimodo support barrier coming in at 119.21. For this to complete though, bids at both 120.00/119.50 will need to be consumed. We’d recommend only entering at 119.21 if one spots lower timeframe buying confirmation, since price could just as easily fakeout to 119.00 lurking just below it.
- The second level we have our eye on is 120.77. This not only lines up nicely with the 4hr channel resistance, but also floats just above a daily swap (resistance) barrier at 120.59, which has been holding this market lower now for around two weeks! Whether we enter at 120.77 or not will, at least for us, depend on if the lower timeframes show bearish strength at this region.
Levels to watch/ live orders:
- Buys: 119.21 [Tentative – confirmation required] (Stop loss: dependent on where one confirms this level).
- Sells:120.77 [Tentative – confirmation required] (Stop loss: dependent on where one confirms this level).
USD/CAD:
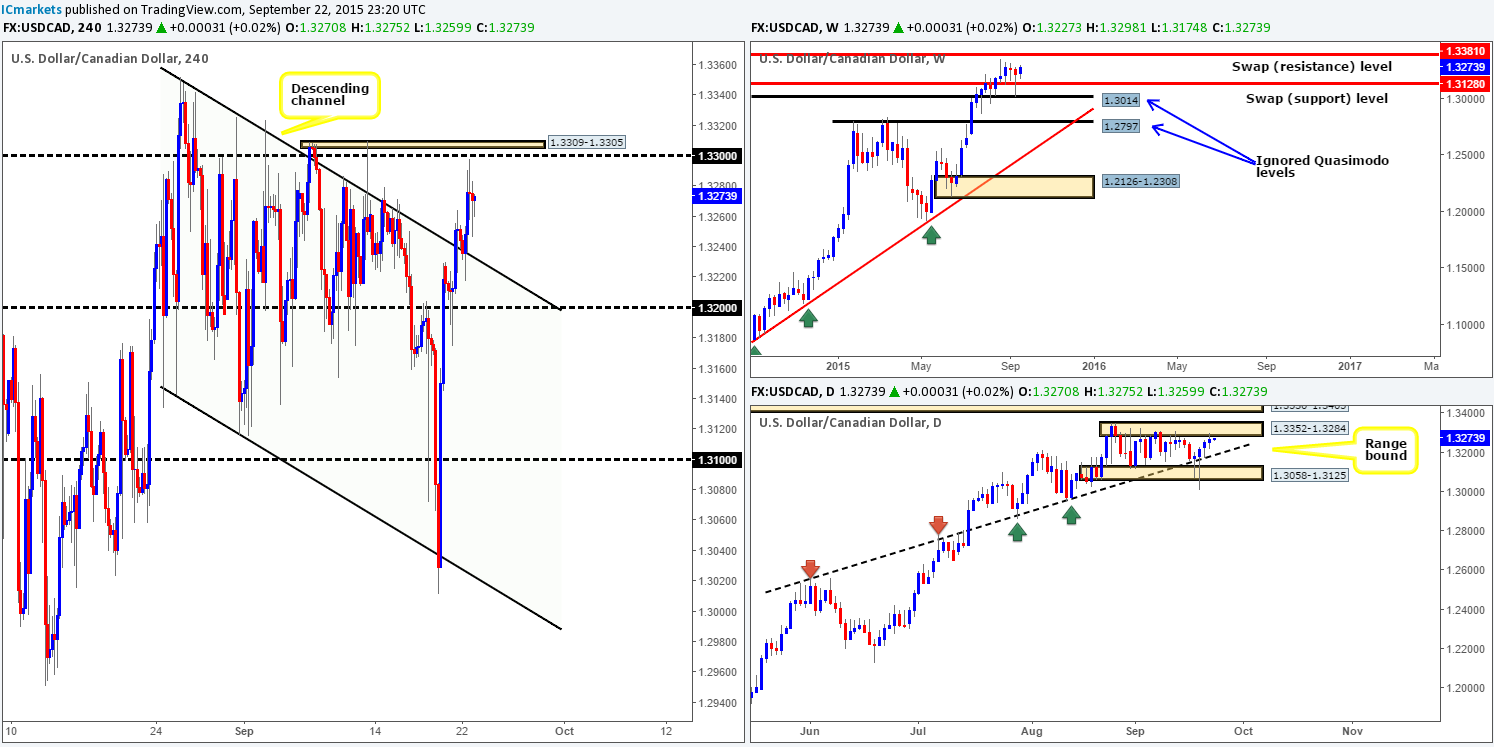
Cast your minds back to yesterday’s report for the moment: http://www.icmarkets.com/blog/tuesday-22nd-september-daily-technical-outlook-and-review/ where our team mentioned to watch for potential buys on the retest of a recently broken channel resistance (1.3352). Furthermore, we also said that we believed price would, if supportive pressure came into the market here, rally up to 1.3300. As can be seen from the 4hr chart, this played out to perfection. We do hope some of our readers took advantage of this move!
Going forward, recent developments has forced price to kiss the underside of daily supply coming in at 1.3352-1.3284. Granted, this pair could once again sell-off from here, but with room on the weekly chart seen for price to rally up 1.3381 – a swap resistance level; this daily barrier could potentially see a fakeout.
So, where does the above leave us on the 4hr timeframe today? To be honest, as far as we can see, there’s not really much setting up in this market for the time being. Of course, one could keep an eye on 1.3300 for confirmed sells and also the channel resistance-turned support for potential buys, but other than this, we see very little actionable trading opportunities for now.
Levels to watch/ live orders:
- Buys:Watch for any lower timeframe confirmed entries off the back of the 4hr upper channel resistance taken from the high 1.3352 (confirmation required).
- Sells: 1.3300 [Tentative – confirmation required] (Stop loss: dependent on where one confirms this level).
USD/CHF:
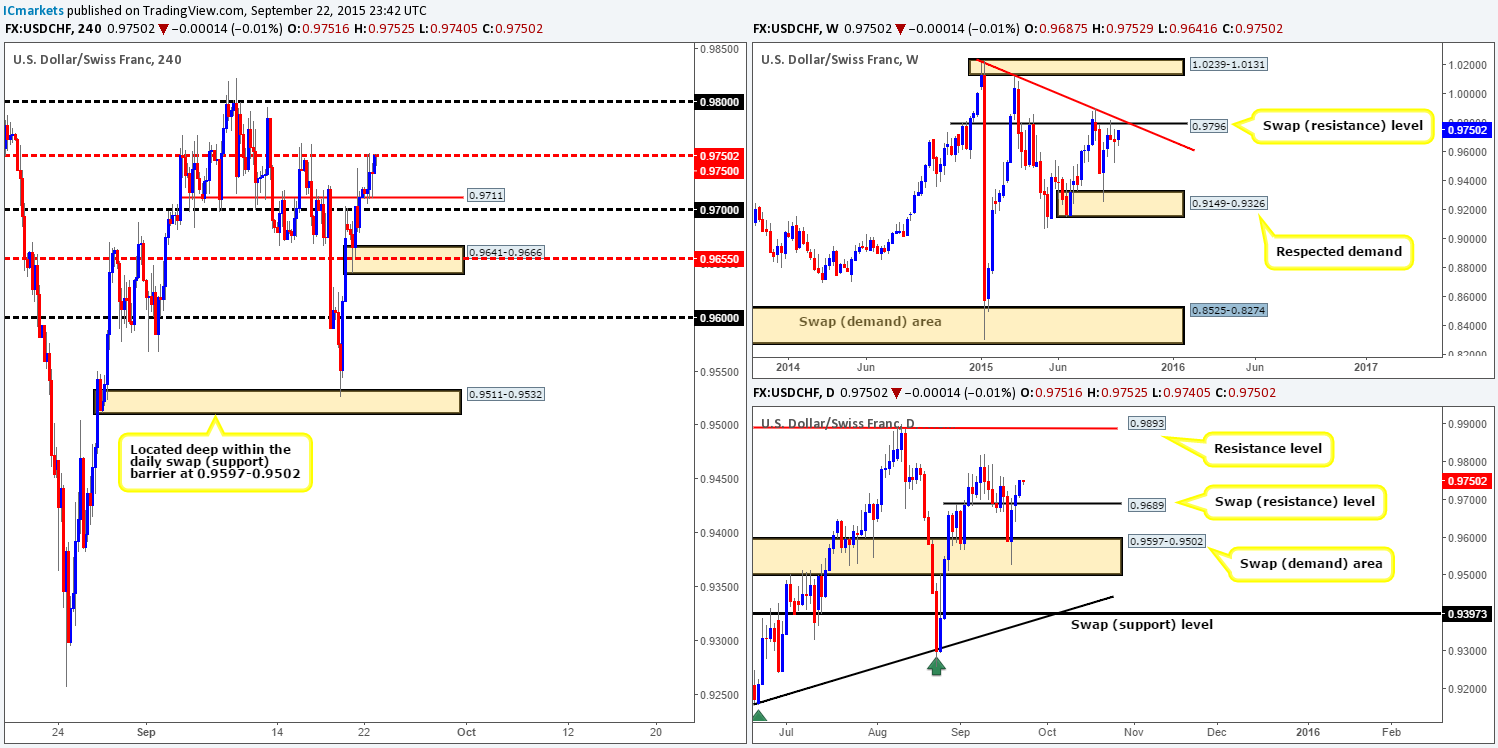
The USD/CHF pair, as you can see, was a tedious market to watch yesterday. Granted the swap support level at 0.9711 did hold firm, which, if you remember from our previous report (http://www.icmarkets.com/blog/tuesday-22nd-september-daily-technical-outlook-and-review/) was somewhere we were looking to enter long from. Lower timeframe price action around this barrier, however, was unfortunately not clear enough to condone a long position from here.
At the time of writing, price is trading directly below the mid-level barrier 0.9750, and is showing very little selling interest at present. Should this number get taken out, this could set the stage for a continuation move north up to 0.9800.
Given that we do not expect to see resistance on the daily timeframe until around the swing high 0.9822, and also on the weekly timeframe until around 0.9796 (swap resistance level), we see 0.9750 giving way today. In consequence, a small close above and retest of this number will, in effect, be our cue to begin looking for a lower timeframe buy entry into this market. Ideally, we’d like the stop to be as small as possible here since we want the risk/reward to be at least 2:0. 0.9800 will be our only take-profit area for this trade seeing as this number lines up closely to the weekly swap (resistance) barrier mentioned above at 0.9796.
Levels to watch/ live orders:
- Buys:Watch for offers at 0.9750 to be consumed and then look to enter on any retest seen at this number (confirmation required).
- Sells: Flat (Stop loss: N/A).
DOW 30:
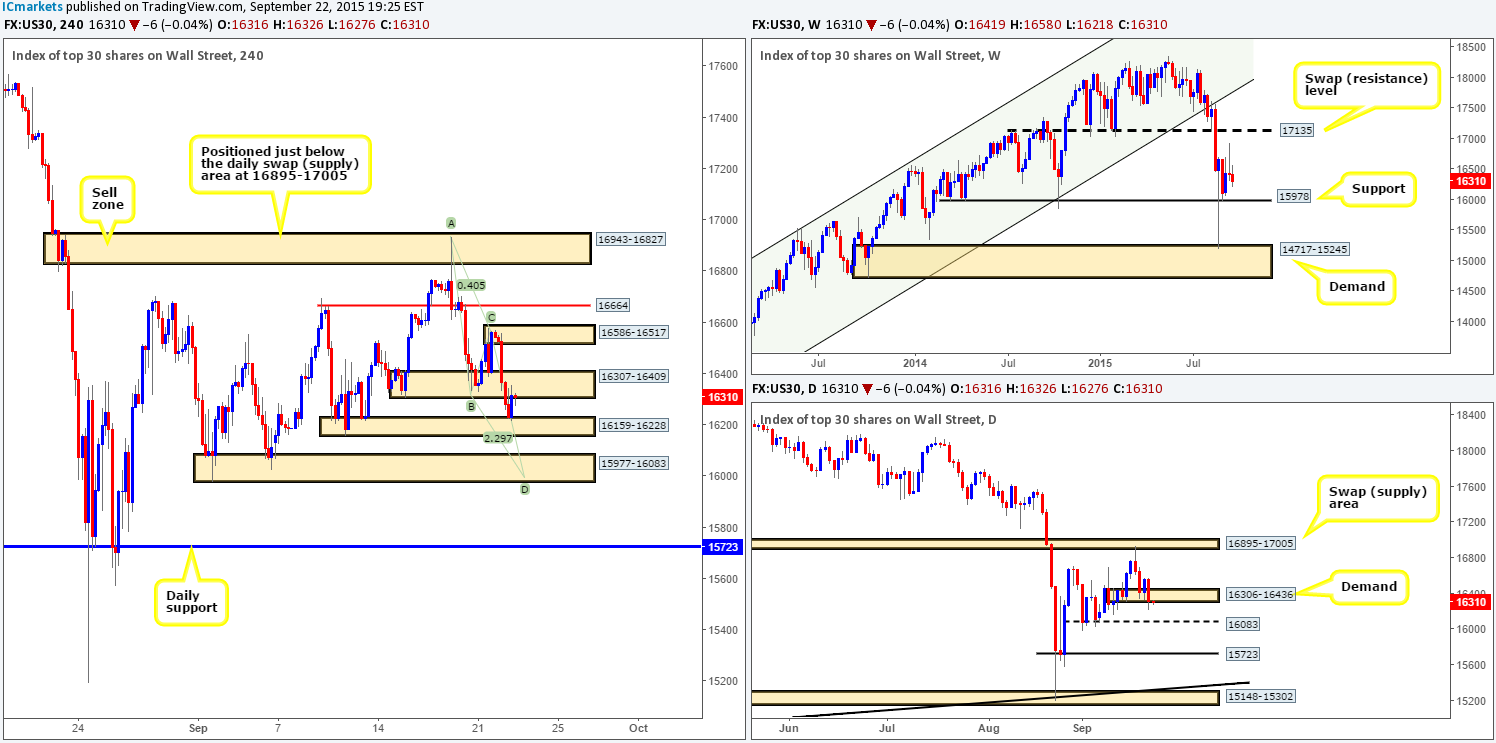
Throughout the course of yesterday’s sessions the DOW index fell sharply, taking out demand at 16307-16409 and jabbing itself into demand just below it at 16159-16228. It was from this point – the U.S. afternoon session, did we see the market begin to correct itself. This recent bearish descent, however, also saw daily action engulf demand drawn from 16306-16436. This, in itself, could pave the way south towards daily support coming in at 16083.
With that being said, the correction from current demand at 16159-16228could be a short-lived one. Not only have we got direction from the daily timeframe indicating further downside is possible, but there is likely going to be unfilled sell orders sitting within the recently broken 4hr demand (now supply) at 16307-16409.
Therefore, in the event that 16307-16409 holds firm today and pushes this market further south, we may see price shake hands with a 4hr demand area given at 15977-16083. Ultimately, we have no interest in selling from current prices, what we do have our beady little eye on though is the 4hr demand in bold above for a buy trade due to the following:
- AB=CD bullish pattern completion point at 16000.
- Top-side of the 4hr demand is formed from daily support at 16083.
- Lower limit of the 4hr demand area comes from weekly support at 15978.
Considering the convergence of all three timeframes here, we’re quite happy to place a pending buy order within this zone at 16024and a stop just below it at 15891. As this area shows higher timeframe confluence, we have no pre-determined target per-se,rather, we’re going to look to trail price as/if it moves in our favor behind distinct lower timeframe supports.
Levels to watch/ live orders:
- Buys: 16024 (Stop loss: 15891).
- Sells:Flat (Stop loss: N/A).
XAU/USD: (Gold)
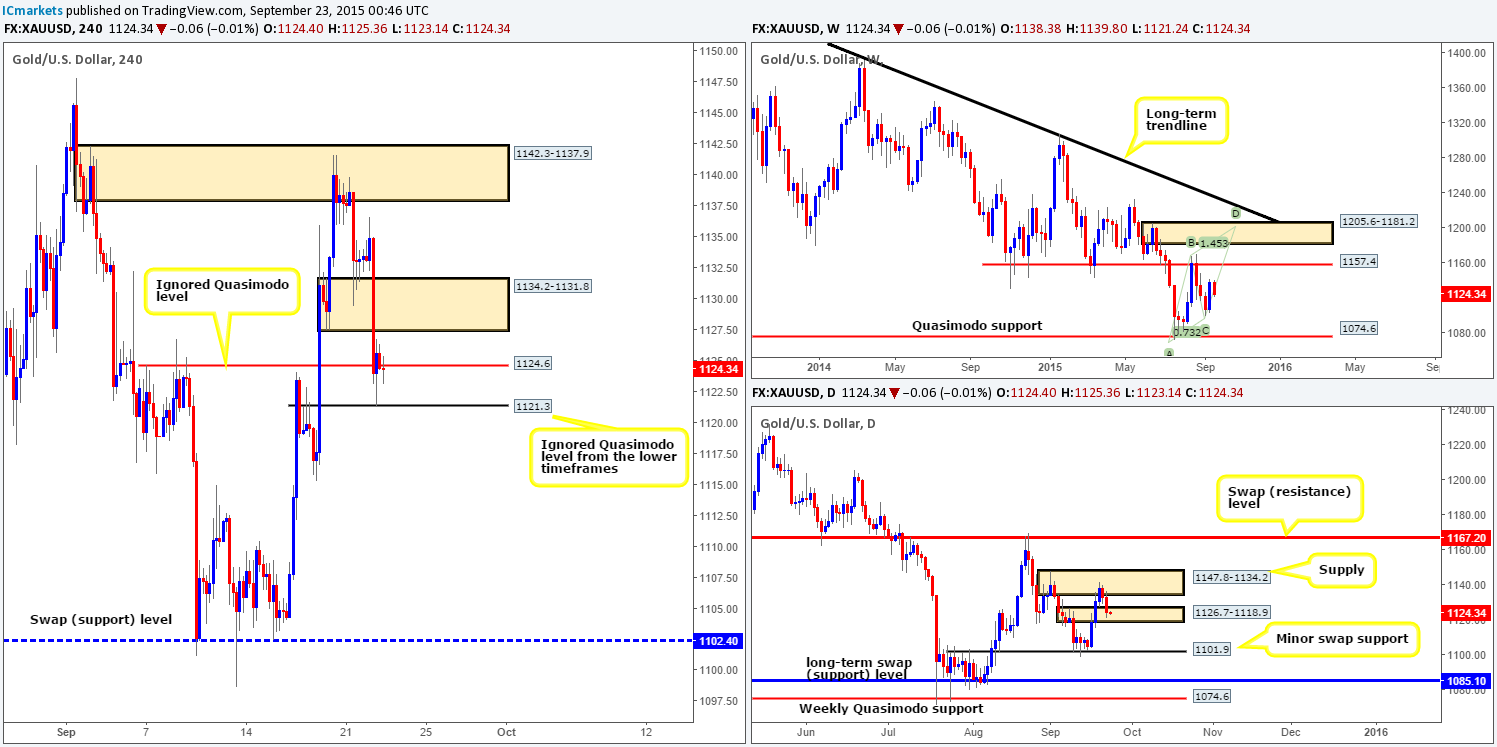
As can be seen from the 4hr chart below, demand at 1134.2-1131.8did hold price steady for a while, but as expected it eventually gave way. However, we were looking to see more of a defined reaction from the ignored Quasimodo level at 1124.6 just below it. Instead, price seems to have ignored this barrier and headed for a lower timeframe ignored Quasimodo level at 1121.3. This is why we emphasize so much on waiting for lower timeframe strength to show itself before risking capital. Yes, you may miss some trades along the way, but you’ll also avoid a ton of losses too just like this one here at 1124.6.
We have clearly missed the first boat at 1121.3. We’re not too concerned by this though as price may retest this boundary today, which could, depending on how the lower timeframes react, give us a second opportunity to enter long. The reason for our confidence in this level is, for one, it is proven support, and two, it sits deep within a daily swap (demand) area at 1126.7-1118.9. Furthermore, check out the 15 minute timeframe at the moment, see how price is grinding south right now, this is, as far as we see, pro money consuming unfilled sell orders as price drops to eventually rally higher. If this motion continues back down to 1121.3, we would have no hesitation in entering long here at market!
Levels to watch/ live orders:
- Buys: 1121.3 [Tentative – confirmation required] (Stop loss: dependent on where one confirms this level).
- Sells: Flat (Stop loss: N/A).


