A note on lower timeframe confirming price action…
Waiting for lower timeframe confirmation is our main tool to confirm strength within higher timeframe zones, and has really been the key to our trading success. It takes a little time to understand the subtle nuances, however, as each trade is never the same, but once you master the rhythm so to speak, you will be saved from countless unnecessary losing trades. The following is a list of what we look for:
- A break/retest of supply or demand dependent on which way you’re trading.
- A trendline break/retest.
- Buying/selling tails/wicks – essentially we look for a cluster of very obvious spikes off of lower timeframe support and resistance levels within the higher timeframe zone.
- Candlestick patterns. We tend to stick with pin bars and engulfing bars as these have proven to be the most effective.
We search for lower timeframe confirmation between the M15 and H1 timeframes, since most of our higher-timeframe areas begin with the H4. Stops are usually placed 5-10 pips beyond confirming structures.
EUR/USD:
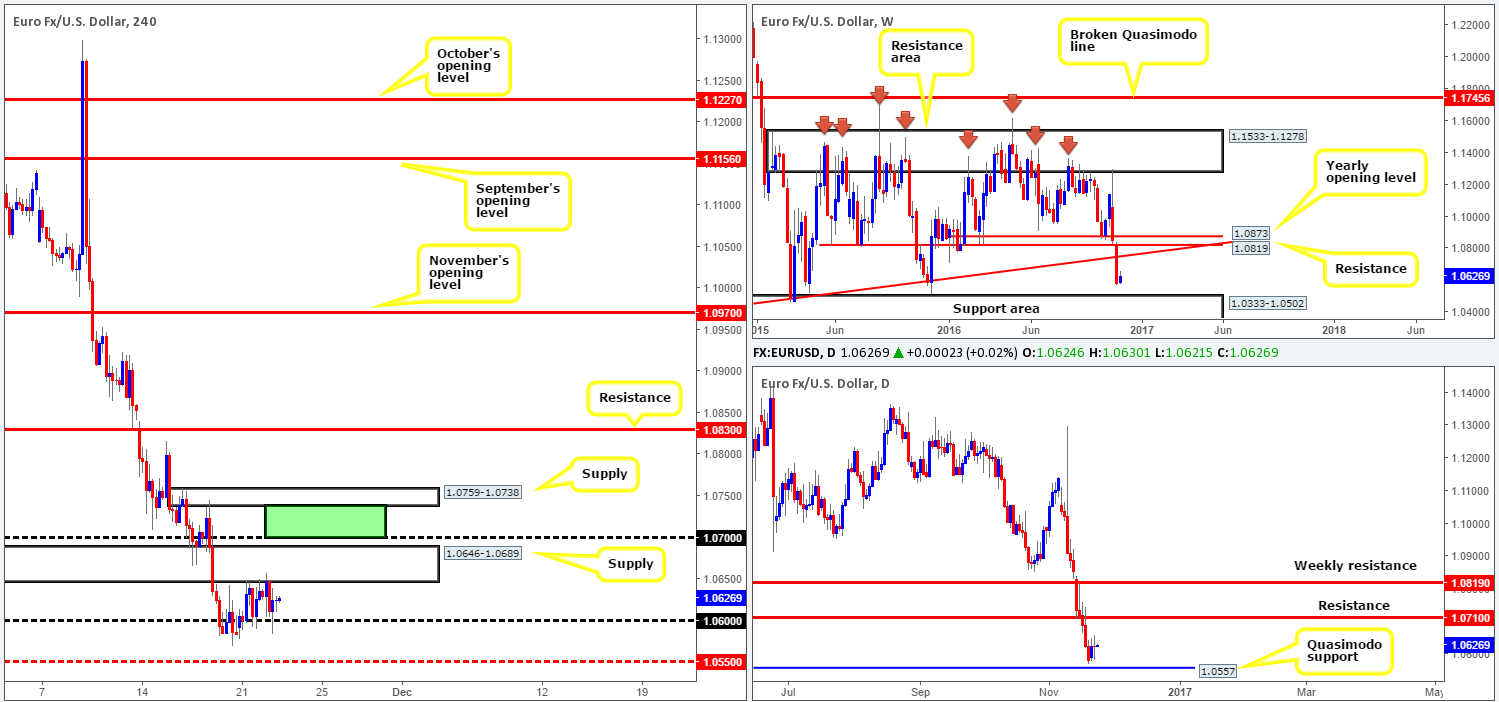
EUR/USD prices, as you can see, are little changed this morning. The pair spent yesterday consolidating between H4 supply coming in at 1.0646-1.0689 and the 1.06 handle, consequently forming a clear-cut daily indecision candle. As was noted in Tuesday’s report, this week’s move north is, at this time, considered correctional by our desk. However, we cannot rule out the possibility of a continuation move higher towards daily resistance at 1.0710, which happens to be located just below the weekly trendline resistance extended from the low 0.8231.
Our suggestions: Given the rather lackluster movement seen yesterday, our outlook remains the same as put forward in Tuesday’s report. Although the higher-timeframe structures show room for the pair to extend higher, buying this market is challenging given that the current H4 supply is also lodged below the 1.07 handle which, by extension, is positioned 10 pips below the daily resistance mentioned above, giving us not a lot of room to play with!
Selling from the 1.07 neighborhood on the other hand, is a reasonable possibility. Nevertheless, for those who agree with our analysis, you’d also need to be prepared for the possibility of a fakeout above 1.07 up to the underside of a H4 supply at 1.0759-1.0738 (the green zone represents a fakeout zone), as housed within this fakeout zone is the aforementioned daily resistance.
Data points to consider: EUR Flash manufacturing PMI at 9am. US Core durable goods data at 1.30pm, US Jobless claims also at 1.30pm, FOMC meeting minutes at 7pm GMT.
Levels to watch/live orders:
- Buys: Flat (stop loss: N/A).
- Sells: 1.07/1.0738 region ([lower timeframe confirmation required before entry is permitted – please see the top of this report for ideas on how to utilize lower timeframe entries] stop loss: dependent on where one confirms this area).
GBP/USD:
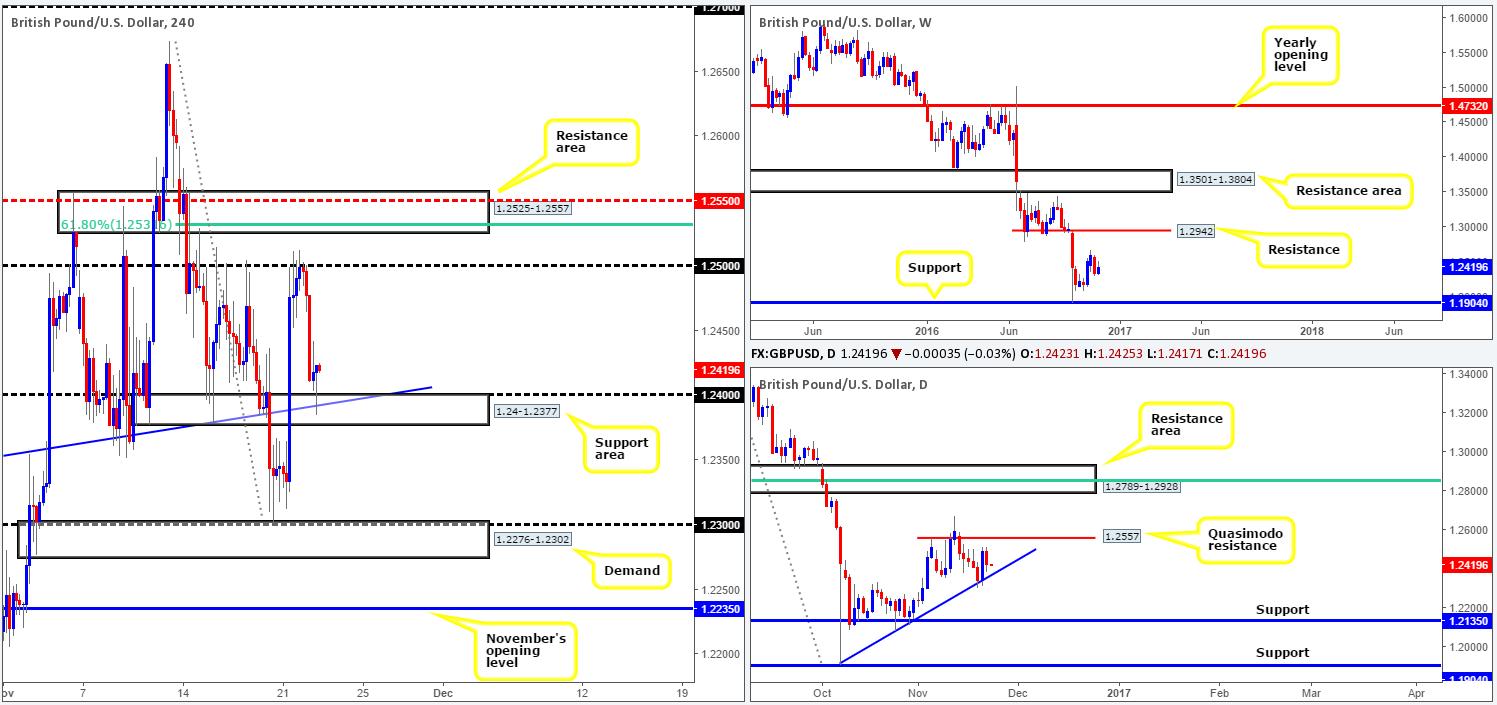
As London sellers entered the fray yesterday, sterling took a nose dive from the underside of the 1.25 handle. This, as you can see, saw the H4 candles probe a support area at 1.24-1.2377 that displays confluence from the 1.24 hurdle, and a H4 trendline support carved from the high 1.2329. The day concluded with price chalking up a strong-looking H4 buying tail, which may, given the strength of its supporting zone, see prices rally today. In addition to the above H4 structures, daily action also reveals further confluence in the form of a daily trendline support extended from the low 1.1904 that is seen intersecting beautifully with the lower edge of the current H4 support area.
Our suggestions: From a technical standpoint, there’s a strong chance of a rally being seen from the current H4 support area today, possibly back up to the 1.25 handle. The only grumble our desk has noted is the fact that we have little weekly confluence supporting this trade. In fact, from the weekly chart, one can see just how strong the bears have been since June 2014!
Despite this, the H4 buying tail indicates that there are willing buyers around the H4 support area, and therefore, we have taken a long position at 1.2423 and placed our stop at 1.2382: beneath the tail of the H4 candle. The first take-profit target is set around 1.25, followed closely by the H4 supply above it at 1.2525-1.2557, which, as we explained in yesterday’s report, is also a nice-looking zone to sell from due to its converging H4 structures.
Data points to consider: MPC member Forbes speaks at 11.30am, UK Autumn forecast statement at 12.30pm. US Core durable goods data at 1.30pm, US Jobless claims also at 1.30pm, FOMC meeting minutes at 7pm GMT.
Levels to watch/live orders:
- Buys: 1.2423 ([live] stop loss: 1.2382).
- Sells: Flat (stop loss: N/A).
AUD/USD:
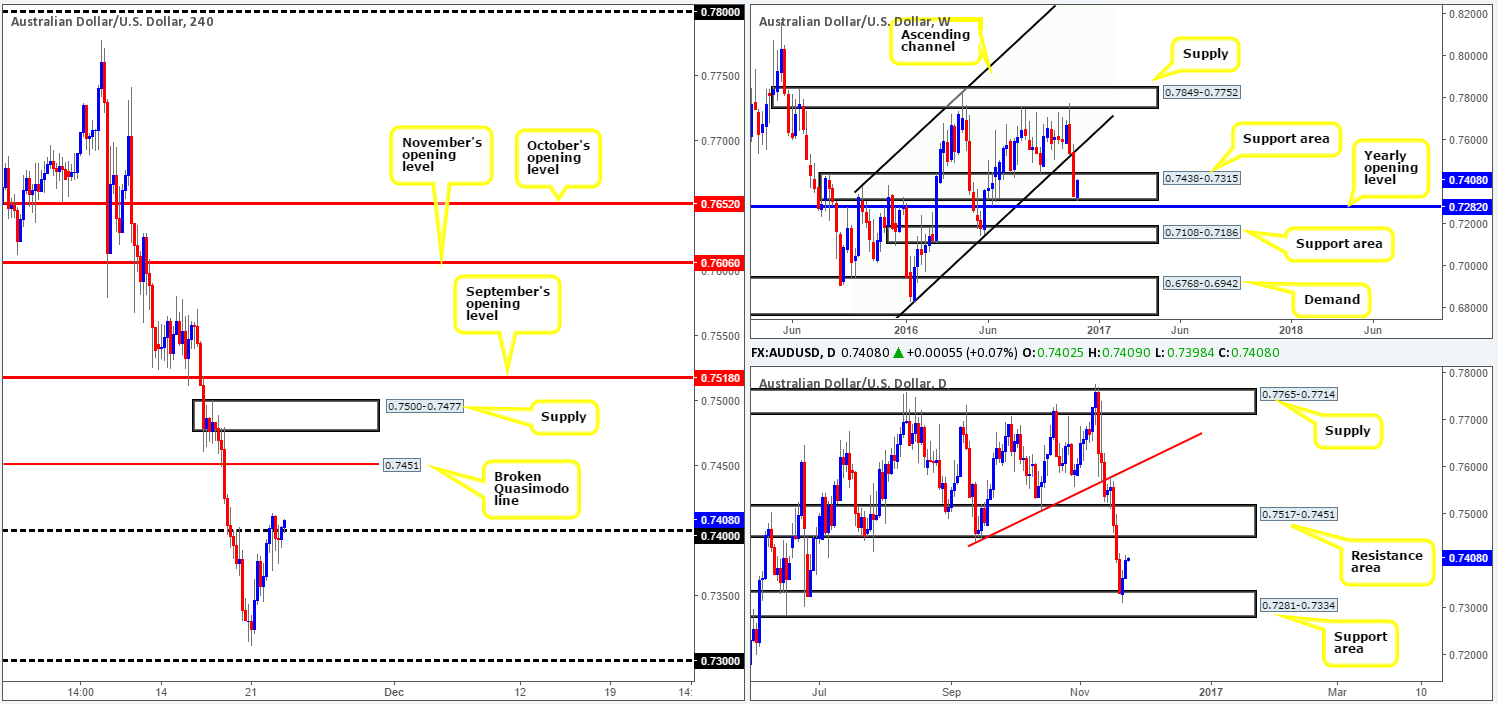
The Aussie dollar struck highs of 0.7413 on Tuesday, following an extension of Monday’s rebound off the daily support area drawn from 0.7281-0.7334. Technically speaking, we believe that the 0.74 handle looks vulnerable at the moment. Stop losses were likely triggered during yesterday’s session, and has therefore potentially cleared the trail north up to 0.7451: a H4 broken Quasimodo line.
Now, seeing as the current H4 candle has already retested 0.74, we feel, if the candle closes reasonably bullish that is, that a long is possible up to 0.7451. In support of this, not only is there upside potential seen on the daily chart to 0.7517-0.7451 area (a resistance zone that stretches as far back as July 2015), but let’s also not forget that the weekly candle is currently trading from a support area at 0.7438-0.7315 as well.
Our suggestions: On the assumption that the current H4 candle closes reasonably bullish, one may want to consider longs, targeting 0.7451 (the aforementioned H4 broken Quasimodo line that also represents the underside of the daily resistance area) as your immediate take-profit target.
Data points to consider: US Core durable goods data at 1.30pm, US Jobless claims also at 1.30pm, FOMC meeting minutes at 7pm GMT.
Levels to watch/live orders:
- Buys: Watching for a H4 bullish close to form off 0.74 (stop loss: ideally beyond the trigger candle).
- Sells: Flat (stop loss: N/A).
USD/JPY:
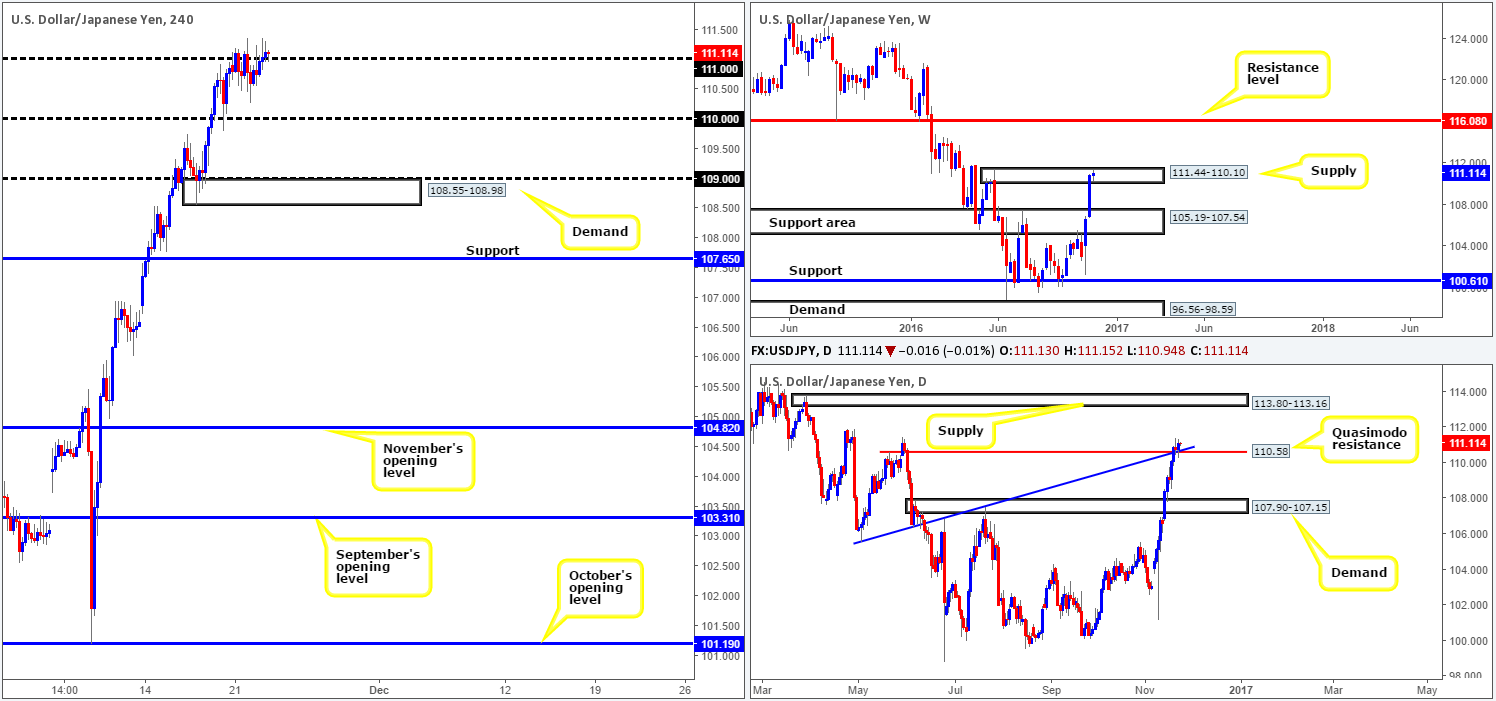
Kicking this morning’s analysis off with a look at the weekly timeframe show offers appear to be on the verge of drying up within the current supply zone seen at 111.44-110.10. Further corroborating this thinking, we can see that daily price recently closed above a Quasimodo resistance at 110.58/trendline resistance (105.54), and shortly after retested the boundary as support! Assuming that the bulls defend this line as support, the couple may head towards supply carved from 113.80-113.16.
Stepping across to the H4 chart, the bulls ended the day marginally closing above the 111 handle. In the event that the bulls maintain a bullish defense above here, we feel, given there’s little fresh supply to the left of current prices, the unit could rally to the 112 handle.
Our suggestions: On the condition that the H4 bulls print a reasonably sized H4 bull candle off of 111 today, this could be considered a bullish signal to trade long. Granted, weekly action still resides within supply, but given the daily price action (see above), we feel the weekly supply is ‘on its last legs’, so to speak. The first take-profit target from 111 would be 112, possibly followed by the 113 barrier considering this is planted just below the aforementioned daily supply.
Data points to consider: Japanese banks will be closed today in observance of Labor Thanksgiving Day. US Core durable goods data at 1.30pm, US Jobless claims also at 1.30pm, FOMC meeting minutes at 7pm GMT.
Levels to watch/live orders:
- Buys: Watch for a H4 bullish close off the 111 handle before considering an entry long (stop loss: ideally beyond the trigger candle).
- Sells: Flat (stop loss: N/A).
USD/CAD:
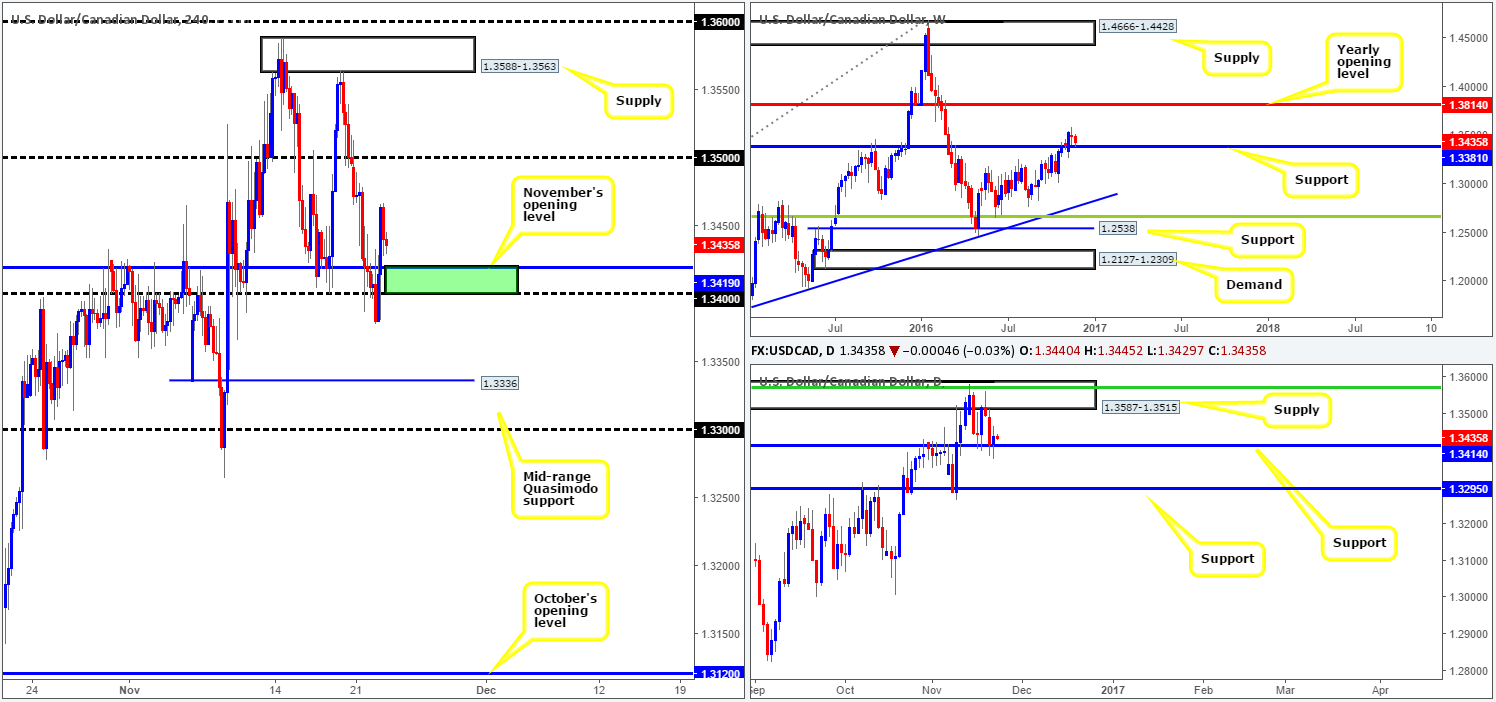
Going into the early hours of yesterday’s London segment, the bears flooded the market with offers and broke below the 1.34 band. Traders who shorted this move likely got stung here since all this turned out to be was a fakeout! However, as we pointed out in our previous report, entering short beyond 1.34 was a risky play due to the nearby weekly support at 1.3381, which, as you can see, is exactly where price caught its next bid. In view of the rally from this weekly hurdle, daily price also managed to close in the green above support coming in at 1.3414, suggesting that further upside towards supply seen at 1.3587-1.3515 might be at hand.
Our suggestions: Should the H4 candles pullback and retest the area in green formed by the 1.34 handle and November’s opening level at 1.3419, our desk would consider entering long from here, should we spot a reasonably sized H4 bull candle. Ultimately, we’d be looking up to 1.35 as a first take-profit target (positioned just below the underside of the daily supply). Nevertheless, closing out your full position here may not be the best path to take, since there is potential, according to the weekly chart, for further upside all the way up to 1.3814: the yearly opening level!
Data points to consider: US Core durable goods data at 1.30pm, US Jobless claims also at 1.30pm, FOMC meeting minutes at 7pm GMT.
Levels to watch/live orders:
- Buys: 1.34/1.3419 ([reasonably sized H4 bullish close required prior to pulling the trigger] stop loss: ideally beyond the trigger candle).
- Sells: Flat (stop loss: N/A).
USD/CHF:
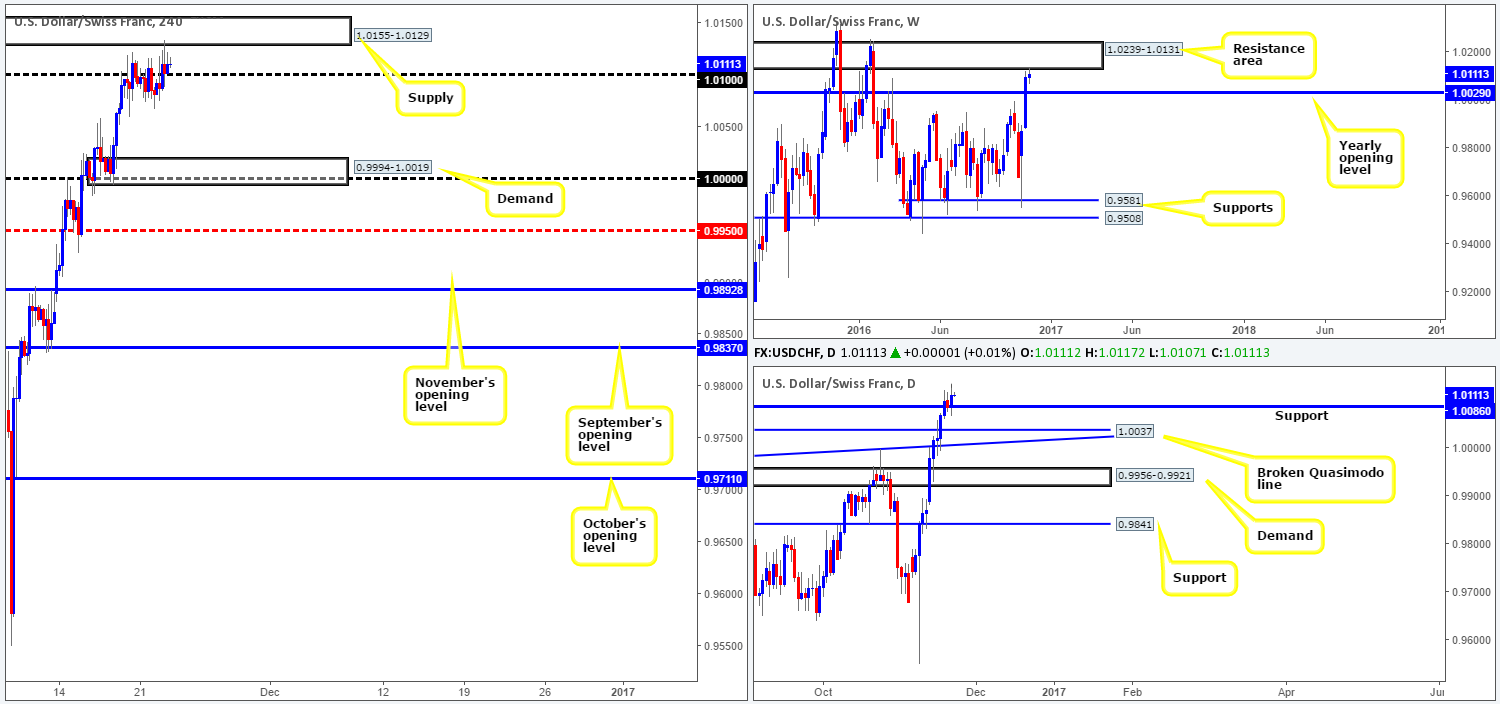
In recent sessions, H4 action broke above the 1.01 handle and probed the supply zone registered at 1.0155-1.0129. Looking over to the weekly structure, one can clearly see that this H4 barrier is also bolstered by a weekly resistance area drawn from 1.0239-1.0131. In view of this, one may contemplate selling this market. While this is certainly a reasonable assumption, there are two important points to consider. The first is, of course, H4 price remains above the 1.01 handle despite finding a pocket of offers around the aforementioned H4 supply. Secondly, there’s the question of the current daily support in play at 1.0086.
As far as H4 structure goes, a close below 1.01 would likely shift the pendulum toward a downside move, since there’s little active demand beyond here until we reach the daily broken Quasimodo line at 1.0037, followed closely by the yearly opening level at 1.0029 and then 0.9994-1.0019: a H4 demand area which houses the key figure 1.0000 (parity). What would be ideal, however, is a decisive H4 close below both the 1.01 handle along with the daily support which sits 14 pips below 1.01, followed up with a retest of this area as resistance.
Our suggestions: Before considering shorts in this market, we’d recommend waiting for a H4 close below the daily support at 1.0086. This would likely confirm downside strength from the weekly resistance area, and free the path south to at least the aforementioned daily broken Quasimodo line. Our desk has noted that they have absolutely no interest in selling the breakout here, but would consider selling on a retest of the broken area, provided a H4 bearish close is seen.
Data points to consider: US Core durable goods data at 1.30pm, US Jobless claims also at 1.30pm, FOMC meeting minutes at 7pm GMT.
Levels to watch/live orders:
- Buys: Flat (stop loss: N/A).
- Sells: Watch for a H4 close to form beyond the daily support at 1.0086 and then look to short this area on any retest seen thereafter ([reasonably sized H4 bearish close required prior to pulling the trigger] stop loss: ideally beyond the trigger candle).
DOW 30:
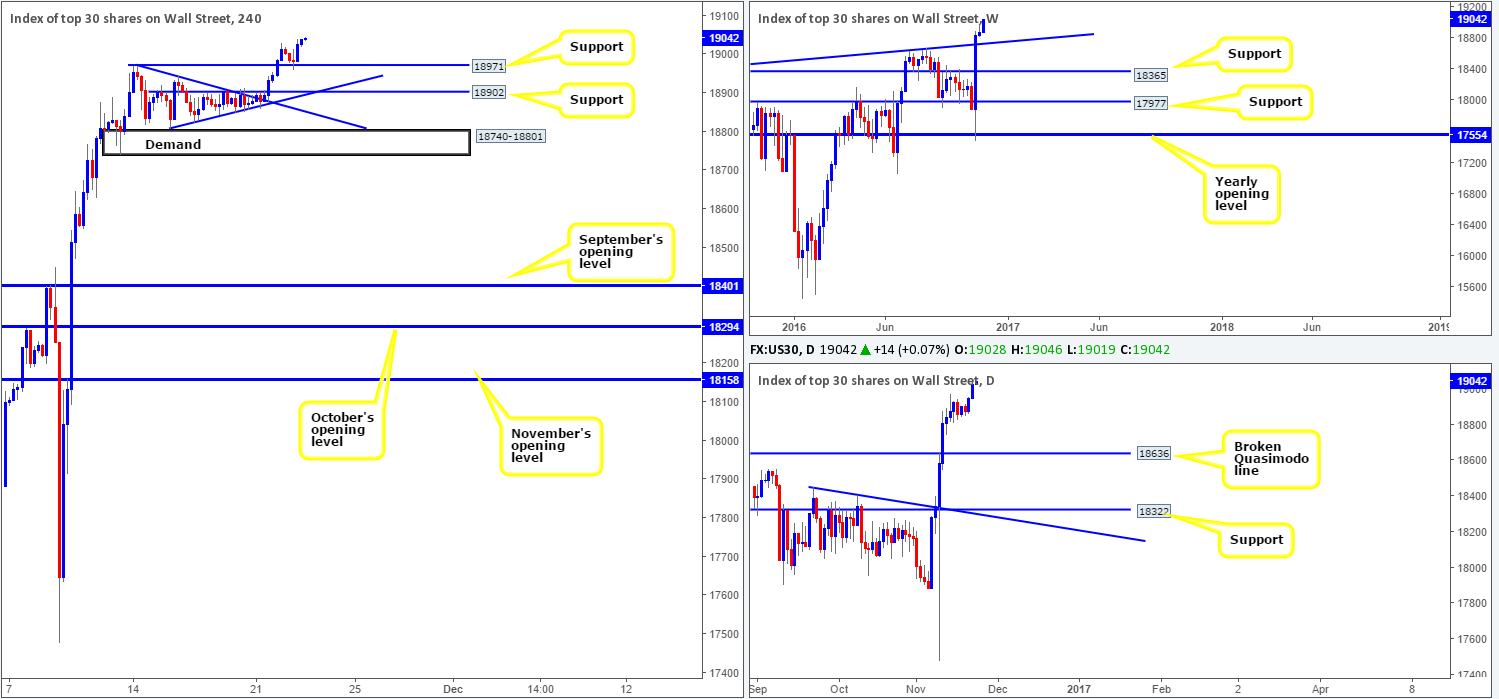
US equities extended all-time highs yesterday, following a brief pullback to the 18971 region going into the US session. Stocks are clearly no longer stuck in that frustrating ranging formation it was last week, and the market seems a lot surer of itself now. The response from the H4 support 18971 was relatively sound, and could, if retested for a second time today, hold just as firm we feel.
Our suggestions: Given that there’s absolutely no higher-timeframe resistance seen on the horizon, the 18971 H4 support, and the level seen directly below it (also another support) at 18902, are levels of note to watch today for possible long opportunities on any dip seen.
Data points to consider: US Core durable goods data at 1.30pm, US Jobless claims also at 1.30pm, FOMC meeting minutes at 7pm GMT.
Levels to watch/live orders:
- Buys: 18971 ([reasonably sized H4 bullish close required prior to pulling the trigger] stop loss: ideally beyond the trigger candle). 18902 ([reasonably sized H4 bullish close required prior to pulling the trigger] stop loss: ideally beyond the trigger candle).
- Sells: Flat (stop loss: N/A).
GOLD:
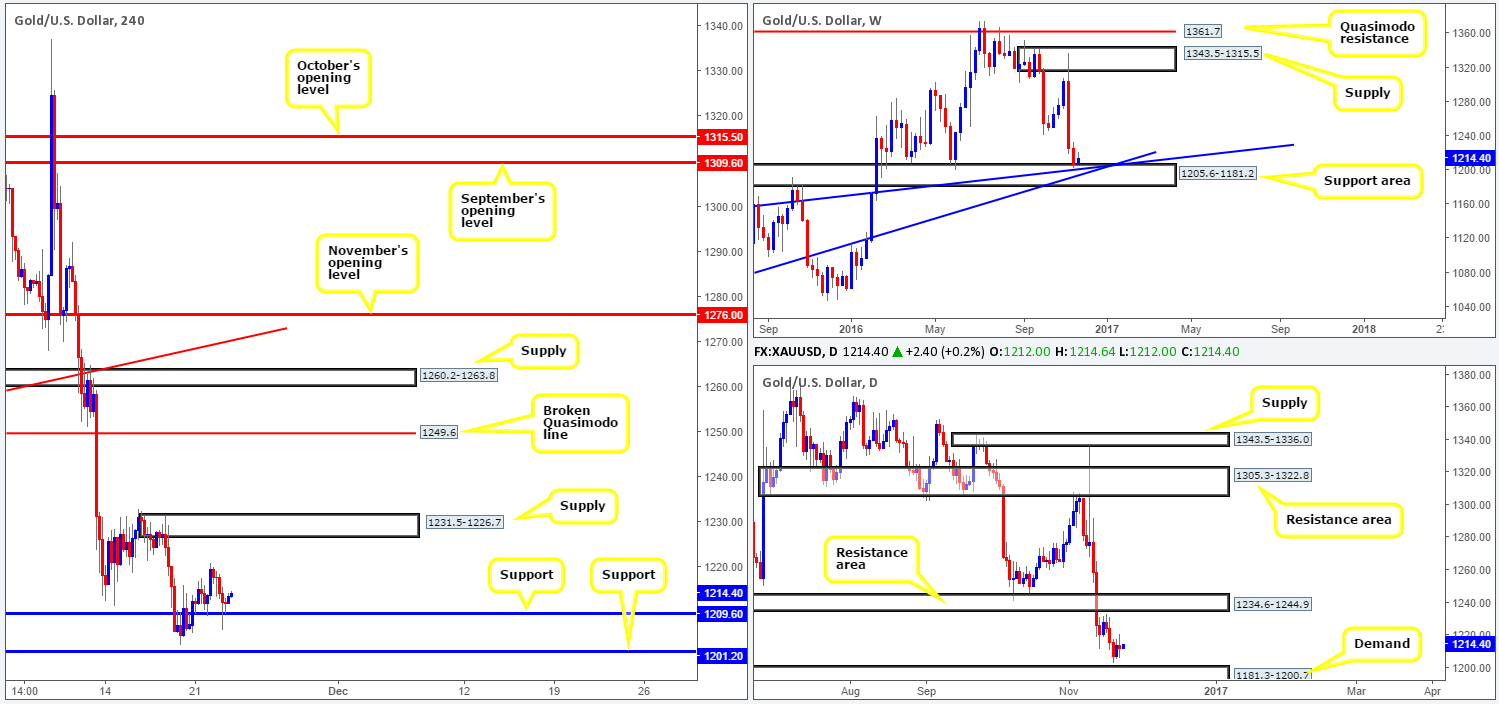
Although the yellow metal lost significant ground over the past two weeks, the current weekly candle remains buoyed by a major weekly support area coming in at 1205.6-1181.2 that converges with two trendline supports 1130.1/1071.2. Despite this, the unit has only managed to increase by a less-than-impressive $11, and to top it off, daily action chalked up an indecision candle yesterday, suggesting uncertainty.
Initially, we mentioned to watch for the H4 candles to retest the support at 1209.6 for a second time, which, as you can see, recently took place. While we believe gold is now ready to be bought from this area, we’re a little concerned by yesterday’s advance seen in the equity market, which could lead to a depreciation in gold as investors look to take advantage of these gains.
Our suggestions: While fundamentally, gold is considered relatively weak now, the technicals do favor an increase in value up to at least the H4 supply coming in at 1231.5-1226.7 (located directly below a daily resistance area at 1234.6-1244.9: the next upside target on the daily timeframe). As our desk already has a live position on the GBP/USD (see above) we will pass here.
Levels to watch/live orders:
- Buys: 1209.6 ([ready to be bought in our opinion] stop loss: 1208.6).
- Sells: Flat (stop loss: N/A).


