A note on lower timeframe confirming price action…
Waiting for lower timeframe confirmation is our main tool to confirm strength within higher timeframe zones, and has really been the key to our trading success. It takes a little time to understand the subtle nuances, however, as each trade is never the same, but once you master the rhythm so to speak, you will be saved from countless unnecessary losing trades. The following is a list of what we look for:
- A break/retest of supply or demand dependent on which way you’re trading.
- A trendline break/retest.
- Buying/selling tails/wicks – essentially we look for a cluster of very obvious spikes off of lower timeframe support and resistance levels within the higher timeframe zone.
- Candlestick patterns. We tend to only stick with pin bars and engulfing bars as these have proven to be the most effective.
We search for lower timeframe confirmation between the M15 the H1 timeframes, since most of our higher-timeframe areas begin with the H4. Stops are usually placed 5-10 pips beyond confirming structures.
EUR/USD:
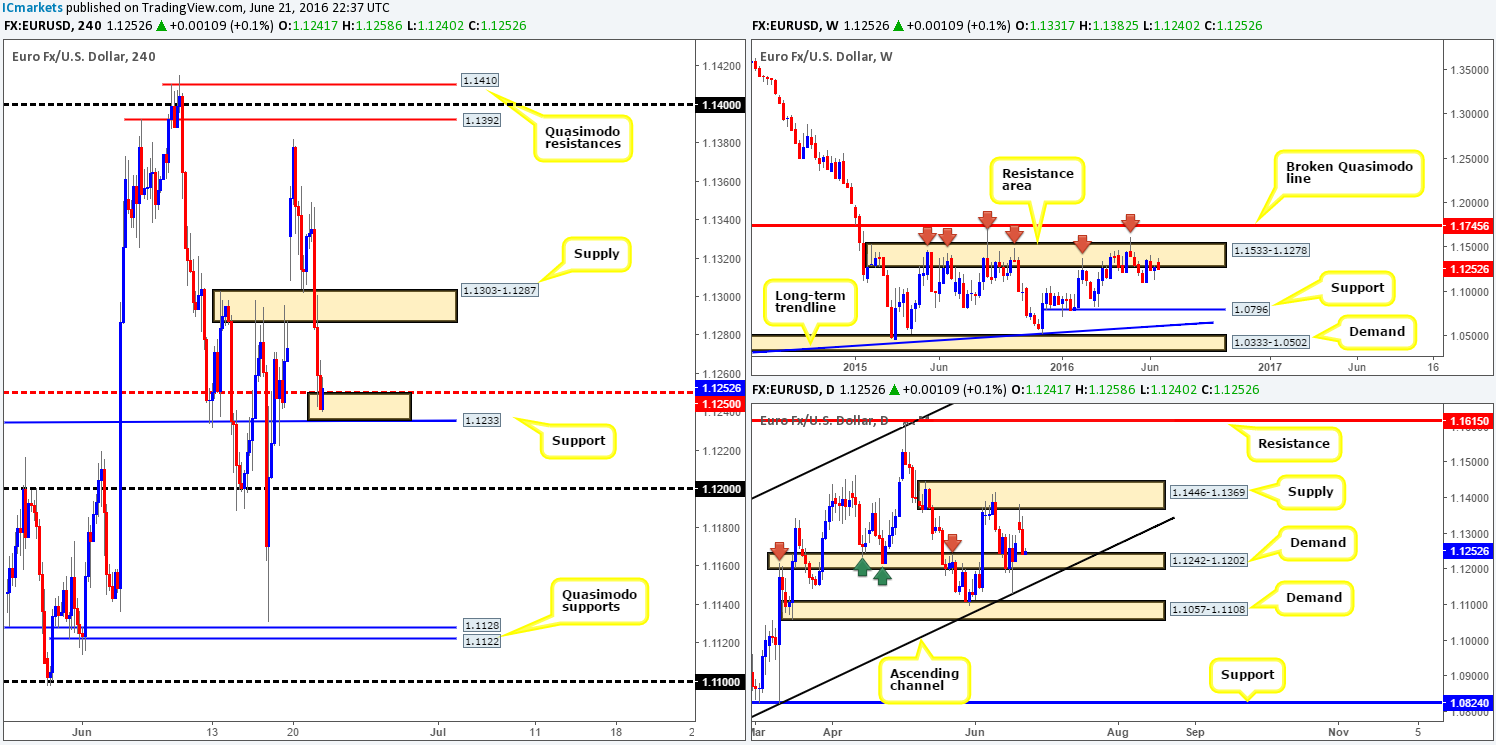
Despite the bounce seen from H4 demand at 1.1303-1.1287, the EUR fell sharply mid-way through yesterday’s London session. This, as can be seen from the H4 chart, saw price break below and quickly retest the underside of the H4 demand before dropping down to test the 1.1233/1.1250 region (H4 support at 1.1233/H4 mid-way support 1.1250) going into the close. Well done to any of our readers who managed to jump in on this one since this was a noted move to watch for in our previous report.
Thanks to yesterday’s selling, the single currency is also now seen testing the top-side of a daily demand coming in at 1.1242-1.1202. This, along with the current H4 support area (see above), may be enough to reverse price today. With that being said, however, let’s not forget that weekly action is still loitering around the underside of a weekly resistance area at 1.1533-1.1278, so a move lower could still be on the cards.
Our suggestions: A buy from the current H4 support area, although it has the backing of daily demand, is a risky play considering the large weekly resistance area looming above. Therefore, if one is looking to enter long here, do so with caution.
In regard to shorting this pair, our team will only be comfortable selling this market beyond the 1.12 handle. Reasons for why are as follows:
- Path below 1.12 looks clean down to 1.1128 – a H4 Quasimodo support.
- The current daily demand will be severely weakened.
- You’d be trading in-line with weekly expectations.
Levels to watch/live orders:
- Buys: 1.1233/1.1250 [Tentative – confirmation required] (Stop loss: dependent on where one confirms this area).
- Sells: Watch for price to consume 1.12 and look to trade any retest seen thereafter (lower timeframe confirmation required).
GBP/USD:
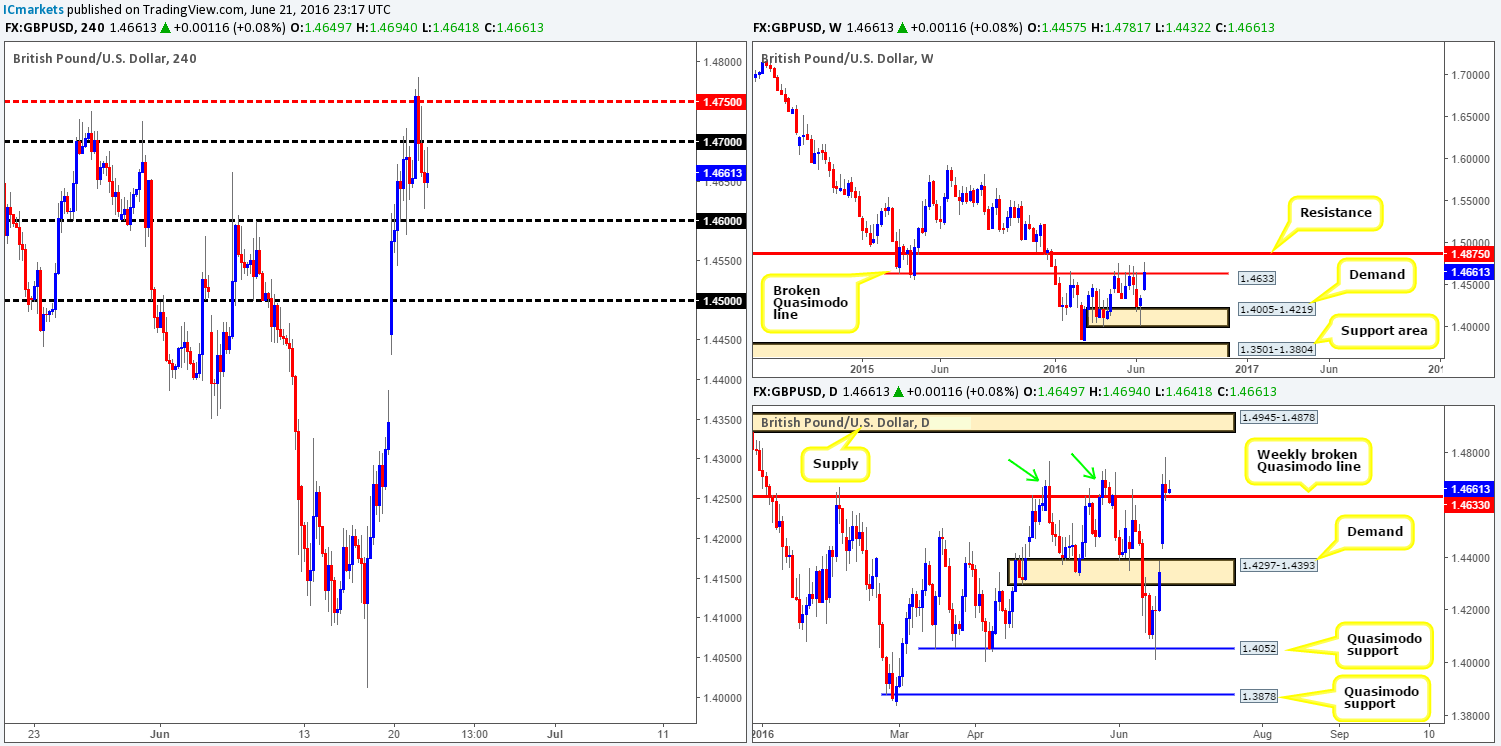
Going into yesterday’s London session, cable began topping out around the H4 mid-way resistance line at 1.4750, consequently erasing earlier gains as price pushed to lows of 1.4616 on the day. Despite ‘Brexit’ polls showing both the ‘leave/remain’ camps closing in on each other, technicals, as far as we can see, still point to a downside move.
Over on the daily chart the pound printed a nice-looking bearish selling wick yesterday just above the weekly broken Quasimodo line seen at 1.4633 (which according to the weekly chart is holding firm). Whilst some traders may take the daily close above this weekly level as bullish, we remain cautious. Just take a look to the left of current price – on two occasions (see green arrows) this unit also closed above this level and likely trapped a truckload of breakout buyers only to then later sell-off.
Our suggestions: As we mentioned in Monday’s report, we’re very hesitant trading EUR and GBP pairs this week due to the EU referendum being so close to finalizing. High volatility is expected throughout the week and as such technical setups become extremely vulnerable.
With that being said, should you still wish to trade this pair we would consider this a sellers’ market below the 1.46 handle. A decisive close below 1.46 followed by a strong retest would, under normal circumstances, be sufficient to begin looking for a lower timeframe sell entry. In all honesty though, even if this setup takes shape today or going into the week, we’d probably pass in view of the current political climate.
Levels to watch/live orders:
- Buys: Flat (Stop loss: N/A).
- Sells: Watch for price to consume 1.46 and look to trade any retest seen thereafter (lower timeframe confirmation required).
AUD/USD:
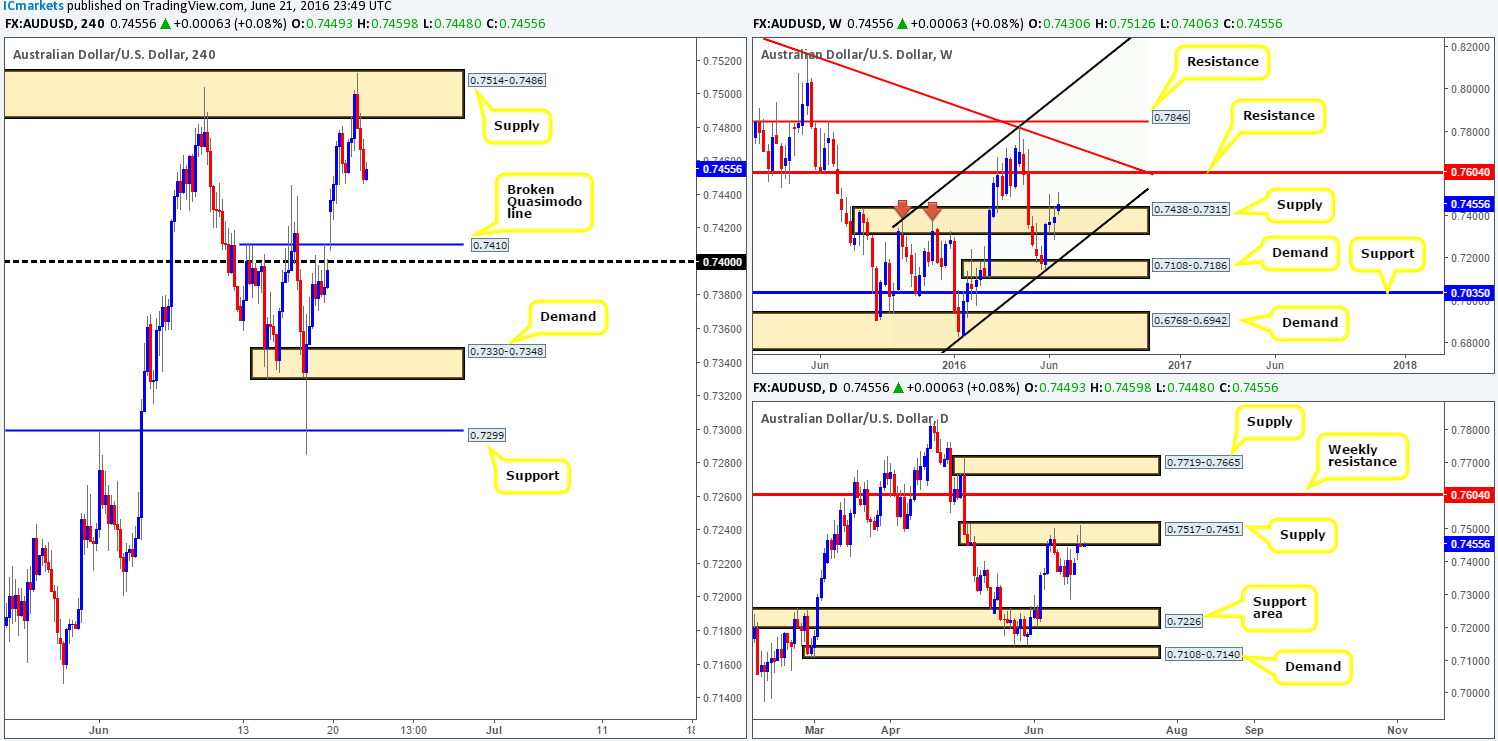
Aussie bulls went on the offensive early on in yesterday’s sessions, consequently pushing the pair into the upper edge of a H4 supply coming in at 0.7514-0.7486. It was from this point, around London lunchtime, did we see the commodity currency begin to sell-off, which, as you can see, managed to reach lows of 0.7446 going into the New york close.
What this recent downside move also did was chalk up a picture-perfect daily selling wick from within the confines of a daily supply drawn from 0.7517-0.7451. Although the daily chart shows room for this market to continue driving lower today, we’re concerned by the lack of selling strength seen around the weekly supply area at 0.7438-0.7315, as the sellers have yet to register meaning to this zone.
Our suggestions: Initially, we were looking to short from the current H4 supply, but could not pin down a lower timeframe setup, which, in our opinion, was required due to the bullish strength being seen on the weekly chart at the moment (see above). Personally, we really do not like the look of this market right now. Yes, a sell-off down to the H4 broken Quasimodo line at 0.7410 is possible, but to trade against (what looks to be) bullish intent on the weekly timeframe is not something our team would stamp high probability. As such, opting to stand on the side lines today may very well be the best path to take.
Levels to watch/live orders:
- Buys: Flat (Stop loss: N/A).
- Sells: Flat (Stop loss: N/A).
USD/JPY:
Looking at the weekly chart this morning one can see that price has begun to push higher, just ahead of the weekly support seen at 103.22. Apart from the fact that this pair is currently trending south, weekly structure shows a rather cramped market, as just above the current weekly support sits weekly supply chalked up at 105.19-107.54. A break below the current support would likely place weekly support at 101.32 in view, whilst a push above the current supply could force this market to challenge weekly supply 113.80-111.59.
Moving down to the daily chart, price has been sandwiched between daily supply at 104.68-105.36 (glued to the underside of weekly supply at 105.19-107.54) and a daily demand drawn from 103.50-103.89 (sits just above the weekly support at 103.22) since Thursday last week.
As can be seen from the H4 chart, price beautifully stabbed into the small H4 support area at 103.50-103.60 and went on to extend over 100 pips yesterday, forcing the pair to cross swords with the 105 handle into the close.
Our suggestions: One could look for shorts from 105 if price retests this handle again today, due to the daily supply at 104.68-105.36 that is now in play. However, do be prepared for a fakeout here as price may want to tag in offers from the lower edge of weekly supply at 105.19. As such, our team would not consider this a valid level unless lower timeframe confirmation was seen (for confirming techniques please see the top of this report).

Levels to watch/live orders:
- Buys: Flat (Stop loss: N/A).
- Sells: 105 region [Tentative – confirmation required] (Stop loss: dependent on where one confirms this area).
USD/CAD:
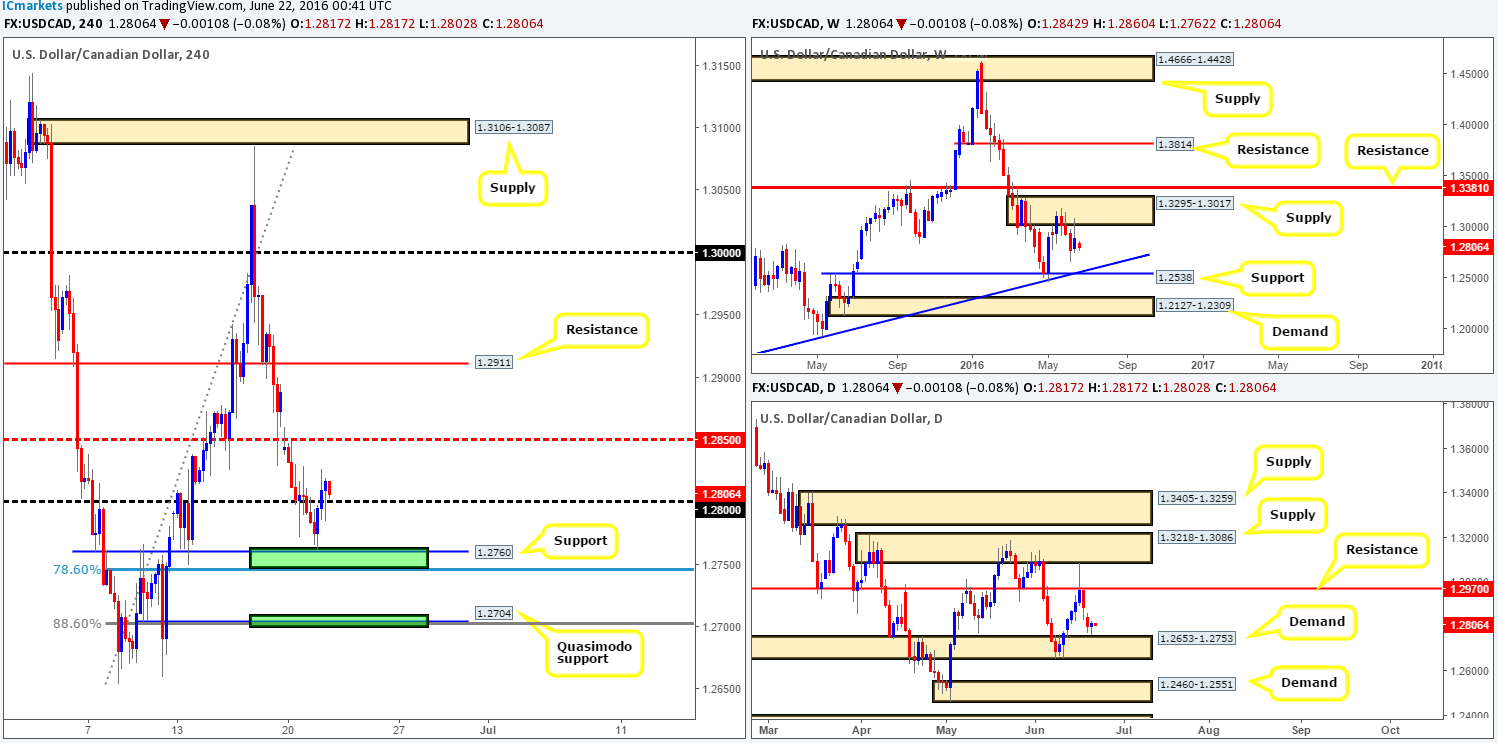
In our previous report (see link below) we mentioned to keep an eye on two H4 support zones marked in green (H4 78.6% support at 1.2746, H4 support at 1.2760/H4 Quasimodo support at 1.2704, 1.27 handle and a H4 88.6% Fib support at 1.2702) for a possible bounce. As we can all see, the market corrected sharply from the higher of the two zones and managed to close the day above the 1.28 handle.
Given that the bulls printed a daily buying tail just above daily demand at 1.2653-1.2753 with room seen for further buying, is going long from 1.28 a valid setup? Put simply, a bounce could be seen from this number up to the H4 mid-way point 1.2850, but to trade this without lower timeframe confirmation (see the top of this report for ideas on confirming techniques) is not something we’d be comfortable with. The reasons for why are as follows:
- Daily demand at 1.2653-1.2753 has yet to be visited; therefore price could still reverse and tap this zone before buying is seen.
- Weekly action recently saw a reaction to the underside of a weekly supply at 1.3295-1.3017, which could force the loonie lower to the weekly trendline support extended from the high 1.1278.
Our suggestions: Watch for a reaction to be seen off of the 1.28 handle. If this line holds and one manages to spot a lower timeframe buy setup from here, a trade could be taken with an initial take-profit target set at 1.2850.
Levels to watch/live orders:
- Buys: 1.2800 region [Tentative – confirmation required] (Stop loss: dependent on where one confirms this area).
- Sells: Flat (Stop loss: N/A).
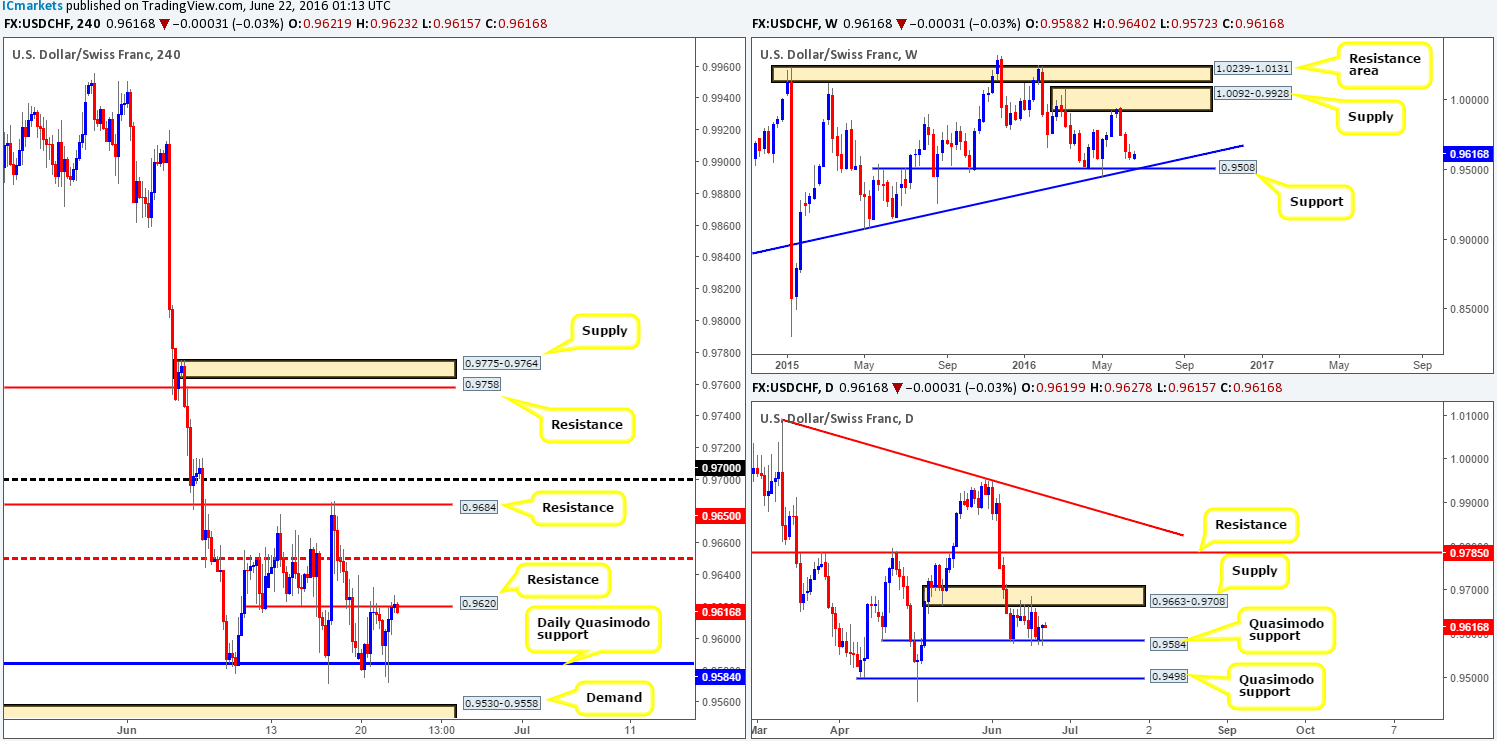
USD/CHF:
Despite the bulls beginning to make an appearance, weekly price remains bearish in our opinion. Since the Swissy connected with weekly supply at 1.0092-0.9928 the bears have been in control. In addition to this, we see very little weekly support to stop the price from continuing to push lower down to a weekly support drawn from 0.9508, which coincides nicely with weekly trendline confluence taken from the low 0.9078.
Moving down to the daily chart, we can see that structure has remained the same since the 8th June. The candles have been sandwiched between a daily supply zone at 0.9663-0.9708 and a daily Quasimodo support at 0.9584. Any sustained move beyond the current daily supply would likely place daily resistance at 0.9785 in the spotlight. Meanwhile, a push below the current daily Quasimodo support potentially opens the floodgates down to 0.9498 – another daily Quasimodo support line.
From the H4 chart, the buyers and sellers are now seen battling for position around H4 resistance coming in at 0.9620, following a bounce from the daily Quasimodo support mentioned above at 0.9584. Evident from the H4 chart, there is very little room to trade this pair at the moment, as directly above the current H4 resistance sits the H4 mid-way line at 0.9650, followed closely by H4 resistance at 0.9684.
Our suggestions: Given the tight trading conditions seen on the H4 chart at the moment, our team has come to general consensus that this pair is best left on the sidelines for the time being.
Levels to watch/live orders:
- Buys: Flat (Stop loss: N/A).
- Sells: Flat (Stop loss: N/A).
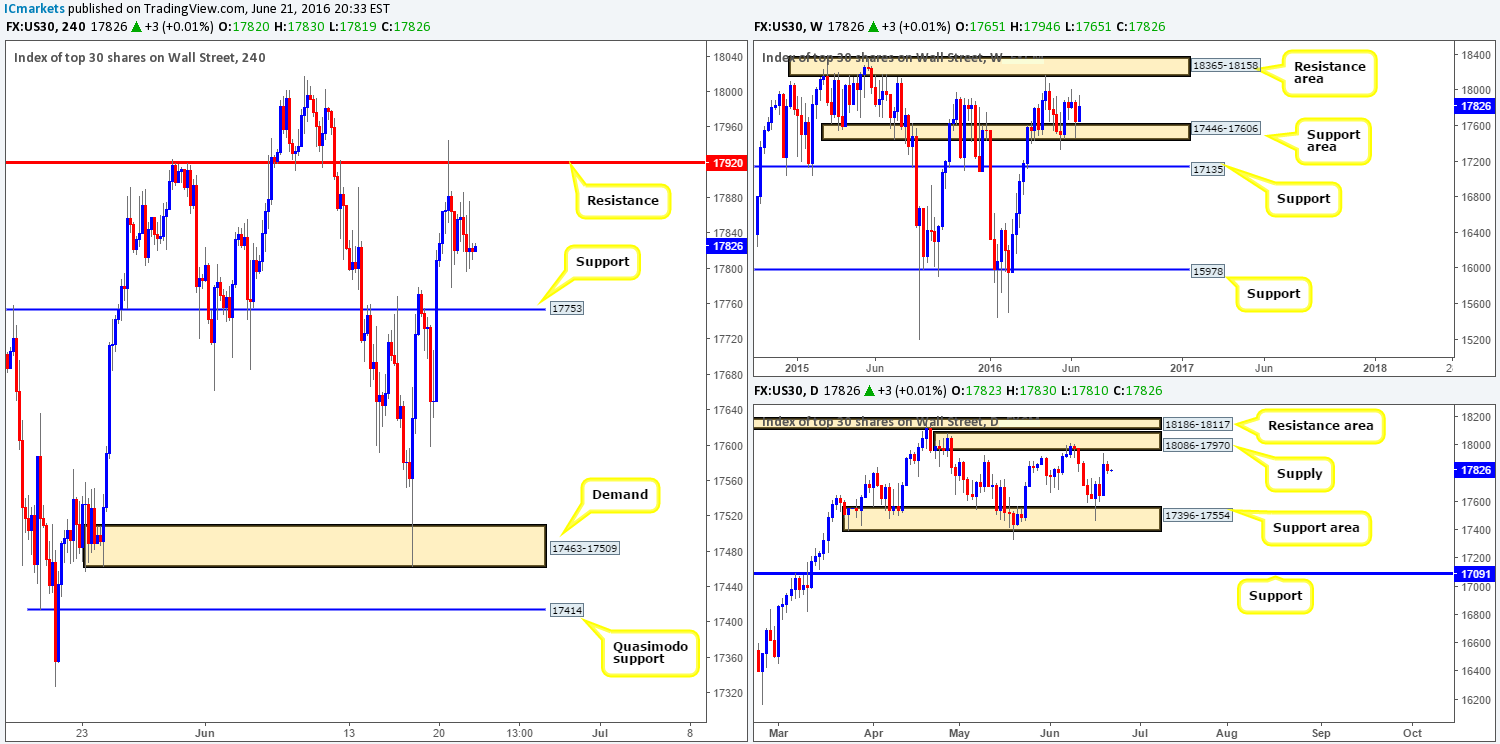
DOW 30:
US stocks took on a more mellow tone during yesterday’s sessions, ranging 91 points all in all. In view of this, the DOW is now effectively capped by H4 resistance drawn from 17920 and H4 support at 17753. With daily action trading nearby a daily supply seen at 18086-17970, is looking to go long from the aforementioned H4 support a valid setup? This is a difficult one to answer in our opinion. One could say that looking for buys here is crazy due to the daily supply now being in view. On the flip side, however, considering that the weekly chart shows price trading from a weekly support area at 17446-17606, one could also say longs may be an option from this barrier.
Our suggestions: With the EU referendum starting its engines tomorrow, trading a market which has no clear direction is of no interest to us at the moment. With that, our team’s position will remain flat going into today’s sessions.
Levels to watch/live orders:
- Buys: Flat (Stop loss: N/A).
- Sells: Flat (Stop loss: N/A).
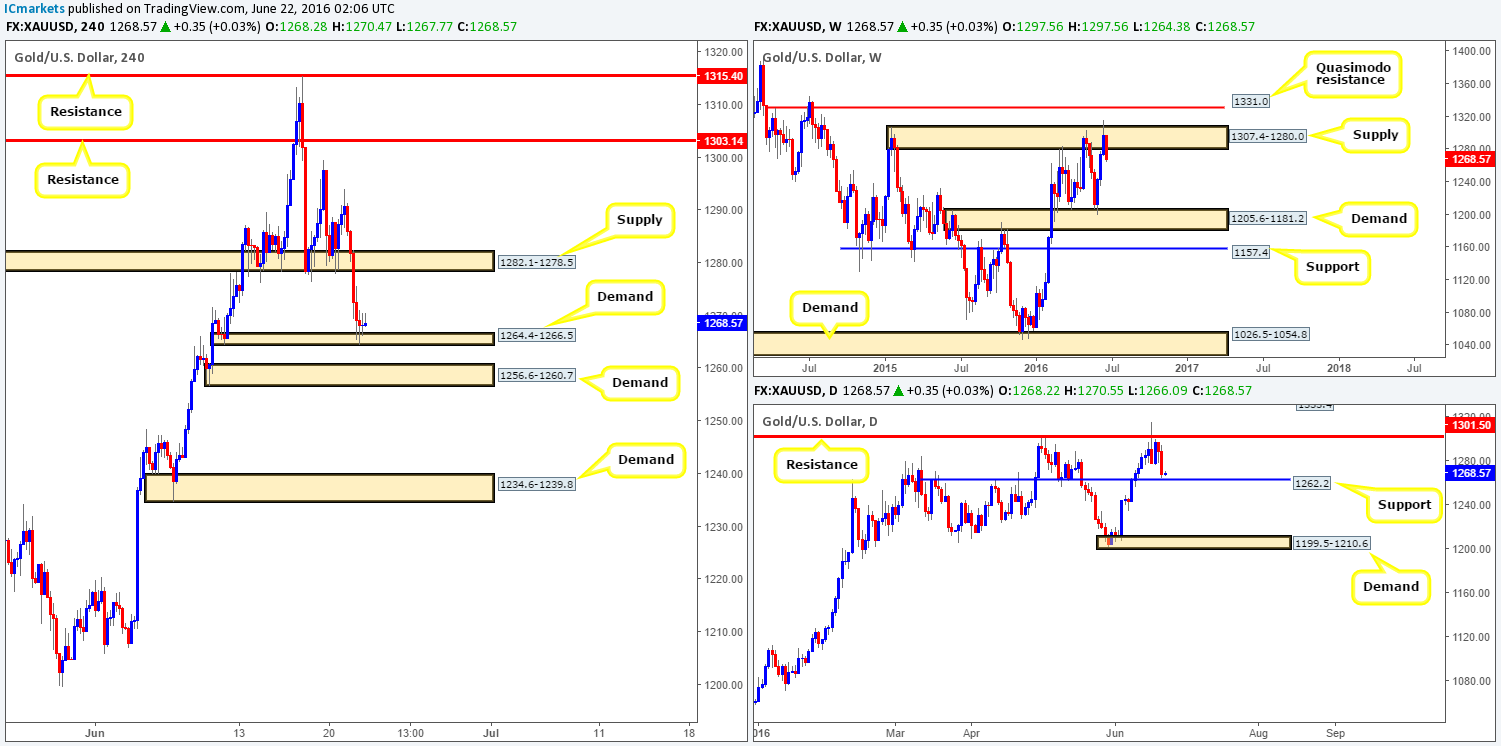
GOLD:
Gold suffered going into yesterday’s sessions as the sellers pummeled this market from the word go. H4 demand at 1282.1-1278.5 was cleanly taken out (now acting supply), which allowed price to drive down to the next area of interest – a small H4 demand seen at 1264.4-1266.5. Given that this zone sits directly above daily support at 1262.2, but against weekly movement which is trading from a weekly supply at 1307.4-1280.0, we feel that the current H4 area will be taken out today and price will move on to test H4 demand at 1256.6-1260.7.
Our suggestions: Given the position of price is on the weekly chart (see above), we are not willing to take longs in this market for now. With that being the case, our team has also noted that we’d be confident sellers beyond the H4 demand zone at 1256.6-1260.7, down to H4 demand at 1234.6-1239.8. To trade this setup, nevertheless, a retest to the underside of the broken H4 demand would need to be seen, followed by a lower timeframe sell signal (see the top of this report for entry techniques).
Levels to watch/live orders:
- Buys: Flat (Stop loss: N/A).
- Sells: Watch for price to consume 1256.6-1260.7 and look to trade any retest seen thereafter (lower timeframe confirmation required).


