A note on lower timeframe confirming price action…
Waiting for lower timeframe confirmation is our main tool to confirm strength within higher timeframe zones, and has really been the key to our trading success. It takes a little time to understand the subtle nuances, however, as each trade is never the same, but once you master the rhythm so to speak, you will be saved from countless unnecessary losing trades. The following is a list of what we look for:
- A break/retest of supply or demand dependent on which way you’re trading.
- A trendline break/retest.
- Buying/selling tails/wicks – essentially we look for a cluster of very obvious spikes off of lower timeframe support and resistance levels within the higher timeframe zone.
- Candlestick patterns. We tend to only stick with pin bars and engulfing bars as these have proven to be the most effective.
We search for lower timeframe confirmation between the M15 and H1 timeframes, since most of our higher-timeframe areas begin with the H4. Stops are usually placed 5-10 pips beyond confirming structures.
EUR/USD:
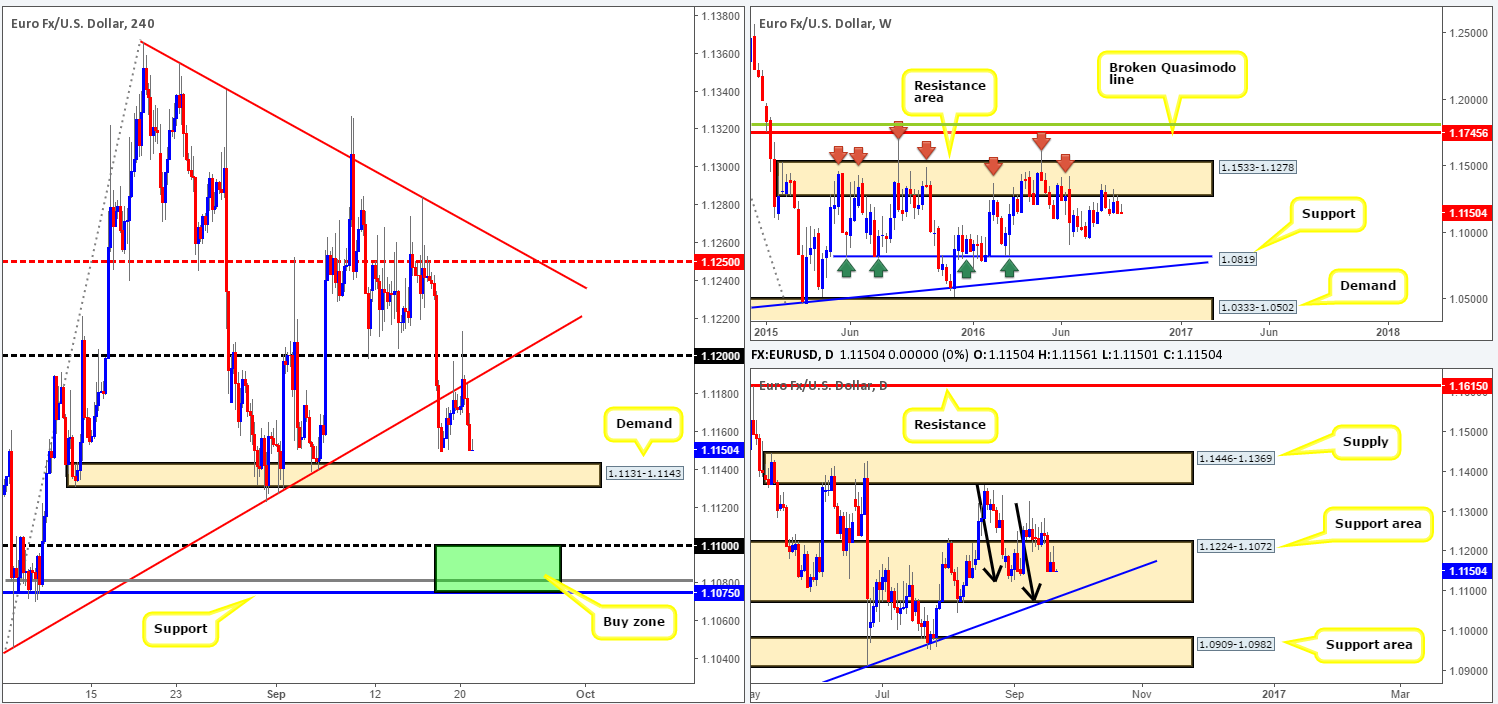
For those who read our previous report on the EUR pair you may recall us highlighting the 1.12 handle as a valid zone to look for shorting opportunities, given its connection with a H4 trendline resistance taken from the low 1.1045. Despite lower than expected US housing data, price sold off beautifully from this region, consequently testing Friday’s low at 1.1149 and ending the day closing ahead of a H4 demand seen at 1.1131-1.1143. Well done to any of our readers who managed to pin down a position from here!
Looking over to the higher-timeframe charts this morning, we can see that weekly action turned bearish from the underside of a major resistance area at 1.1533-1.1278 last week. This move could trigger further selling in this market this week. The next downside target to have an eye on falls in around the 1.0970 region, followed closely by a major support seen at 1.0819. Conversely, down on the daily chart, the candlesticks remain trading deep within a support area drawn from 1.1224-1.1072. As we’ve mentioned in previous writings, there’s been little noteworthy bullish intent registered from this barrier as of yet. Nevertheless, perhaps the most compelling factor here is that the candles are in the process of completing an AB=CD bull pattern (black arrows) which terminates around the lower edge of the above said support area, and also converges with a trendline support extended from the low 1.0516.
Our suggestions: From a technical point of view, we’re looking for a close below the current H4 demand base, as this would place the H4 support at 1.1075 and the 1.11 band (green zone) in the firing range. Not only is this a good take-profit area for any shorts in this market, it’s also a fantastic barrier to look for longs. It sits within the depths of the aforementioned daily support area, as well as merging with both the above noted daily trendline support and a deep H4 88.6% Fib support at 1.1081. Although the H4 buy zone will very likely bounce price, do keep in mind that by entering long from here you’re effectively buying into weekly flow.
Fundamentally, however, all eyes will be on the Fed who meets at 6-6.30pm GMT today to discuss monetary policy. Therefore, high volatility is expected during this time.
Levels to watch/live orders:
- Buys: 1.1075/1.11 [strong-looking buy zone which could, dependent on the time of day and approach, be sufficient enough to condone an entry without waiting for lower timeframe confirmation] (Stop loss: 1.1060).
- Sells: Flat (Stop loss: N/A).
GBP/USD:
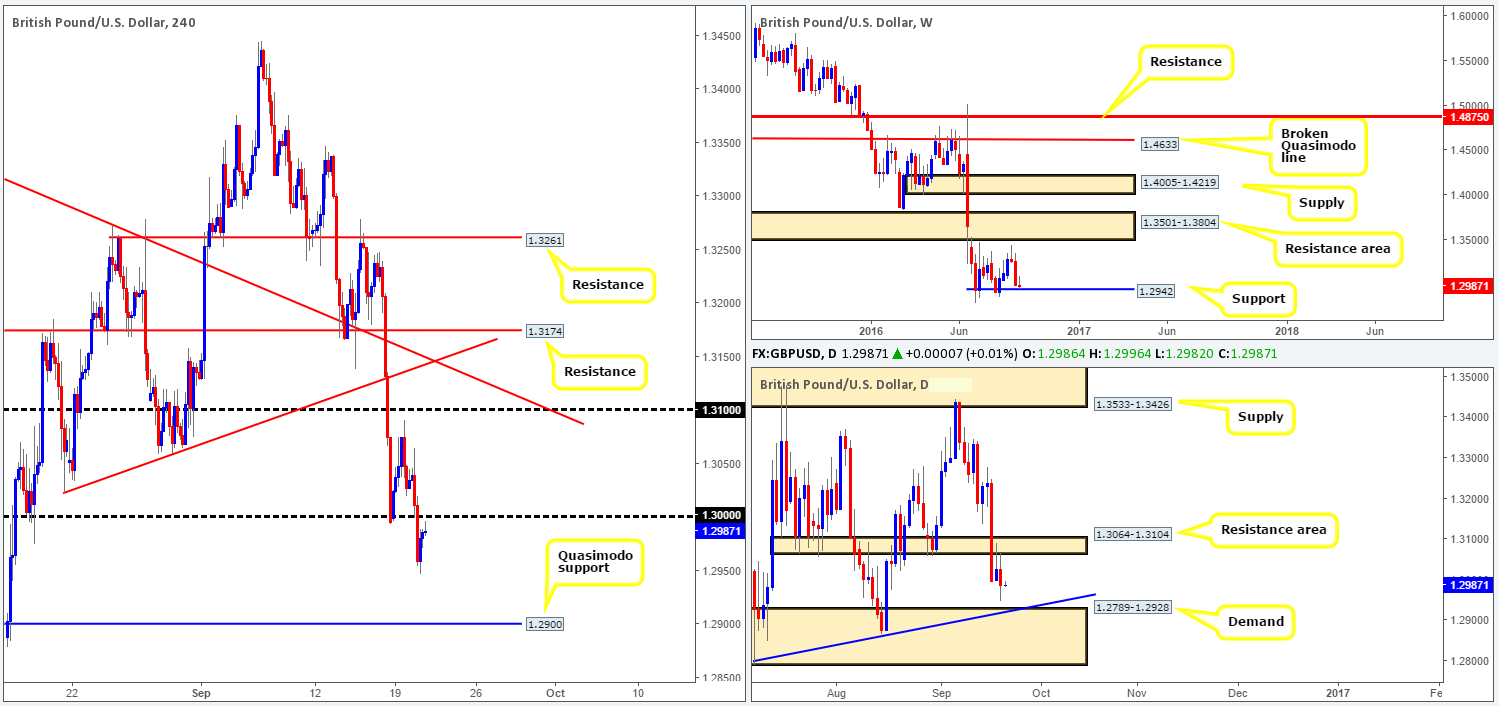
Despite the bounce seen from the key figure 1.30 on Monday, there was little follow-though seen during yesterday’s trading. In fact, the pair ended the day in negative territory, settling below the 1.30 band. In addition to this, we can also see that price is now close to testing the underside of 1.30 as resistance. On the whole, this move has likely opened up the path south for further selling down to at least the weekly support level drawn in from 1.2942, followed closely by the top edge of a daily demand base at 1.2928 and then a H4 Quasimodo support level at 1.2900.
Our suggestions: Watch for price to retest 1.30 and form a bearish H4 candle. In the event that this comes into view, shorts from this region are, at least in our book, valid down to the aforementioned weekly support line. With that being said, however, traders/investors may look to take on a more cautious stance here ahead of the Fed’s statement today at 6-6.30pm GMT.
Levels to watch/live orders:
- Buys: Flat (Stop loss: N/A).
- Sells: 1.30 region [H4 bearish close required] (Stop loss: beyond the trigger candle).
AUD/USD:
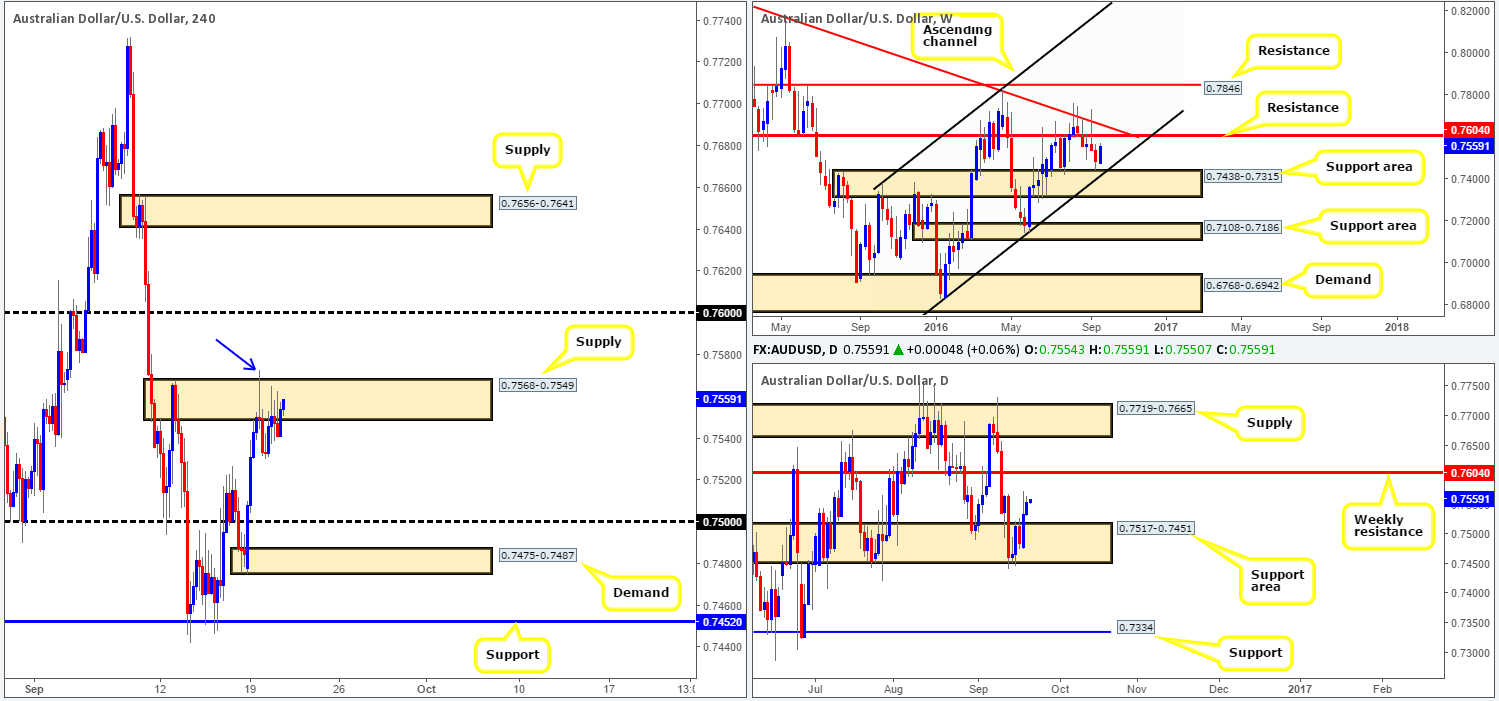
Although the dollar appreciated on Tuesday, the commodity-linked currency managed to hold firm around the underside of a H4 supply zone at 0.7568-0.7549, closing the day in a relatively bullish position. With that in mind, our team still believes that Monday’s push above the current H4 supply (blue arrow) has potentially took out a truckload of sellers in this market, suggesting that further buying may be possible up to the 0.76 handle. This – coupled with price action standing strong on top of both weekly/daily support areas (0.7438-0.7315/ 0.7517-0.7451), further confirms candle action is likely heading in the direction of 0.76 today, which, as you can probably see, also represents a weekly resistance line at 0.7604 (a possible area to look for sells).
Our suggestions: In that there’s not much room seen between the current H4 supply and 0.76, we would not recommend waiting for price to close above the H4 supply and trading the retest, unless of course you’re able to pin down a very tight stop loss. Apart from this, the areas still on our radar are the 0.75 handle and the H4 demand barrier seen just below it at 0.7475-0.7487. However, it’s unlikely that prices will drop this low given the higher-timeframe picture (see above) as well as traders/investors possibly taking on a more cautious stance ahead of today’s Fed meeting.
Levels to watch/live orders:
- Buys: 0.75 region [H4 bullish close required] (Stop loss: beyond the trigger candle). 0.7475-0.7487 [H4 bullish close required] (Stop loss: beyond the trigger candle).
- Sells: Flat (Stop loss: N/A).
USD/JPY:
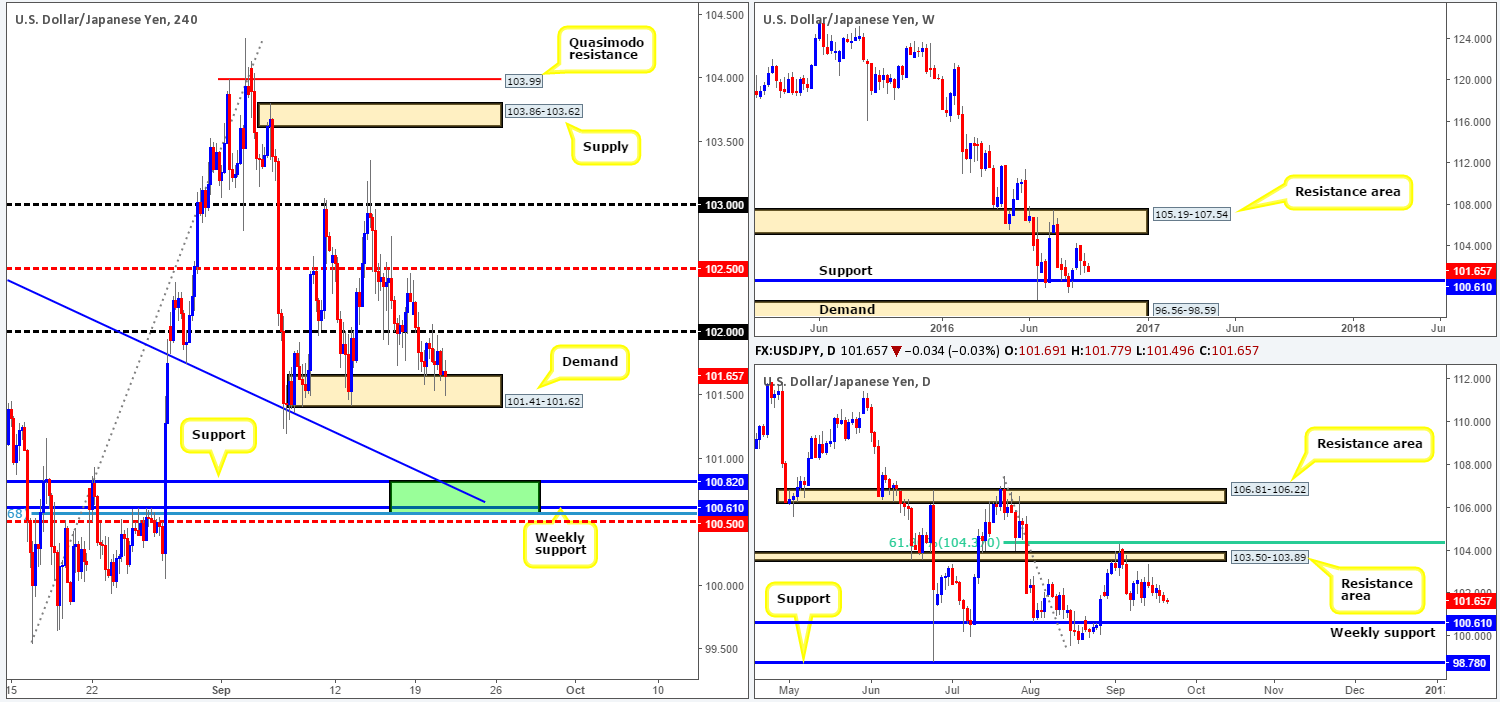
As can be seen from the H4 chart this morning, the USD/JPY pair remains locked between the 102 handle and a H4 demand base coming in at 101.41-101.62. It’s unlikely that we’ll see price breach these walls ahead of the BoJ meeting today, which is followed later by the Fed taking center stage at around 6-6.30pm GMT.
From a technical standpoint, nonetheless, both the weekly and daily charts show price boasts room to drop lower to test weekly support coming in at 100.61.Should our analysis turn out to be correct and price does indeed push lower, today’s spotlight will then firmly be focused on 100.61/100.82 (the weekly support at 100.61 and a H4 support at 100.82 [green rectangle]). This area also includes a H4 78.6% Fib support at 100.56, a H4 trendline support extended from the high 102.65 and a nearby H4 mid-way support at 100.50. In view of the confluence seen here, our team would, dependent on the time of day, look to enter long from this zone at market with a stop planted below at 100.47. However, as we mentioned above, there’s two key central bank meetings today so volatile moves are possible. As a result, we would advise caution trading during these times!
Levels to watch/live orders:
- Buys: 100.61/100.82 [dependent on the time of day, a long from this area without confirmation is possible] (Stop loss: 100.47).
- Sells: Flat (Stop loss: N/A).
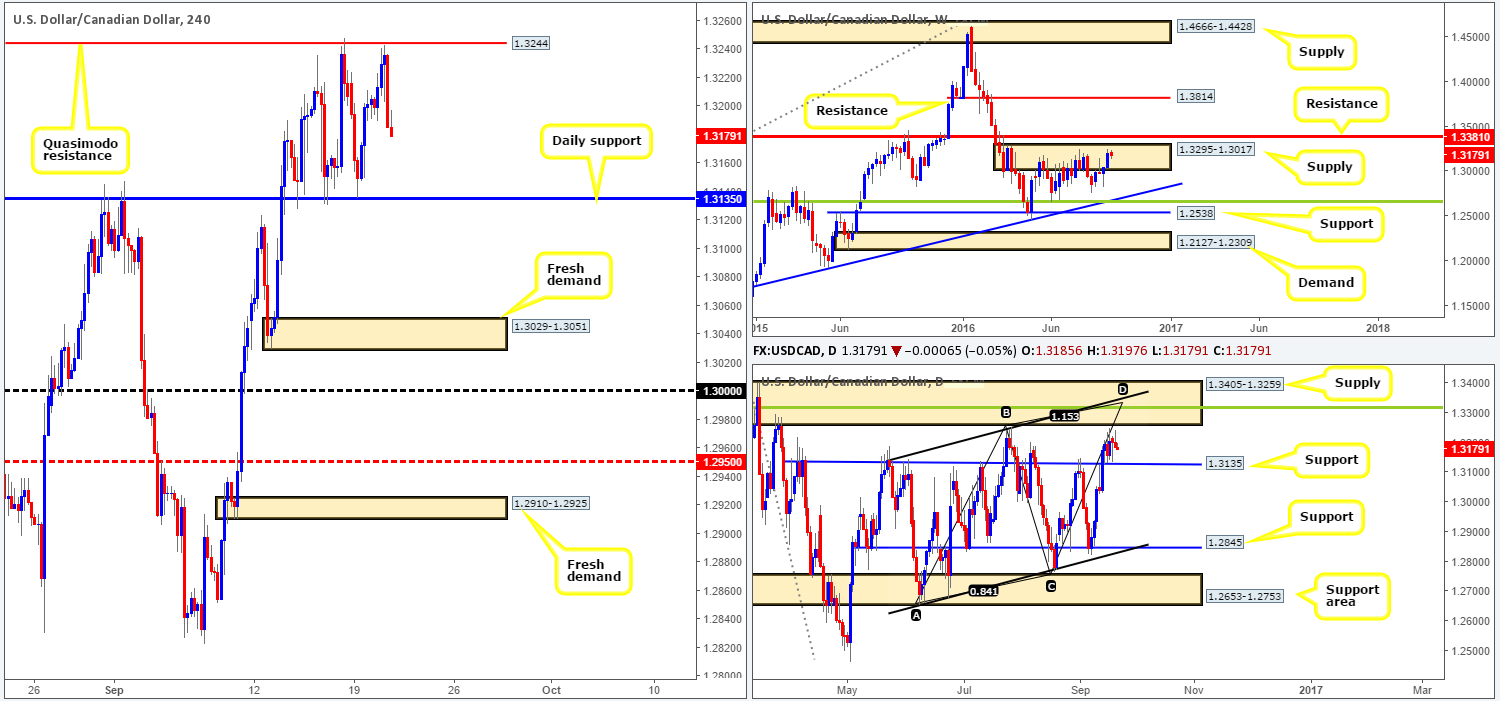
USD/CAD:
In recent sessions, we can see that the USD/CAD continued to range between a daily support level chiseled in at 1.3135 and a H4 Quasimodo resistance level at 1.3244. While weekly action still occupies the upper limit of a supply zone at 1.3295-1.3017, daily price appears to be relatively well-bid from the aforementioned support level. To our way of seeing things, this could potentially push prices north to test daily supply at 1.3405-1.3259.
Our suggestions: In that H4 price effectively still remains range bound, much of the following will represent thoughts put forward in Tuesday’s report:
Should H4 action close below the current daily support, this could spark a selloff down to a fresh H4 demand area at 1.3029-1.3051. Supported by prices lurking within weekly supply at the moment, we would look to short beyond the daily support line if price retests this boundary as resistance (waiting for a H4 bearish close following the retest is recommended).
In addition to the above, do keep a tab on the 1.33 handle (not seen on the H4 chart). Not only does this number sit within the above said daily supply, it is also positioned nearby a daily convergence point (a 38.2% Fib resistance level at 1.3315 [green line], a weekly resistance level at 1.3381, a channel resistance taken from the high 1.3241 and an AB=CD completion point around the 1.3332ish range). If price reaches the 1.3310/15 region we’d have no hesitation (apart from if high-impacting news is scheduled for release) in shorting here at market with stops placed above the daily supply zone at 1.3407.
On the data front, nevertheless, do keep a tab on Crude oil inventories data set to be released at 2.30pm GMT, followed by the Fed taking center stage at 6-6.30pm GMT.
Levels to watch/live orders
- Buys: Flat (Stop loss: N/A).
- Sells: Watch for price to close beyond daily support at 1.3135 and then look to trade any retest seen thereafter [waiting for a H4 bearish close following the retest is preferred] (Stop loss: beyond the trigger candle). 1.3310/15 region (Stop loss: 1.3407).
USD/CHF:
Beginning with a look at the weekly chart this morning, the USD/CHF has been consolidating between a supply zone painted at 1.0092-0.9928 and a support band drawn from 0.9581 since the beginning of May. It’s unlikely that price will breach the walls of this range this week, so the best we can do on this timeframe is continue to keep a tab on the edges of this consolidation. The story on the daily chart, nonetheless, shows that price is seen hovering between a support area at 0.9648-0.9708 and a trendline resistance extended from the high 1.0256.
Jumping over to the H4 chart, current price is seen lodged between the 0.98 handle and a H4 support band drawn from 0.9784. While a close above 0.98 is considered a bullish cue, our team will not be looking to buy here. The reason for why is simply because there’s a H4 harmonic Gartley reversal zone seen just above between 0.9884/0.9835 (green zone). However, we are only really interested in shorting between the 0.9863/0.9835 region (a H4 Quasimodo resistance line/78.6% Fib resistance). Given that this sell zone converges with the above said daily trendline resistance, we’ll be looking to short from here (on the condition that a H4 bearish candle forms) with our stop placed either above the trigger candle or the H4 Quasimodo resistance line. Today’s trading may, however, be a little on the slow side ahead of the Fed meeting scheduled at 6-6.30pm GMT, as traders/investors will likely take on a more cautious stance.

Levels to watch/live orders:
- Buys: Flat (Stop loss: N/A).
- Sells: 0.9863/0.9835 [H4 bearish close required] (Stop loss: beyond the trigger candle).
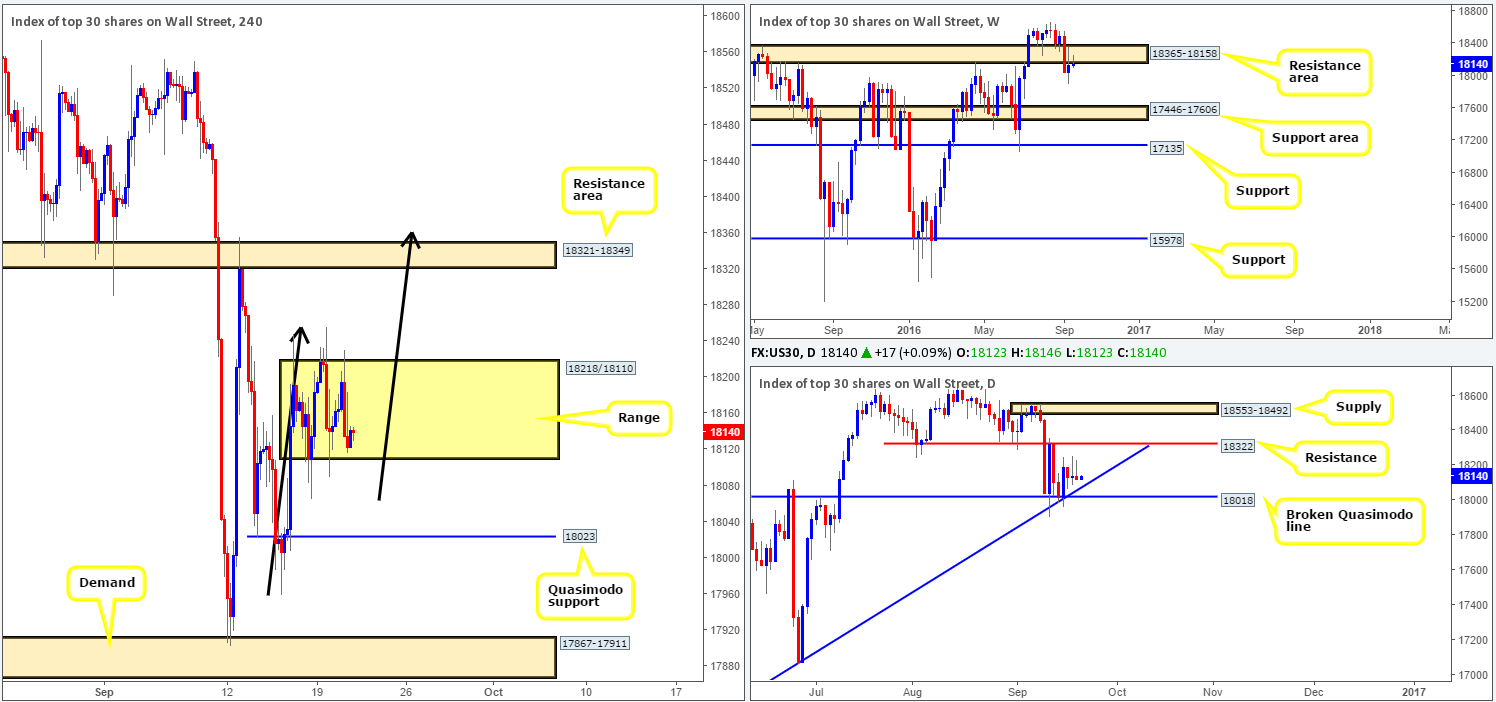
DOW 30:
Recent action shows that US stocks have entered into a period of consolidation between 18218/18110. Any sustained move beyond the top edge of this range would likely place the H4 resistance area at 18321-18349 back in view. Meanwhile, a break south here could possibly land prices within striking distance of a H4 Quasimodo support level coming in at 18023.
Higher-timeframe technicals on the other hand reveal that weekly price remains hugging the underside of a resistance area at 18365-18158. Further selling from this point could potentially drag the equity market down to a support area carved from 17446-17606. Despite this, daily candles are seen loitering between a resistance line seen at 18322 and a broken Quasimodo line chalked up at 18018 (converges with a trendline support taken from the low 15501).
Our suggestions: Our team still has an eyeball on the current H4 resistance area for shorting opportunities. Not only is this zone connected with the above said daily resistance line, but it is also merges nicely with a H4 AB=CD formation (drawn from the low 17959 – black arrows) which terminates around the 18355ish range. Since a fakeout through this zone is possible, nevertheless, we would advise waiting for price to at least chalk up a H4 bearish close before considering pulling the trigger. Also, do bear in mind that the Fed is set to take the spotlight later on today between 6-6.30pm GMT, which has the potential to send ripples through this market, so do remain vigilant during this time!
Levels to watch/live orders:
- Buys: Flat (Stop loss: N/A).
- Sells: 18321-18349 [H4 bearish close required] (Stop loss: beyond the trigger candle).
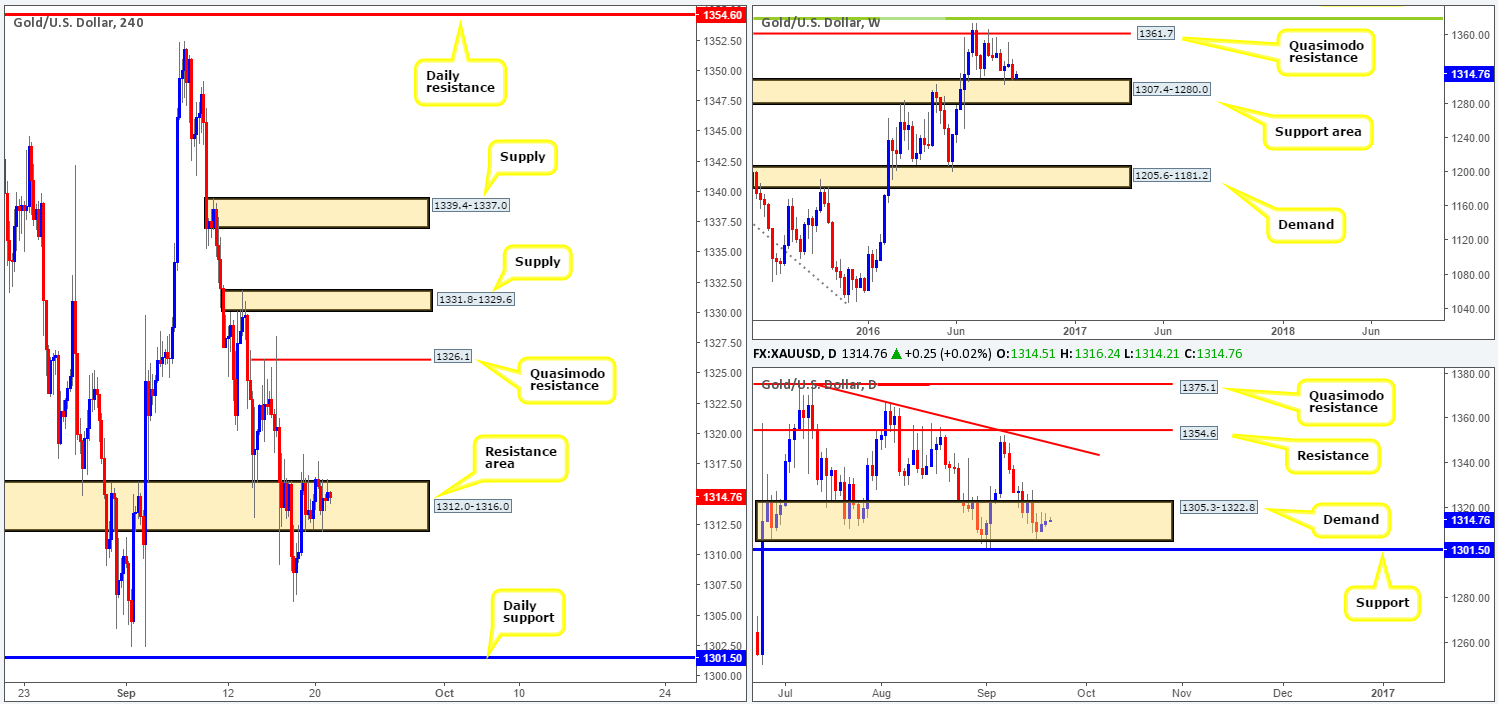
GOLD:
While weekly price has established itself around the top edge of a support area at 1307.4-1280.0, and daily candles have taken root within a demand base at 1305.3-1322.8, medium-term direction, at least technically, is likely to be northbound. As such, with H4 movement seen consolidating within a resistance area registered at 1312.0-1316.0, a close above this zone is the more likely scenario to play out.
However, we’re certainly not suggesting buying the yellow metal right now. Upon a decisive close above the current H4 resistance zone, looking for buying opportunities on a strong retest of this boundary is, nonetheless, something our team will very likely consider. Should this come into play, the first take-profit objective can be seen at the minor H4 Quasimodo resistance drawn from 1326.1, followed closely by the H4 supply area seen at 1331.8-1329.6.
Despite the technicals painting a relatively clear picture at the moment, we do have to keep in mind that the Fed is set to make an appearance later on today around 6-6.30pm GMT. This, as we’re sure most are already aware, is a relatively dangerous time for technical traders to be participating in the market. A general rule of thumb that we subscribe to is no positions are to be taken 30 minutes pre/post the event, which has so far served us well.
Levels to watch/live orders:
- Buys: Watch for price to close beyond the H4 resistance area at 1312.0-1316.0 and then look to trade any retest seen thereafter [waiting for a H4 bullish close to form following the retest is preferred] (Stop loss: beyond the trigger candle).
- Sells: Flat (Stop loss: N/A).


