EUR/USD:
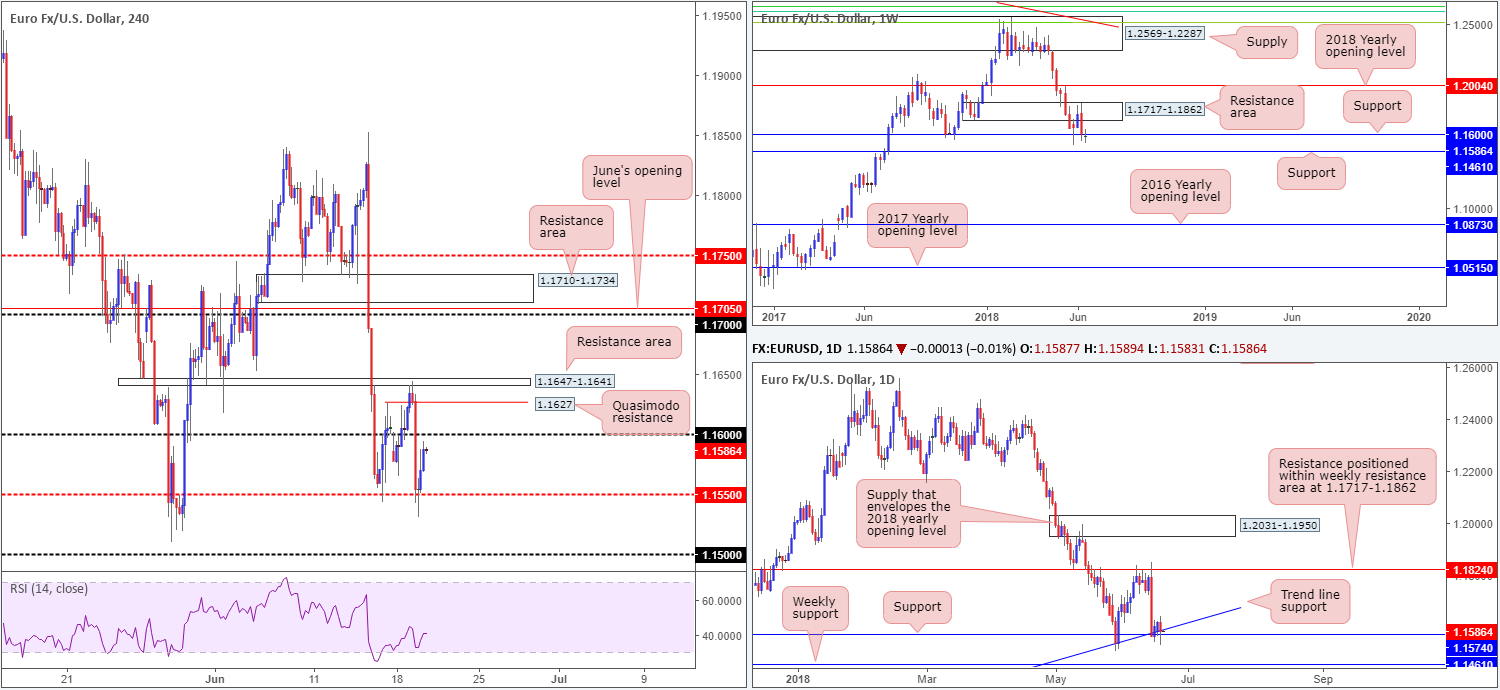
Following a near-perfect H4 ABCD bearish formation that terminated around a small H4 area of resistance drawn from 1.1647-1.1641, the H4 candles aggressively drove south in European hours on Tuesday, consequently extending post-ECB policy meeting lows to around 1.1530. Risk aversion dominated the FX board after US President Donald Trump asked US Trade Representatives to identify $200bln in Chinese goods for further tariffs of 10% if China goes through with its $50bln retaliation threat.
Despite recent selling, the H4 mid-level support at 1.1550 managed to remain firm, providing a platform for US traders to lift the euro higher. As you can see, the pair concluded the day’s trade a stone’s throw away from the underside of the 1.16 handle.
Echoing the current bearish vibe, we can see that weekly price edged its way beneath weekly support at 1.1600 amid trade yesterday. It’s far too early to tell whether this level is consumed, but it may pay to pencil in the next weekly support target which stands at 1.1461, should further selling be seen. Down on the daily timeframe, however, the pair remains supported by 1.1574 coupled with a neighboring daily trend line support taken from the low 1.0340.
Areas of consideration:
Having seen weekly price pop below support, the 1.16 handle on the H4 timeframe (which effectively represents the weekly support) along with the H4 Quasimodo resistance positioned a few pips above it at 1.1627, may be of interest for potential shorts.
Technically speaking, we prefer the Quasimodo resistance on this occasion due to the fact that psychological numbers tend to suffer fakeouts. As for stop-loss placement, the ideal location appears to be beyond the nearby H4 resistance area at 1.1647-1.1641. Traders should expect some support to materialize from 1.16, but it should not pose too much of a problem. Traders may also want to consider reducing risk to breakeven on a H4 close beneath 1.16 and begin taking profits around the 1.1650 neighborhood.
Today’s data points: ECB President Draghi speaks; US current account; US existing home sales; Fed Chair Powell also takes to the stage.
GBP/USD:
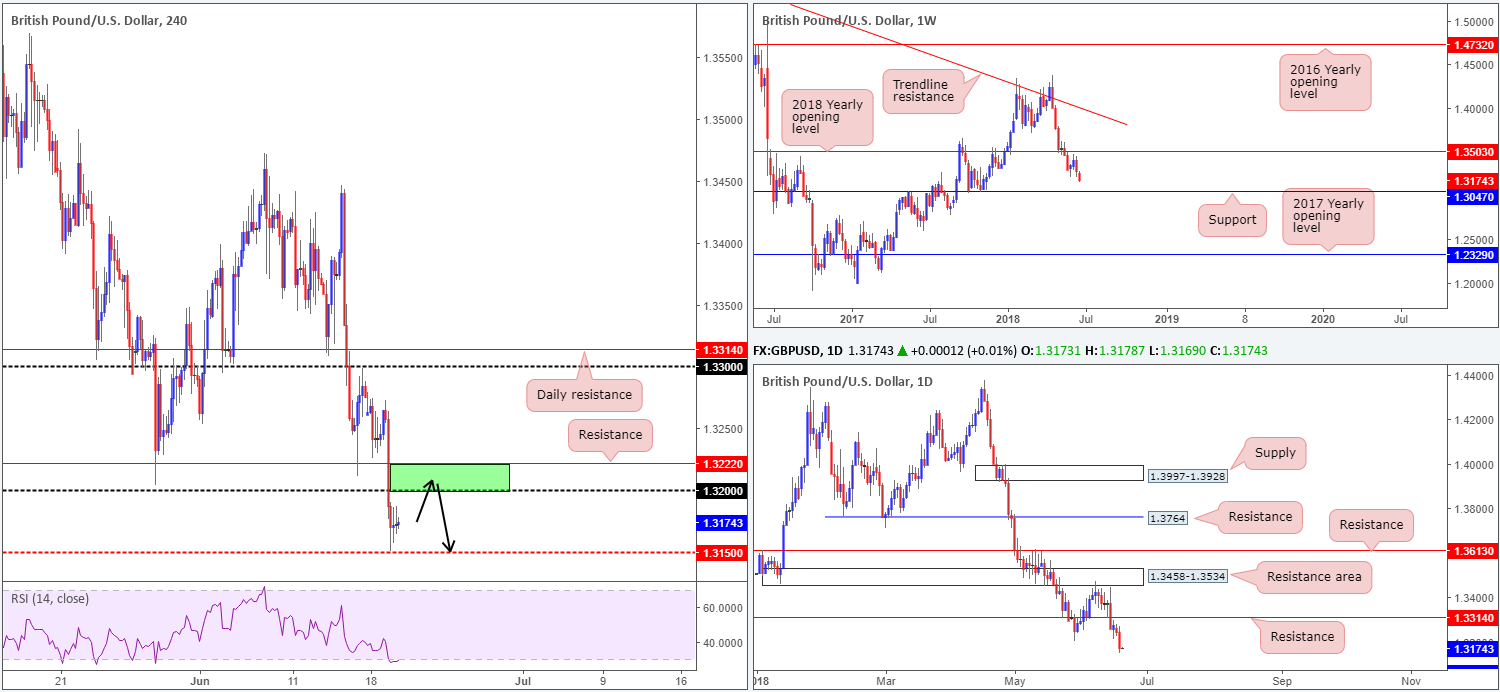
The British pound came under renewed pressure on Tuesday, probing to fresh 2018 lows of 1.3150. The currency felt the heat from not only Brexit-related headlines, but also broad risk aversion.
Technically speaking, all three timeframes we watch continue to air somewhat bearish vibes. Although H4 price has established modest support off 1.3150, the 1.32 handle and nearby H4 resistance level at 1.3222 (green zone) will likely be a difficult base to overcome.
Further adding to this, we can see that both weekly and daily structure show room to stretch lower. The closest support can be found on the daily timeframe (not seen on the screen) at 1.3063, followed closely by weekly support priced in at 1.3047.
Areas of consideration:
Accounting for the above, the team has noted to keep eyes on the green H4 area at 1.3222/1.32 for possible selling opportunities today. An ideal sell signal out of this zone would be for H4 price to chalk up a full or near-full-bodied bearish candle, thus allowing traders to pin their stops above the candles rejection wick.
In regards to areas of concern from the noted sell zone, we have the 1.3150 point as the first port of call, shadowed by the 1.31 handle and nearby H4 Quasimodo support at 1.3085 (not seen on the screen). By this point a large portion of your position should be liquidated as the next stop, in terms of supportive structure, is the aforementioned daily support!
Today’s data points: US current account; US existing home sales; Fed Chair Powell speaks.
AUD/USD:
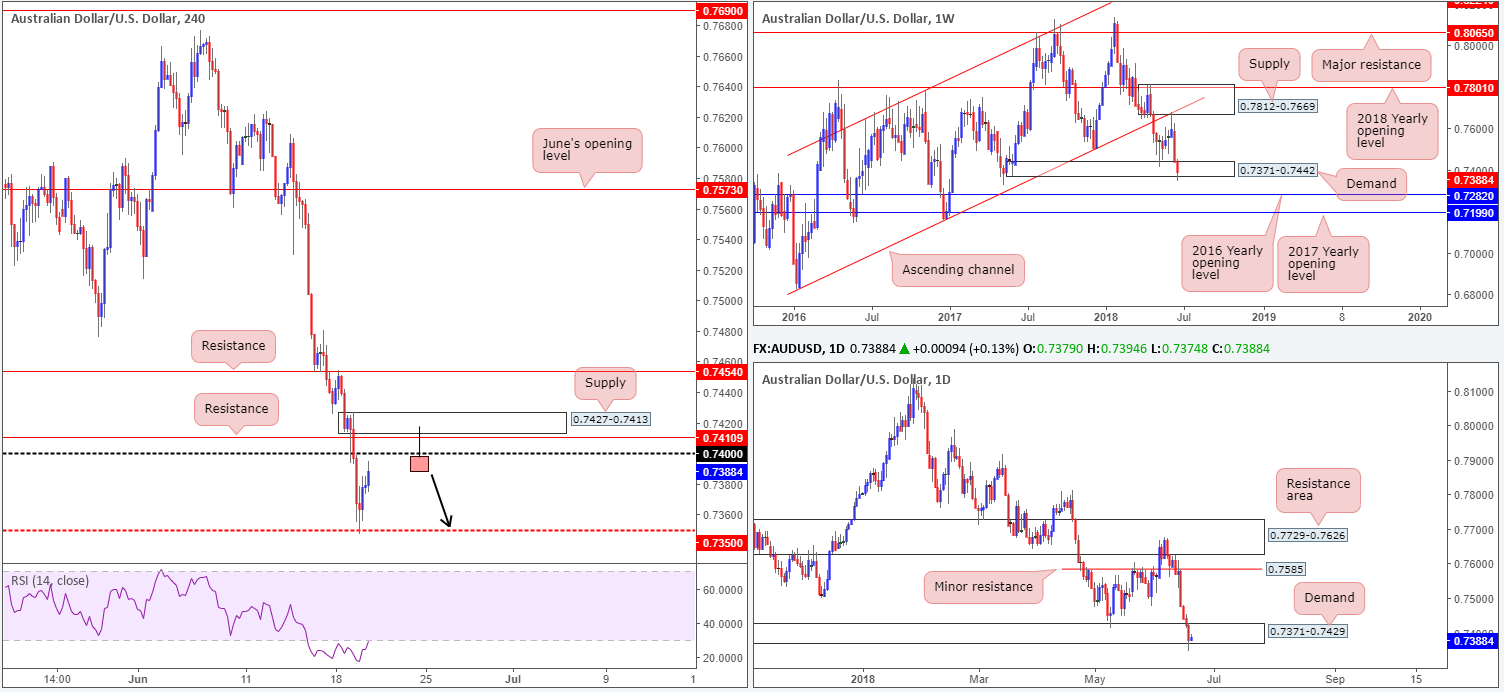
The Australian dollar sustained further losses on Tuesday, influenced by escalating tensions between the US and China. Due to Australia’s relationship with China, the AUD/USD broke through the 0.74 handle in strong fashion during Asia and continued to extend losses amid European trade. The pair did, however, manage to recover somewhat in US trade, establishing support off of the H4 mid-level number 0.7350, bolstered by a bounce to the upside seen in the US equity market.
Interestingly, yesterday’s move south saw higher-timeframe action pierce through weekly demand at 0.7371-0.7442, and its partner demand on the daily timeframe at 0.7371-0.7429. With a large portion of long-term buyers’ stop-loss orders likely triggered as a result of this push lower, there’s a chance further downside could be on the cards.
Areas of consideration:
What really jumps out at us this morning is the H4 supply zone seen at 0.7427-0.7413. Why? Well, apart from the zone boasting strong momentum to the downside, it is also located just above the 0.74 handle and H4 resistance at 0.7410. Fakeouts are a common occurrence around psychological numbers, so a whipsaw above the 0.74 handle into our aforementioned H4 supply, is certainly a possibility today.
An ideal sell signal, as far as we can see, would be for H4 price to print a bearish pin-bar formation that pierces through 0.74 (and the aforesaid H4 resistance) into the noted H4 supply zone (see H4 chart for a visual representation – sells on the close of this candle pattern with an initial target objective seen at 0.7350).
In addition to this, let’s also remember that buyers appear weak on the bigger picture thanks to a recent breach of demand.
Today’s data points: RBA Gov. Lowe speaks; US current account; US existing home sales; Fed Chair Powell speaks.
USD/JPY:
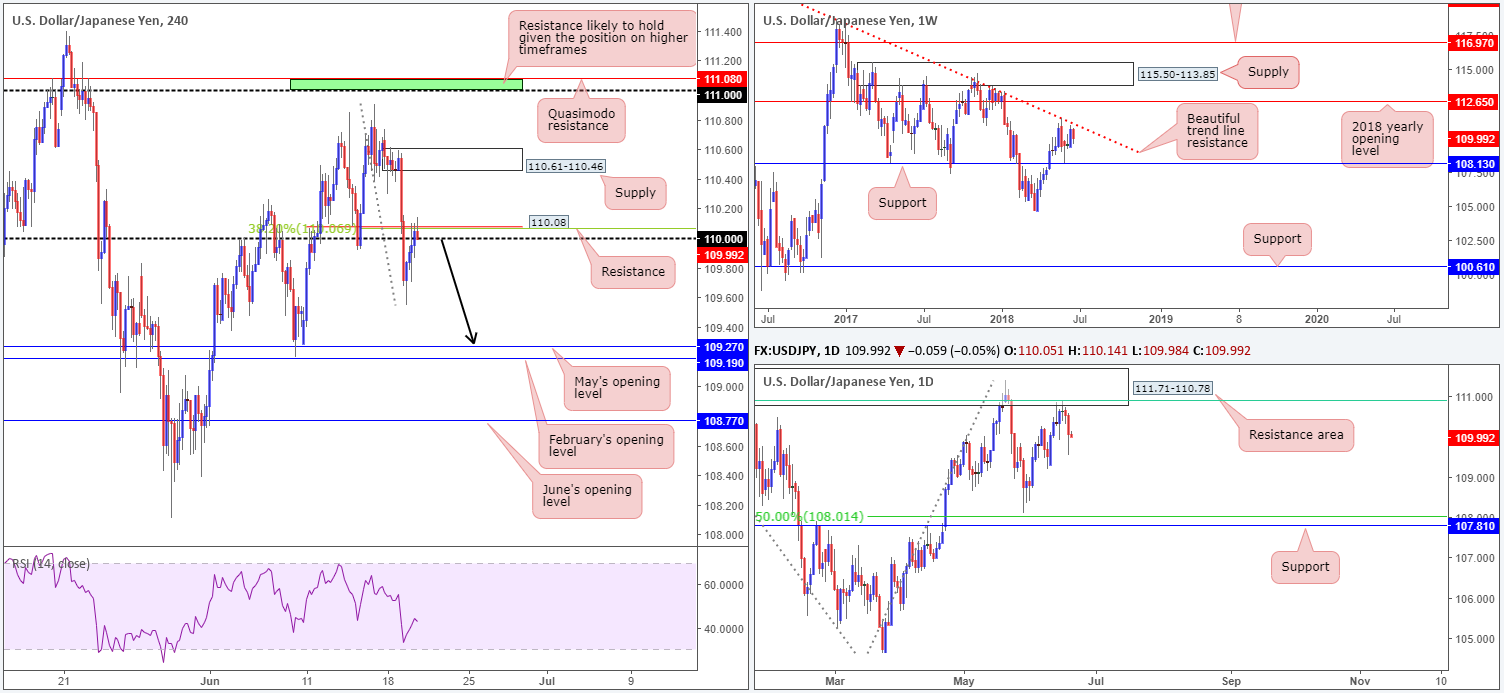
Early trade on Tuesday witnessed a strong round of selling take place, as traders favored the safe-haven yen on escalating tensions between the US and China. As is shown on the H4 chart, the downside move breached the 110 handle and clocked fresh lows of 109.55 as we entered European hours. On the back of a recovery in US equities, said lows remained supportive and forced the H4 candles to reclaim 110 into the close. The H4 resistance seen directly above the 110 handle at 110.08, which also happens to be bolstered by a 38.2% H4 Fib resistance value at 110.07, is, so far, doing a superb job in holding back breakout buyers above 110.
Weekly price action is seen trading lower from just ahead of a trend line resistance taken from the high 123.67, and daily movement is currently selling off from a daily resistance zone seen at 111.71-110.78. This is an area that not only fuses with the aforementioned weekly trend line resistance, it also converges with a 61.8% daily Fib resistance value at 110.91 (green line) and has reasonably significant history dating back to August 2017. The next support target on the daily scale, as far as we can see, is the June 8 low drawn from 109.19. This is then followed by weekly support at 108.13.
Areas of consideration:
Owing to a somewhat bearish vibe in the market this morning, shorts could still be the order of the day despite the push above 110!
Should H4 price CLOSE in the shape of a bearish pin-bar formation off the 110.08 H4 resistance level, shorting this market could be an option. The first take-profit level can be found around yesterday’s low: 109.55, followed then by May’s opening barrier at 109.27 and February’s opening level at 109.19 (essentially representing the June 8 low at 109.19 on the daily timeframe).
Today’s data points: US current account; US existing home sales; Fed Chair Powell and BoJ Gov. Kuroda speak.
USD/CAD:
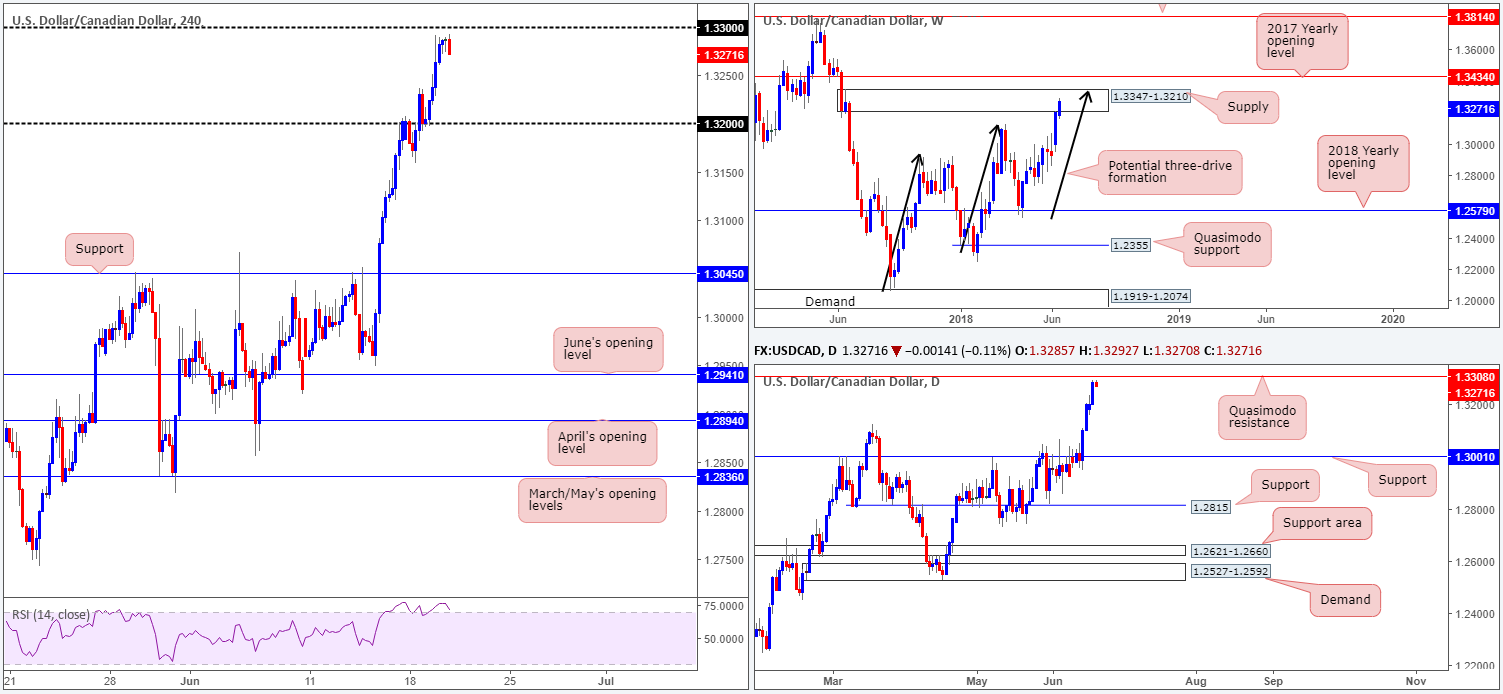
Combined with a robust USD seen across the board and softening oil prices, the USD/CAD struck fresh 2018 highs of 1.3291 on Tuesday. This, as you can see from the H4 timeframe, firmly places the 1.33 handle in sight.
Whether you’re considering a fade off 1.33 or a breakout play, you may want to note that a few pips above this psychological border sits a daily Quasimodo resistance level marked at 1.3308. Further adding to this, it may also be worth taking into account that weekly price is in process of completing a three-drive formation (see black arrows) that terminates within the upper limit of a weekly supply (1.3347-1.3210) at 1.3340ish.
Areas of consideration:
In light of recent movement, patience is the order of the day!
Simply charging in and shorting 1.33 could lead to an unnecessary loss. The alternative, as we see it, is to wait and see how H4 candle action responds. A H4 bearish pin-bar formation that pierces through 1.33 and tags the aforementioned daily Quasimodo resistance level, for example, would be considered a strong sell signal.
A H4 close above 1.33 and nearby daily Quasimodo resistance, on the other hand, could lead to the weekly three-drive pattern completing, thus a move up to 1.3340s is then likely. In this case, the team has noted to keep eyes on shorts around the 1.3335/1.3340ish zone, with stop-loss orders tightly tucked above the current weekly supply area.
Today’s data points: US current account; US existing home sales; Fed Chair Powell speaks; Crude oil inventories.
USD/CHF:
Aside from a modest move to the upside amid European trade on Tuesday, the USD/CHF was relatively sedated as price spent the remainder of the day fluctuating around the H4 mid-level number 0.9950. Recent movement, however, has led to the possibility of a H4 ABCD formation (black arrows) playing out, which terminates just north of the 0.99 handle. Traders may have also noticed that supporting the 0.99 band is a 38.2% H4 Fib support at 0.9913, a H4 50.0% support at 0.9908 and a 127.2% H4 Fib ext. point at 0.9897.
The story over on the bigger picture shows that daily price action remains capped beneath resistance priced in at 0.9982. In the event that this level gives way, all eyes will likely be on nearby daily resistance area at 1.0060-1.0023. On the other side of the spectrum, though, weekly price still shows room to probe higher and reconnect with the 2016 yearly opening level at 1.0029: a barrier which held price lower in early May of this year and in late October in 2017.
Areas of consideration:
Intraday, it’d be great to see H4 price test the 0.99 region for a possible bounce to the upside. According to our analysis, the H4 buy zone can be seen at the green area marked from 0.9897/0.9913. Initial resistance seen from this area is found at the 0.9950 mark, followed then by daily resistance mentioned above at 0.9982.
Longer term, nevertheless, we could eventually see a break of the current daily resistance level in order for weekly price to challenge the 2016 yearly opening level at 1.0029, which happens to be sited within the lower limit of the daily resistance area mentioned above at 1.0060-1.0023.
Today’s data points: US current account; US existing home sales; Fed Chair Powell speaks.

The use of the site is agreement that the site is for informational and educational purposes only and does not constitute advice in any form in the furtherance of any trade or trading decisions.
The accuracy, completeness and timeliness of the information contained on this site cannot be guaranteed. IC Markets does not warranty, guarantee or make any representations, or assume any liability with regard to financial results based on the use of the information in the site.
News, views, opinions, recommendations and other information obtained from sources outside of www.icmarkets.com.au, used in this site are believed to be reliable, but we cannot guarantee their accuracy or completeness. All such information is subject to change at any time without notice. IC Markets assumes no responsibility for the content of any linked site. The fact that such links may exist does not indicate approval or endorsement of any material contained on any linked site.
IC Markets is not liable for any harm caused by the transmission, through accessing the services or information on this site, of a computer virus, or other computer code or programming device that might be used to access, delete, damage, disable, disrupt or otherwise impede in any manner, the operation of the site or of any user’s software, hardware, data or property.


