EUR/USD:
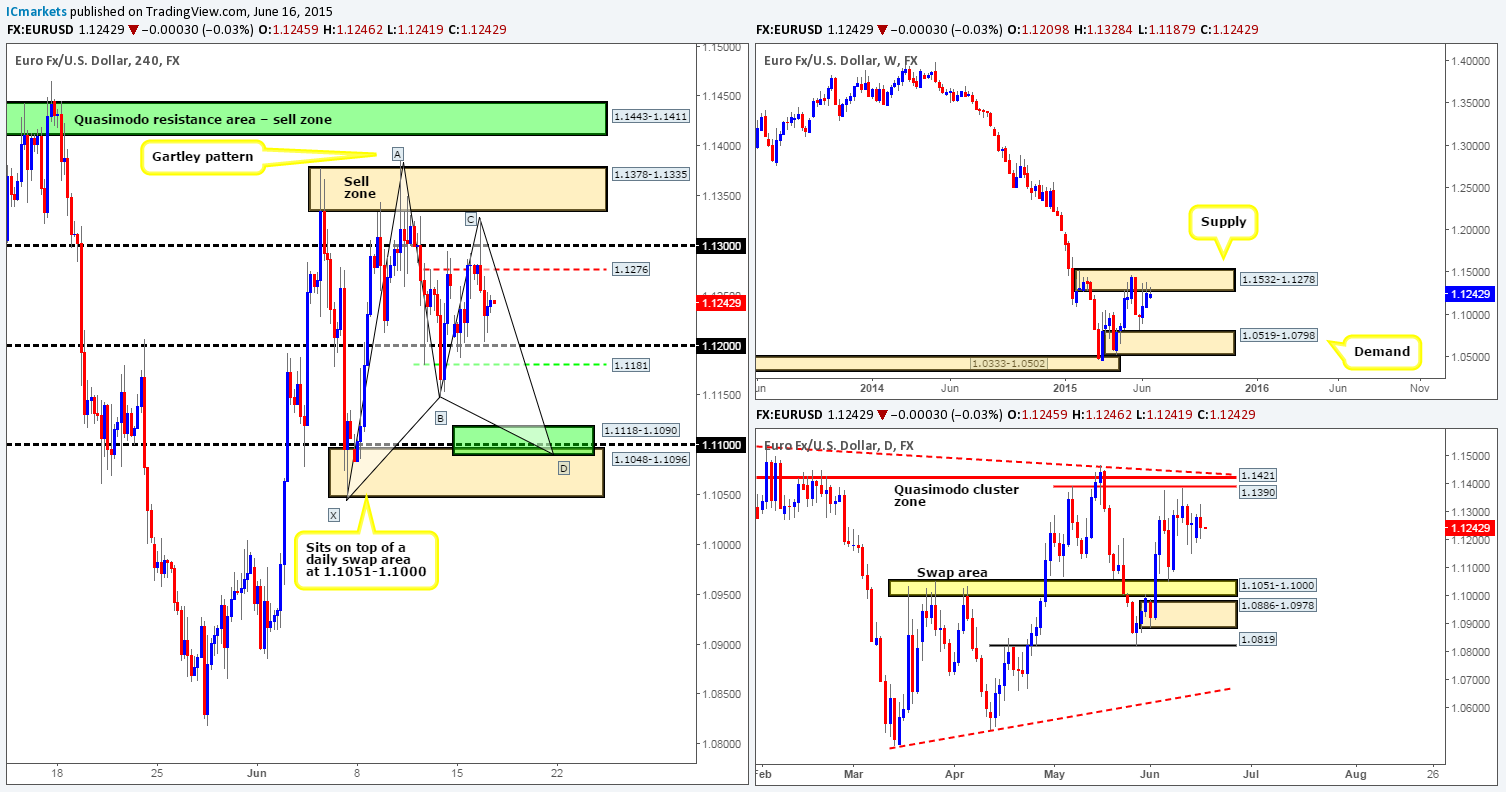
Weekly view: The weekly timeframe shows that price is currently nibbling at the underside of a weekly supply area coming in at 1.1532-1.1278.This supply zone is a very significant hurdle in our opinion (held price lower since the 11th May) since if there’s a sustained break above this area, our long-term bias (currently short) on this pair will very likely shift north.
Daily view: From this angle, however, we can see that price is trading in what we like to call a ‘mid-range phase’. Essentially, all this means is that the market is presently trading in no man’s land between a daily Quasimodo cluster zone at 1.1390/1.1421 (located relatively deep within the aforementioned weekly supply area) and a daily swap area seen in yellow at 1.1051-1.1000.
4hr view: For those who read our last report on the Euro, you may recall that we mentioned to watch price action between the 4hr Quasimodo resistance level in red at 1.1276 and the round number 1.1300. As you can see, a reversal was seen and price slipped back down towards the 1.1200 region, which has once again proven itself as support.
At current price 1.12429, we do not see any immediate opportunities to trade. However, we are still very interested in the 4hr Quasimodo support level in green at 1.1181, and also the 4hr Harmonic Gartley completion zone at 1.1118-1.1090 (sitting just above a 4hr demand area at 1.1048-1.1096). As far as we can see, both of these areas have ‘risk’ stamped on them, due to price trading at weekly supply (see above). Therefore, waiting for lower timeframe confirmation at these zones is a MUST since price could literally blow right through them!
With regards to shorts, our attention has now turned to the Quasimodo resistance base in green at 1.1443-1.1411 (encapsulates the aforementioned daily Quasimodo cluster zone), and the 4hr Quasimodo base sitting just below it at 1.1378-1.1335. These are the only two areas we would feel comfortable shorting this market right now. Having said that though, knowing which zone is the more reliable of the two is quite difficult, so to be safe, we would advise waiting to see how the lower timeframes react to the areas before making a decision whether to risk capital here or not.
Levels to watch/live orders:
- Buys: 1.1181 [Tentative – confirmation required] (Stop loss: dependent on where one confirms this level) 1.1118-1.1090 [Tentative – confirmation required] (Stop loss: dependent on where one confirms this area).
- Sells: 1.1378-1.1335 [Tentative – confirmation required] (Stop loss: dependent on where one confirms this area) 1.1443-1.1411 [Tentative – confirmation required] (Stop loss: dependent on where one confirms this area).
GBP/USD:
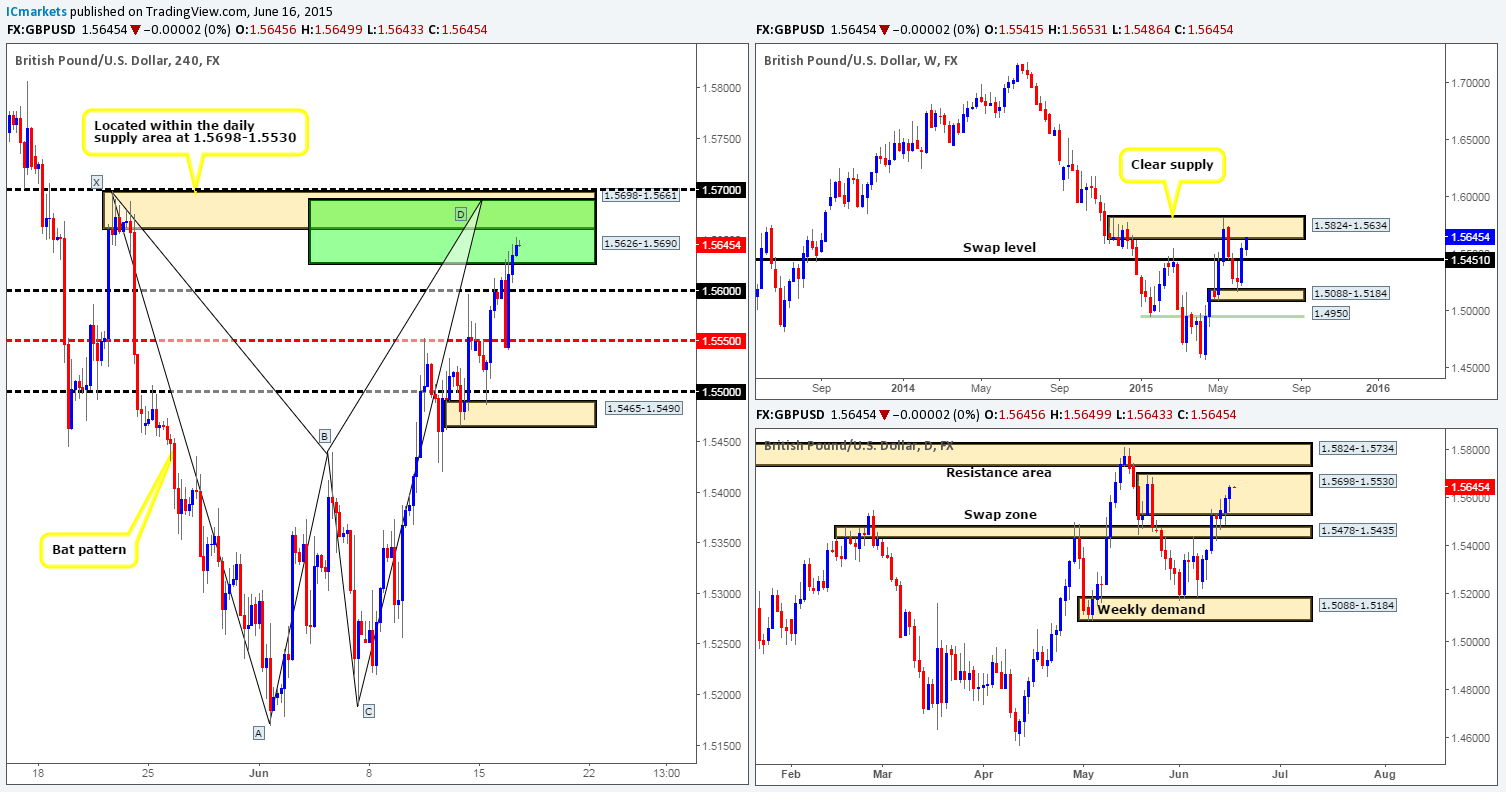
Weekly view – The weekly timeframe shows that the GBP has now connected with a weekly supply barrier coming in at 1.5824-1.5634.
Daily view: Following the rebound seen from the daily swap zone seen at 1.5478-1.5435, price extended higher during yesterday’s session. This move drove the pound deeper into a daily supply area at 1.5698-1.5530 (located just below the aforementioned weekly supply area). Should further buying take place here, the current daily supply zone will likely be taken out, and price will likely touch gloves with the daily resistance area directly above at 1.5824-1.5734 (located deep within the aforementioned weekly supply area).
4hr view: From this angle, we can see that price is now lingering within a 4hr Harmonic Bat reversal zone at 1.5626-1.5690, which, as you can see, coincides nicely with a very nice looking 4hr supply area at 1.5698-1.5661. Given that we’re also seeing the GBP within supply on both the weekly and daily timeframes (see above) at the moment, our objective today is simple. Watch for lower timeframe selling confirmation within the 4hr Harmonic completion zone. Should we find an entry here; the first trouble area so to speak will likely be around the 1.5600 handle.
Levels to watch/ live orders:
- Buys: Flat (Stop loss: N/A).
- Sells: 1.5626-1.5690 [Tentative – confirmation required] (Stop loss: dependent on where one confirms this area).
AUD/USD:
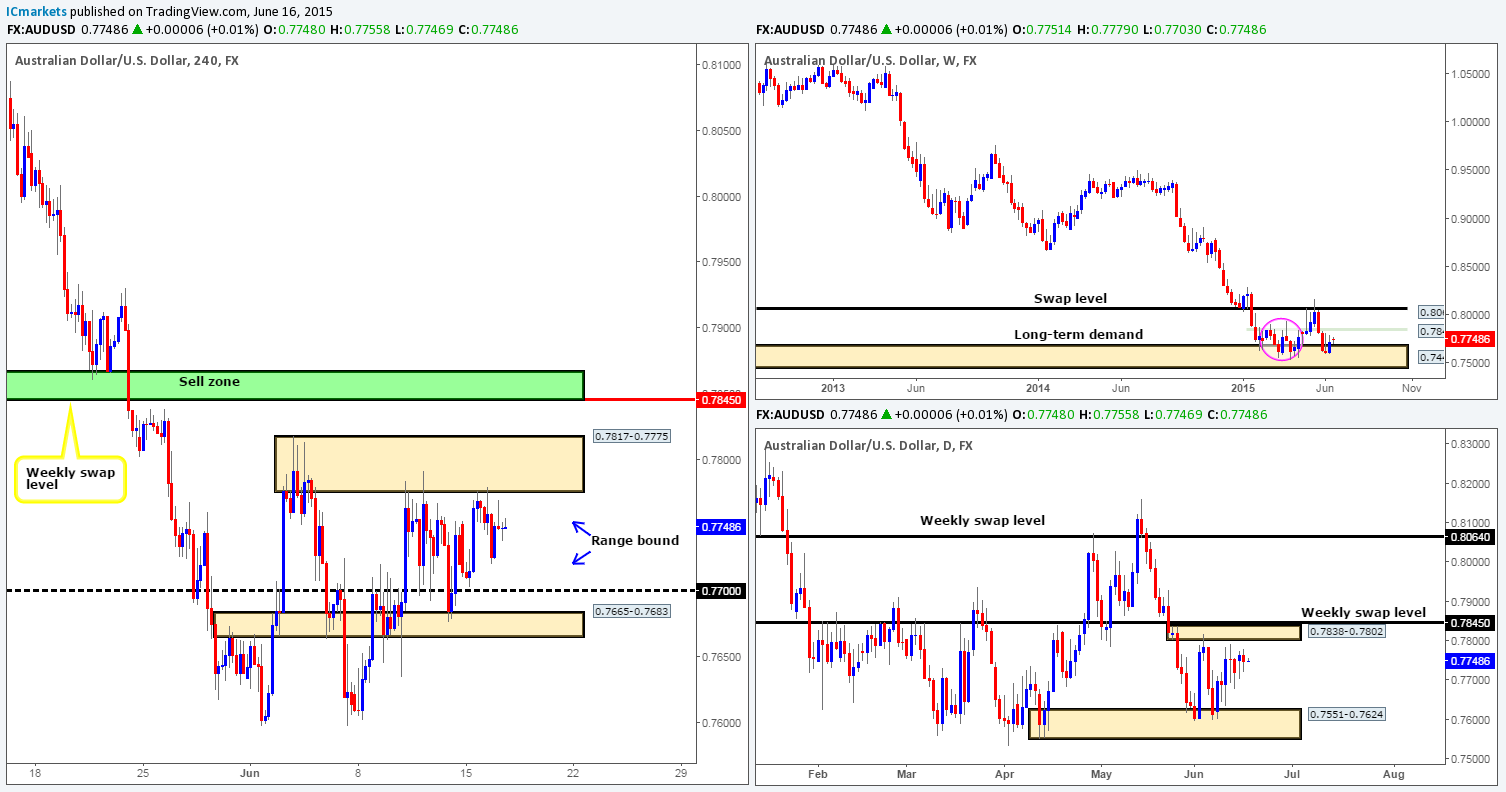
Weekly view – Last week saw buying interest come into the market from within the weekly demand area at 0.7449-0.7678. In the event that the buyers can continue with this intensity going into this week, we see very little stopping price from connecting with the minor weekly swap level at 0.7845. However, judging by the sloppy reaction seen (pink circle – 02/02/15-06/04/15) between these two aforementioned weekly areas a few months earlier, things could potentially get messy here again before we see any decisive move take place. From a long-term perspective, nonetheless, the trend direction on this pair is still very much south in our opinion, and will remain this way until we see a convincing break above 0.8064.
Daily view: From the pits of the daily scale, it appears that price has begun to chisel out a consolidation zone between a small daily supply area at 0.7838-0.7802 (positioned just below a minor weekly swap level at 0.7845), and a daily demand area coming in at 0.7551-0.7624. However, price is, as you can probably see, trading quite close to the upper limits of this range, so if you’re considering longs today, you may want to take note of this.
4hr view: The 4hr timeframe shows that the AUD/USD pair remains in a phase of consolidation on the 4hr timeframe between the 4hr supply area at 0.7817-0.7775, and a round number 0.7700. As a result, most of the following analysis will be the same as the previous.
Trading in between this 75-pip range is certainly a possibility today (potential buys: 0.7705 sells: 0.7770). Nonetheless, we would strongly advise only doing so once you see some sort of confirmation signal from the lower timeframes, since fakeouts are common within ranging environments such as this. Whether or not this market remains range bound for the entire week is very difficult to say. What we will say though is considering where price is located on the higher timeframe picture (we’re mainly referring to the weekly timeframe here) at the moment; we feel that the market will eventually break out north from this consolidation. This, as you can see on the 4hr timeframe, would likely force price to collide with the weekly swap level 0.7845 – a perfect sell zone (green area: 0.7867/0.7845). We firmly believe that this area will at the very least likely see a bounce, and in preparation for this, our team has placed a pending sell order just below this zone at 0.7842 with a stop set above at 0.7875.
Levels to watch/ live orders:
- Buys: 0.7705 [Tentative – confirmation required] (Stop loss: 0.7656).
- Sells: 0.7770 [Tentative – confirmation required] (Stop loss: 0.7821) 0.7842 (Stop loss: 0.7875).
USD/JPY:
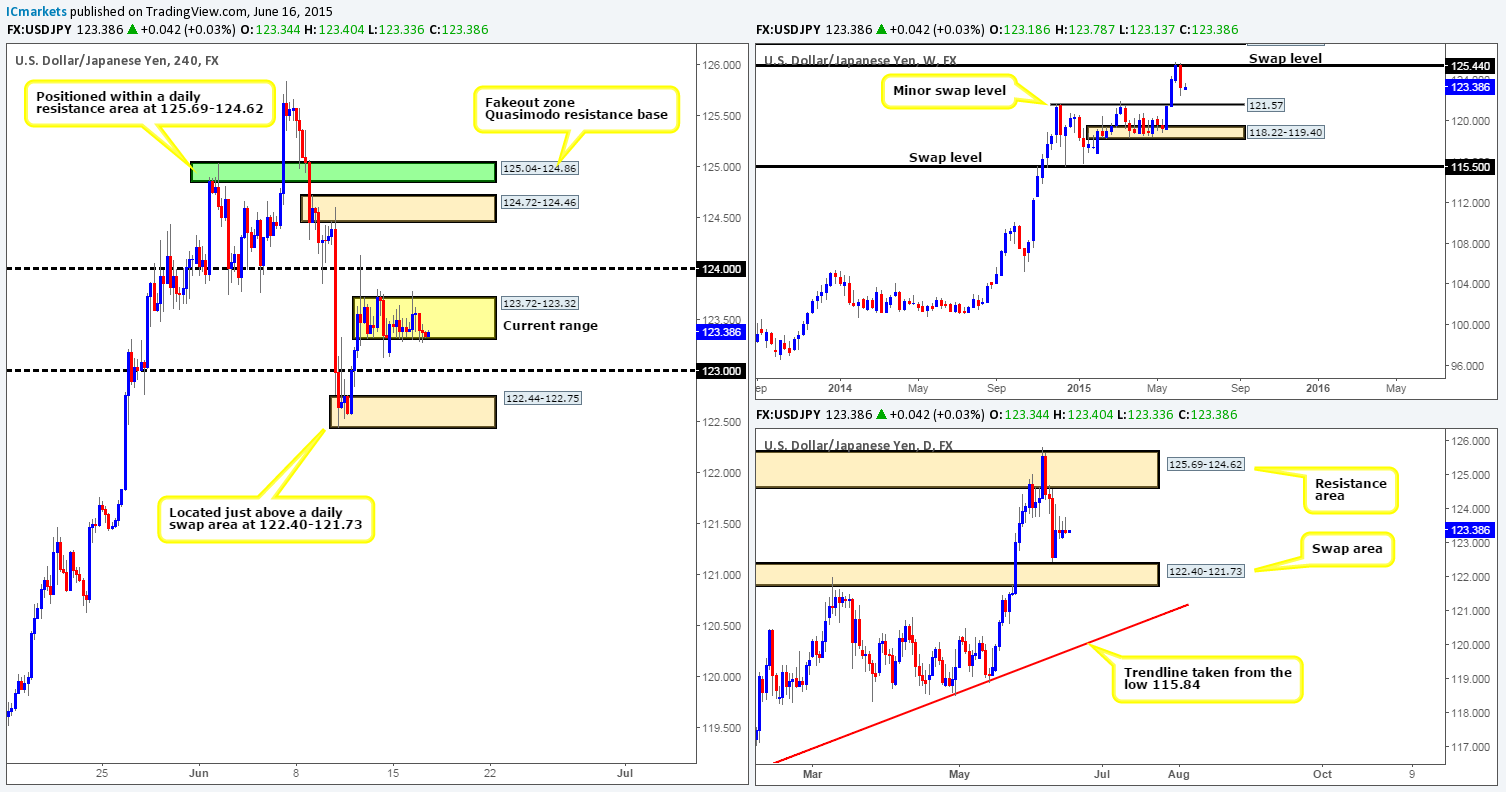
Weekly view – Last week’s activity saw the USD/JPY sell off from a weekly swap level at 125.44, consequently wiping out any gains accumulated the week before last. On the assumption that the sellers can continue with this tempo coming into this week, we believe there’s a very good chance that price will greet the minor weekly swap level seen at 121.57. Despite this recent decline in value, however, the long-term uptrend on this pair is still very much intact, and will remain that way in our opinion until the weekly swap level 115.50 is consumed.
Daily view: The daily timeframe on the other hand, shows that buying interest came into the market last Thursday from a just above a long-term daily swap area at 122.40-121.73. This barrier, as you can probably see, remains a key obstacle to a move towards the aforementioned minor weekly swap level sitting just below it.
4hr view: Price action on the 4hr timeframe has entered into a phase of consolidation between 123.72/123.32, which is a little too small for us to trade. Due to this somewhat mild action being seen on the USD/JPY, most of the following analysis will be similar to the previous.
Considering the market’s overall position on the higher timeframes at the moment (mixed signals – see above in bold), we’re finding it difficult to judge direction. Therefore, until we see more conducive higher timeframe action, the best thing we believe we can do today and possibly into the week is watch the following levels of interest for lower timeframe confirming price action, and trade them accordingly:
Buy zones we have on our watch list are as follows:
- The round number 123.00.
- The 4hr demand area at 122.44-122.75 (located just above the aforementioned daily swap area).
Sell zones we have on our watch list are as follows:
- The round number 124.00.
- The 4hr supply area coming in at 124.72-124.46 (located just below the daily resistance area at 125.69-124.62). Something to note regarding this 4hr supply zone is the 4hr Quasimodo resistance base seen just above it. Keep a close eye on this area as fakeouts above supply (in this case) into obvious Quasimodo base areas are very common.
Levels to watch/ live orders:
- Buys: 123.00 [Tentative – confirmation required] (Stop loss: dependent on where one confirms this level) 122.44-122.75 [Tentative – confirmation required] (Stop loss: 122.38).
- Sells: 124.00 [Tentative – confirmation required] (Stop loss: dependent on where one confirms this level) 124.72-124.46 [Tentative – confirmation required] (Stop loss: 125.08).
USD/CAD:
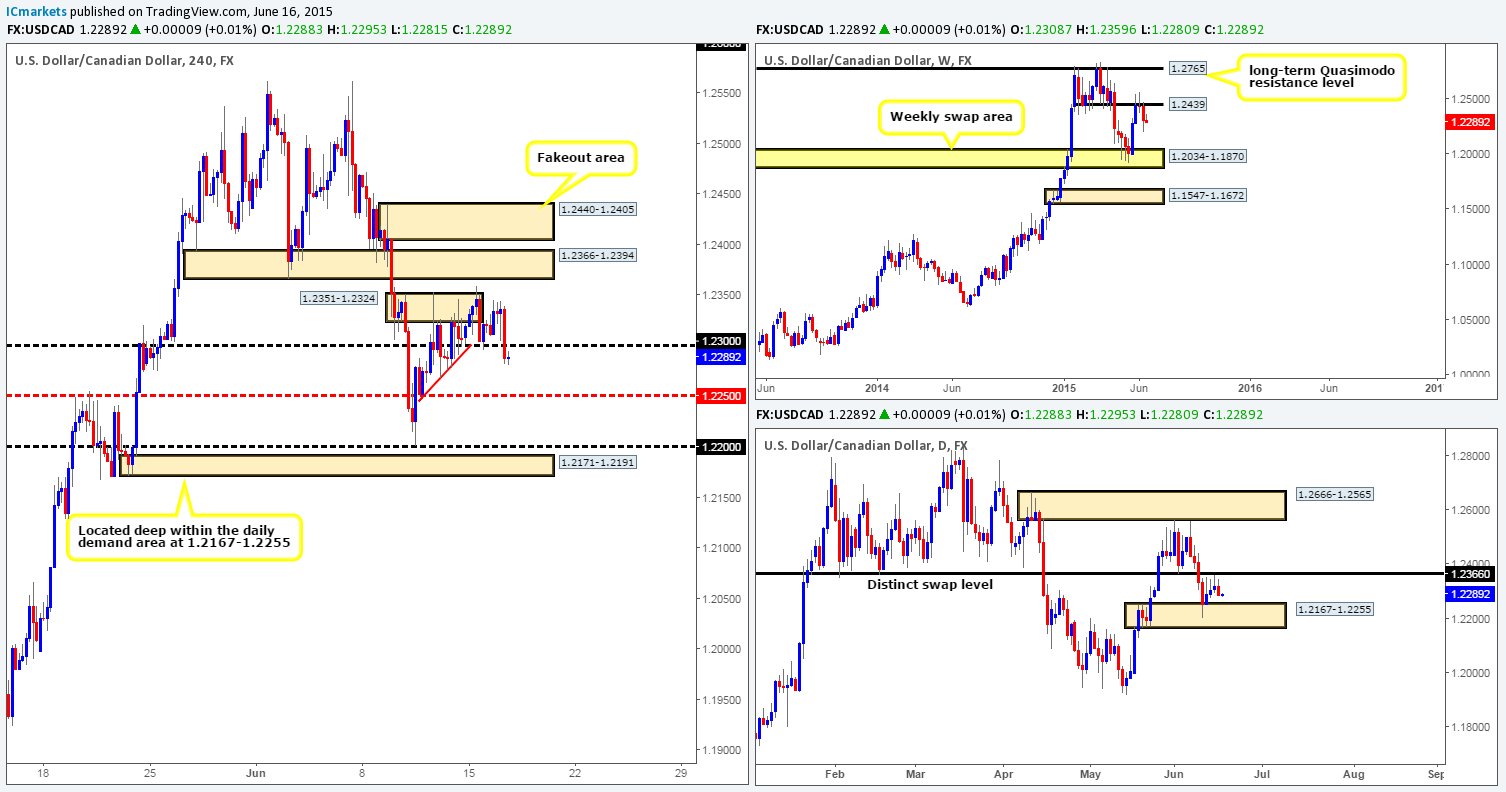
Weekly view – During last week’s trading, price sold off from a weekly swap level coming in at 1.2439. Provided that the sellers can continue with this tempo, we feel that there is a good chance that price will connect with the weekly swap area seen in yellow at 1.2034-1.1870. Despite the fact that this market is now in the red so to speak, our long-term bias on this pair remains long, and it will only be once/if we see a break below the aforementioned weekly swap area would our present bias likely shift.
Daily view: The daily timeframe on the other hand, shows that buyers begun defending a daily demand barrier at 1.2167-1.2255 from Thursday onwards last week. Nonetheless, until we see a clean break above the near-term daily swap level seen at 1.2366, it is difficult for us to be bullish on this pair.
4hr view: During the course of yesterday’s sessions, the buyers managed to hold price above 1.2300 through both Asia and London. However, mid-way through the US session we saw the market spiral south. This move, as you can see, forced price below 1.2300, which in turn will likely attract further selling towards at least the mid-level number 1.2250 sometime today. To take advantage of this move, one could either sell now, effectively shorting the breakout, or, if you’re conservative like us, wait to see if price retests the 1.2300 number as resistance and sell with lower timeframe confirmation.
Why we feel this market is going to fall simply comes from the following:
- Little to no support on the higher timeframe structure until around the 1.2250 mid-level mark (see above).
- Very little active demand in the market directly to the left of current price – check out the demand consumption tails at: 1.2291/1.2276/1.2268 (red trendline). This was likely the work of pro money. These buying tails were likely used to collect unfilled buy orders in order to continue rallying higher before, thus once price returns to this region, it is likely going to have very little buy-side liquidity left in the market to stop price from falling lower.
Levels to watch/ live orders:
- Buys: Flat (Stop loss: N/A).
- Sells: 1.2300 [Tentative – confirmation required] (Stop loss: Dependent on where one confirms this level).
USD/CHF:
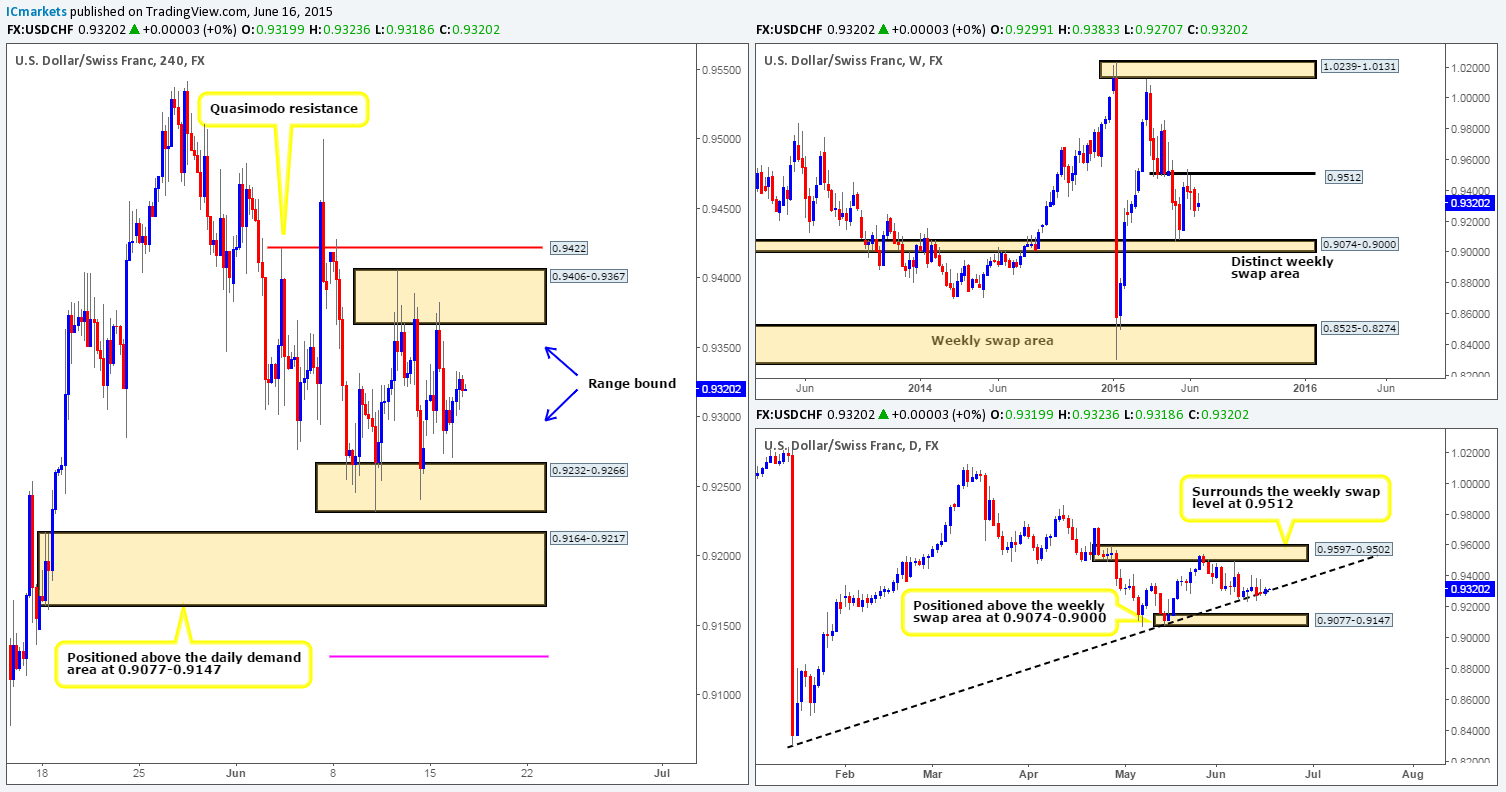
Weekly view – Following the rebound seen from the weekly swap level at 0.9512, price continued to extend lower last week. In the event that the buy-side liquidity remains weak in this market, it is likely we’ll see price shake hands with the weekly swap area seen below at 0.9074-0.9000 sometime this week.
Daily view: From this angle, we can see that the buyers continue to struggle to hold out above the daily trendline extended from the low 0.8299. Should a close below this limit be seen, this would likely attract further selling down towards the daily demand area at 0.9077-0.9147 (located just above the aforementioned weekly swap area).
4hr view: (Similar to the previous analysis) Price action on the 4hr timeframe, as you can see, continues to trade within its current range between 0.9406-0.9367 and 0.9232-0.9266. Taking trades within this 4hr consolidation area is certainly a viable plan in our opinion (potential buys: 0.9270 sells: 0.9365). Nonetheless, we would strongly advise only trading these limits once you have seen some sort of confirmation signal from the lower timeframes, since fakeouts are common within ranging environments such as this. Areas to watch if a fakeout does take place are the 4hr Quasimodo resistance level in red at 0.9422, and a 4hr demand at 0.9164-0.9217 (located just above the aforementioned daily demand area). Be sure to have these zones on your watchlists guys as there could be potential trading opportunities here!
Levels to watch/ live orders:
- Buys: 0.9270 [Tentative – confirmation required) (Stop loss: 0.9226).
- Sells: 0.9365 [Tentative – confirmation required] (Stop loss: 0.9410).
US 30:
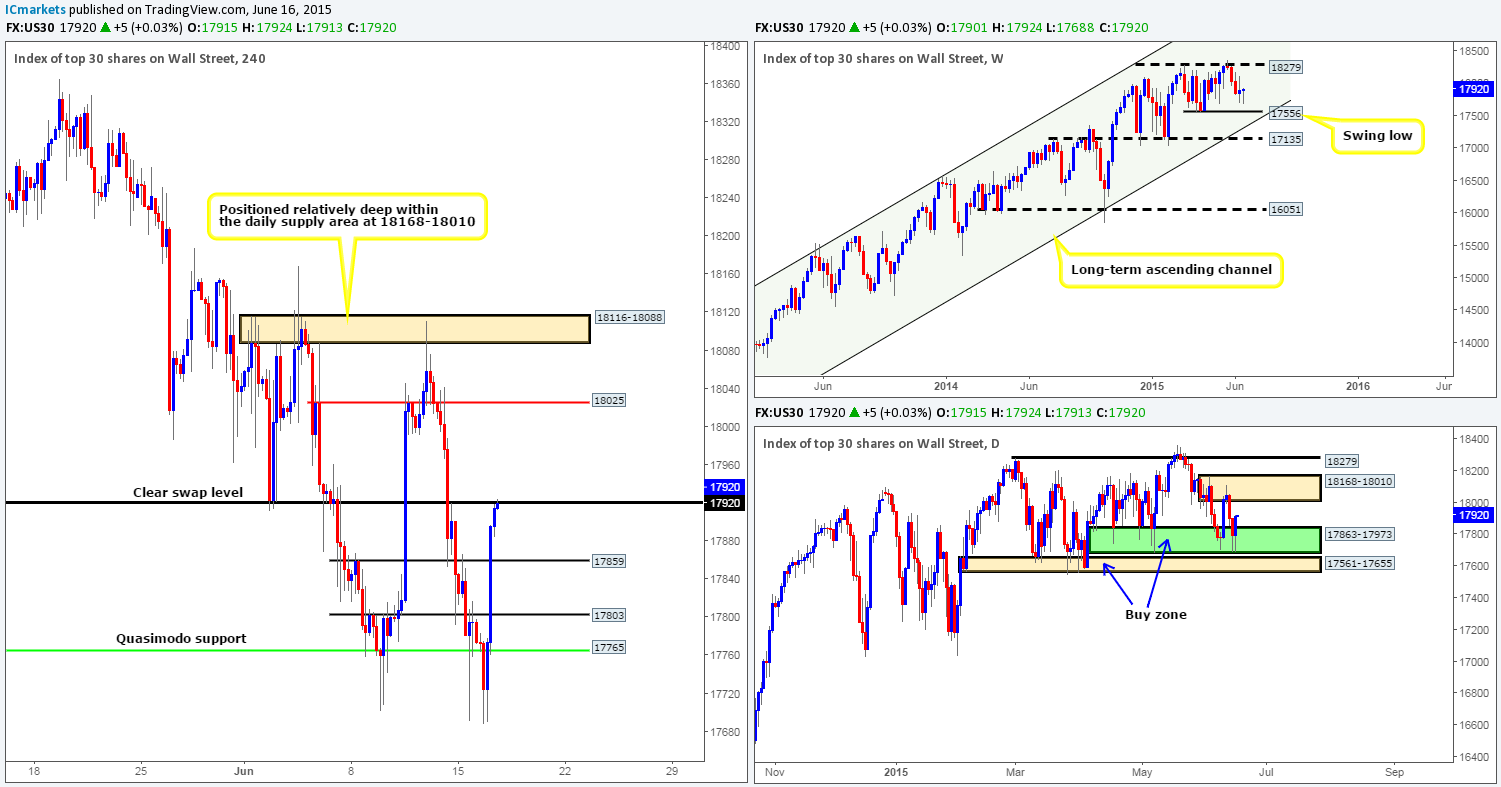
Weekly view – Following the two-week sell off from 18279, the buyers finally made an appearance last week around the 17703 mark, consequently printing a poorly formed weekly indecision candle. At the time of writing though, it is very difficult to say which way the market may head this week. It could rally back up to test 18279, or it could just as well continue south down towards the weekly swing low 17556. From a longer-term perspective, however, the overall uptrend on this index is still very strong, and will remain this way in our opinion until we see a convincing push below 16051.
Daily view: From this angle, we can see that strong buying interest came into the market from a daily buy zone seen in green at 17863-17973 during yesterday’s session. Provided that the buyers can continue with this tempo going into today’s session, it is likely we’ll witness price rally back up to shake hands with the daily supply area at 18168-18010 again.
4hr view: The 4hr timeframe shows that the recent buying begun mid-way through the London session, which consequently jabbed price into a 4hr swap level coming in at 17920. Above and below this number is space for price to move in our opinion, and because of this 17920 will play a key role in our decision making process today.
If we see price close above 17920, this would likely stimulate an advance towards the 18025 region (positioned just within the aforementioned daily supply area). Despite this, we would only be interested in trading this move if 17920 was retested as support and showed some sort of lower timeframe buying signal.
On the flip side, however, should 17920 hold as resistance, our team would be cautious selling here (even with lower timeframe confirmation) due to the following:
- Relatively near-term 4hr support sitting at 17859. Of course, there is still room to profit, but it is not even close to the profit potential that exists above 17920.
- Recent buying interest seen from daily buy zone at 17863-17973.
- Little direction being seen on the weekly timeframe, other than the fact we know price is in an overall uptrend.
Levels to watch/ live orders:
- Buys: Flat (Stop loss: N/A).
- Sells: 17920 [Tentative – confirmation required] (Stop loss: dependent on where one confirms this level).
XAU/USD (Gold)
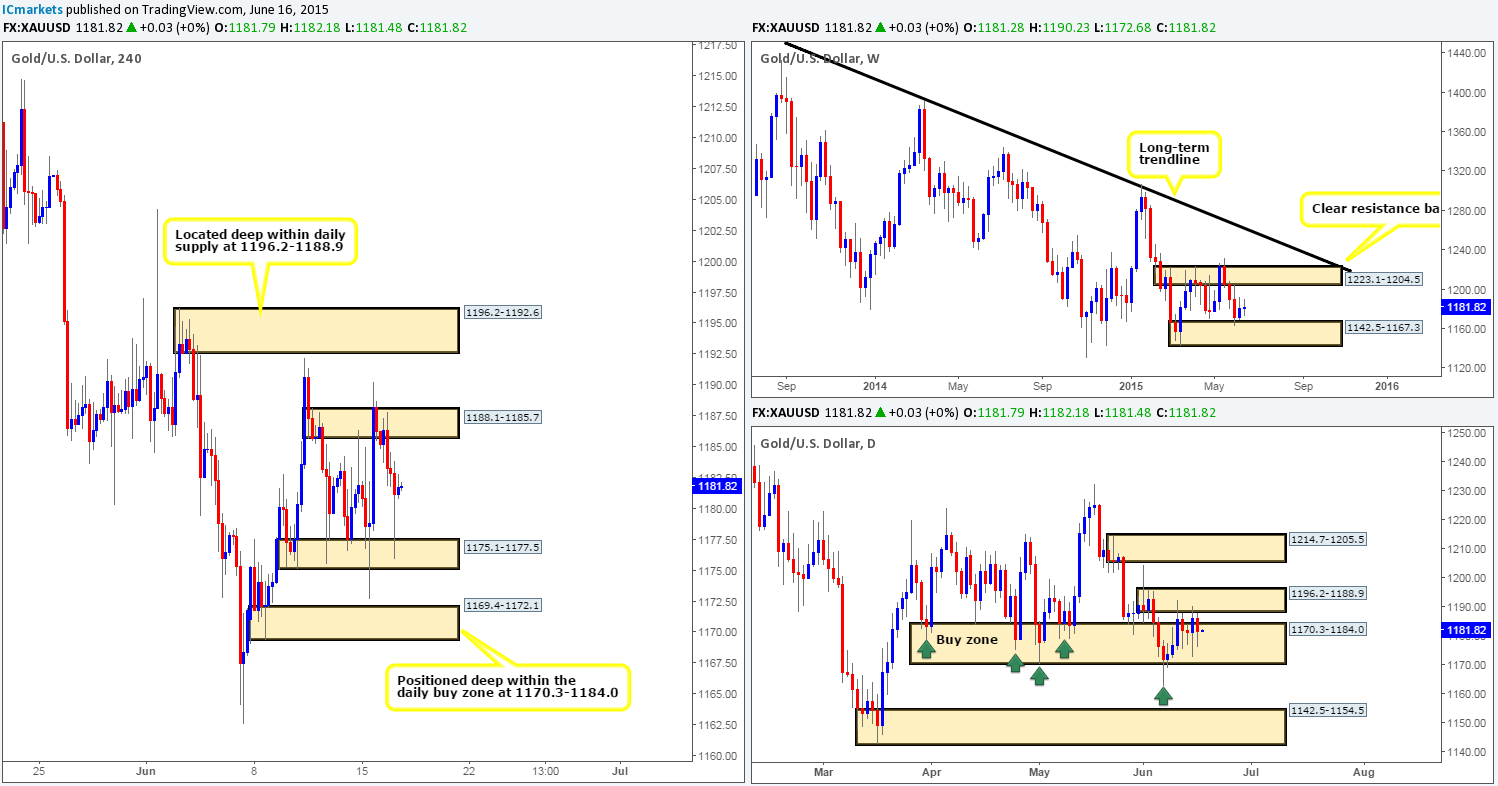
Weekly view – Following last week’s rebound from the weekly demand area sitting at 1142.5-1167.3, the buyers have so far been able to hold this market higher. If strength continues to be shown here, we may see further upside potentially pushing gold back up to the weekly supply area seen at 1223.1-1204.5. From a long-term perspective, however, gold is still trending south in our opinion, and It will only be once/if we see a close above the weekly trendline extended from the high 1488.0 would we begin to feel that this market may be reversing.
Daily view: For the past week and a half the buyers and sellers have been seen battling for position between two compact daily areas – a daily buy zone at 1170.3-1184.0, and a small daily supply area at 1196.2-1188.9. Should we see a break below the aforementioned daily buy zone this week, the next objective to reach will likely be the daily demand area coming in at 1142.5-1154.5 (located deep within the aforementioned weekly demand area). On the other hand, if a break above the aforementioned daily supply area takes place (most likely to happen considering the position of price on the weekly timeframe – see above), the path north will likely be free up to a daily supply area seen at 1214.7-1205.5 (located within the aforementioned weekly supply area).
4hr view: For those who read our previous report on gold, you may recall us mentioning to be prepared for the possibility that price may sell off following the breach of 4hr supply at 1188.1-1185.7. After a little hesitation, we did eventually see this market drop back down to the 4hr demand area at 1175.1-1177.5, which as you can see, was clearly strong enough provoke a counter-attack back up to the 1181.82 region forcing this market into a clear phase of consolidation.
1181.82 is considered mid-range to us, and as such we would have no interest in trading at current prices. Therefore, the best thing we believe we can do today is closely monitor the following levels of interest for lower timeframe confirming price action, and trade them accordingly:
Buy zones we have on our watch list are as follows:
- The 4hr demand area at 1175.1-1177.5.
- The 4hr demand area at 1169.4-1172.1 (located deep within the aforementioned daily buy zone).
Sell zones we have on our watch list are as follows:
- The 4hr supply area at 1188.1-1185.7.
- The 4hr supply area at 1196.2-1192.6 (located deep within the daily supply area mentioned above at 1196.2-1188.9).
Levels to watch/ live orders:
- Buys: 1175.1-1177.5 [Tentative – confirmation required] (Stop loss: 1174.7) 1169.4-1172.1 [Tentative – confirmation required] (Stop loss: 1168.9).
- Sells: 1188.1-1185.7 [Tentative – confirmation required] (Stop loss: 1188.4) 1196.2-1192.6 [Tentative – confirmation required] (Stop loss: 1196.5).


