A note on lower timeframe confirming price action…
Waiting for lower timeframe confirmation is our main tool to confirm strength within higher timeframe zones, and has really been the key to our trading success. It takes a little time to understand the subtle nuances, however, as each trade is never the same, but once you master the rhythm so to speak, you will be saved from countless unnecessary losing trades. The following is a list of what we look for:
- A break/retest of supply or demand dependent on which way you’re trading.
- A trendline break/retest.
- Buying/selling tails/wicks – essentially we look for a cluster of very obvious spikes off of lower timeframe support and resistance levels within the higher timeframe zone.
- Candlestick patterns. We tend to stick with pin bars and engulfing bars as these have proven to be the most effective.
We search for lower timeframe confirmation between the M15 and H1 timeframes, since most of our higher-timeframe areas begin with the H4. Stops are usually placed 5-10 pips beyond confirming structures.
EUR/USD:
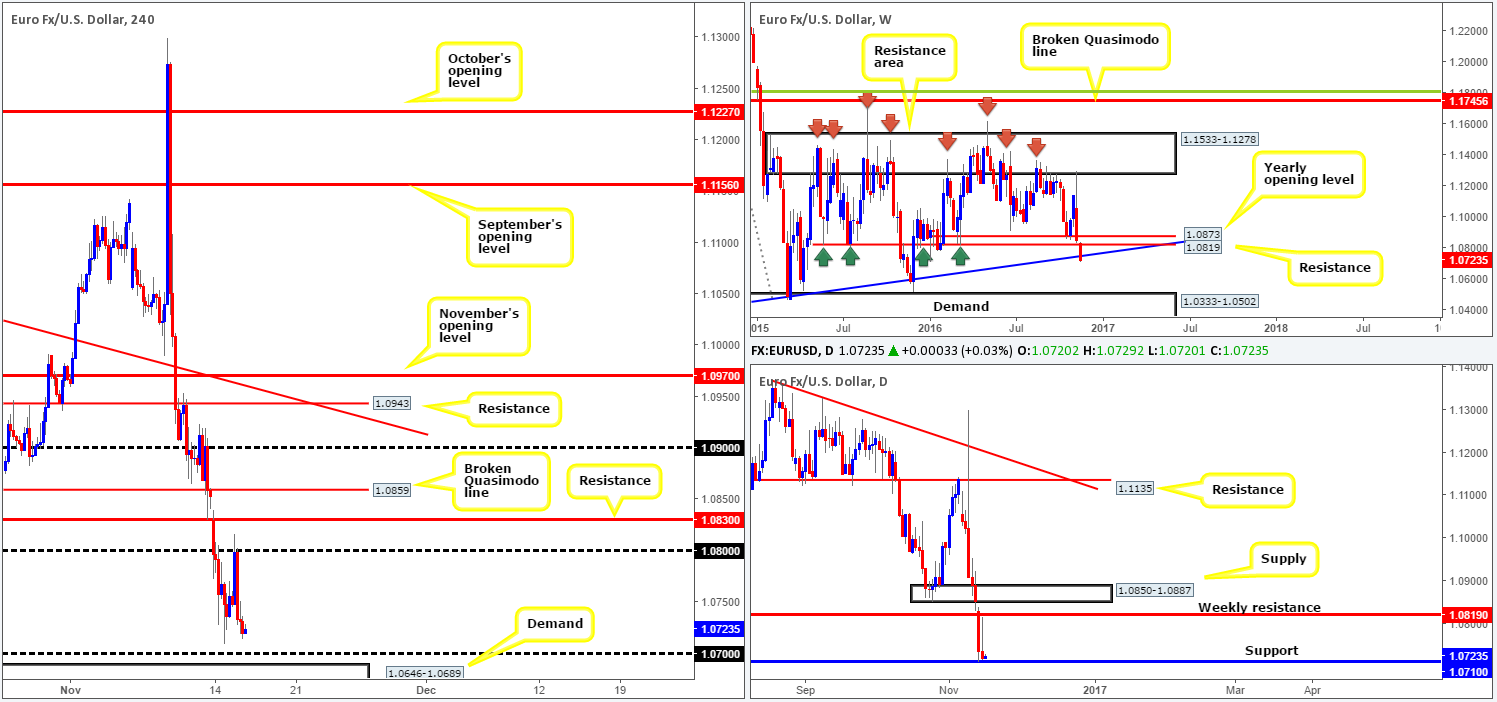
Going into yesterday’s London segment, the pair firmly rejected the 1.08 number as resistance, and was later reinforced by better than expected US retail sales data at 1.30pm GMT. By the close, however, prices settled just ahead of Monday’s lows, and more importantly, just ahead of the 1.07 handle. By and large, the EUR is little changed this morning. Therefore, Monday’s outlook, in our view, remains valid.
Although weekly action is seen trading slightly beyond the trendline support drawn from the low 0.8231 this morning, it’s far too early to discount this barrier as a viable structure. In addition to this, the daily candles are also currently seen flirting with a support level penciled in at 1.0710. The last time this barrier was visited was at the beginning of the year, and the response from here managed to propel the EUR over 900 pips north! So it’s definitely not a level one wants to overlook!
Our suggestions: Buying at current prices is tempting given the daily support and weekly trendline. Still, our desk has no interest in buying right now. Instead, what we’re looking to do is trade the potential fakeout through 1.07 (psychological handles are typically prone to fakeouts). A nice-looking H4 buying tail that extends through 1.07 into the 1.0646-1.0689 area, a small hidden H4 demand (seen clearer on the H1), would be an acceptable confirming signal to jump in long this market, targeting the 1.08 handle.
Data points to consider: US PPI data at 1.30pm along with FOMC member Bullard speaking at 9am GMT.
Levels to watch/live orders:
- Buys: 1.07 region ([watch for a H4 buying tail to form prior to pulling the trigger] stop loss: either beyond the demand at 1.0643 or beyond the H4 buying tail).
- Sells: Flat (stop loss: N/A).
GBP/USD:
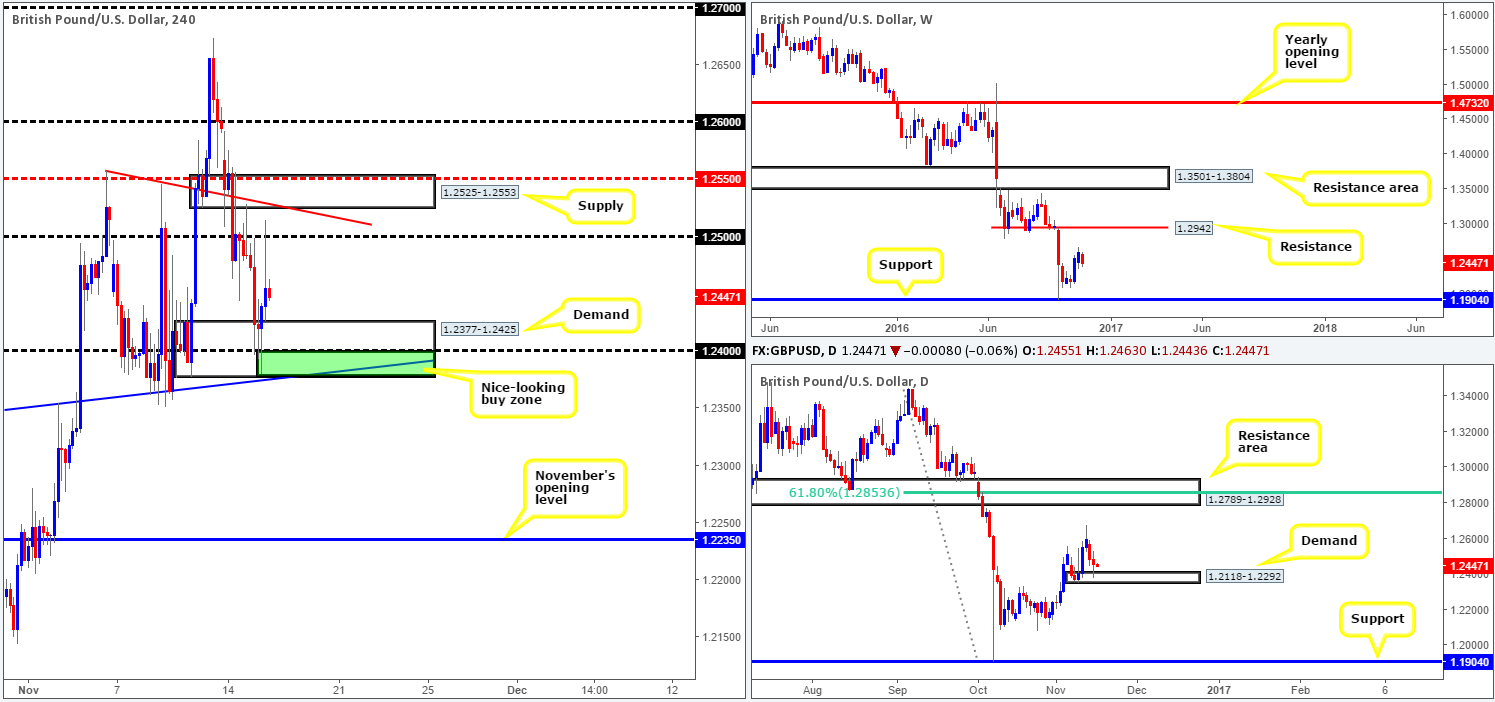
Opening with a look at the weekly timeframe this morning, we can see that the pair is currently trading mid-range between resistance penciled in at 1.2942 and support carved from 1.1904. Turning our attention to the daily chart, nonetheless, yesterday’s session spiked a demand base formed at 1.2118-1.2292. Could this area be firm enough to propel the unit higher, and maybe even make a run for the 11th Nov high 1.2673?
Moving over to the H4 candles, price beautifully whipsawed through the 1.25 handle and shook hands with supply coming in at 1.2525-1.2553 in early trading. The sellers went on to gain further traction as London opened its doors for business, followed shortly by a disappointing UK inflation print an hour later.
What was interesting here though was the H4 candles caught a bid from our pre-determined H4 buy zone at 1.2377/1.24 as US traders entered the fray. The green zone comprises of a trendline support stretched from the high 1.2332, a psychological handle at 1.24 and the lower edge of a H4 demand base chalked in at 1.2377. Well done to any of our readers who managed to pin down a position from here!
Our suggestions: At current price, we see very little to hang our hat on from a technical perspective. Of course, one could look to trade the aforementioned H4 buy zone once more, or even look to short from the above noted H4 supply, given it fuses with H4 trendline resistance drawn from the high 1.2557. Personally, we would take the former here in that it sits on top of the aforementioned daily demand!
Data points to consider: UK employment data at 9.30am, MPC member Cunliffe speaks at 2pm, US PPI data at 1.30pm along with FOMC member Bullard speaking at 9am GMT.
Levels to watch/live orders:
- Buys: Flat (stop loss: N/A).
- Sells: Flat (stop loss: N/A).
AUD/USD:
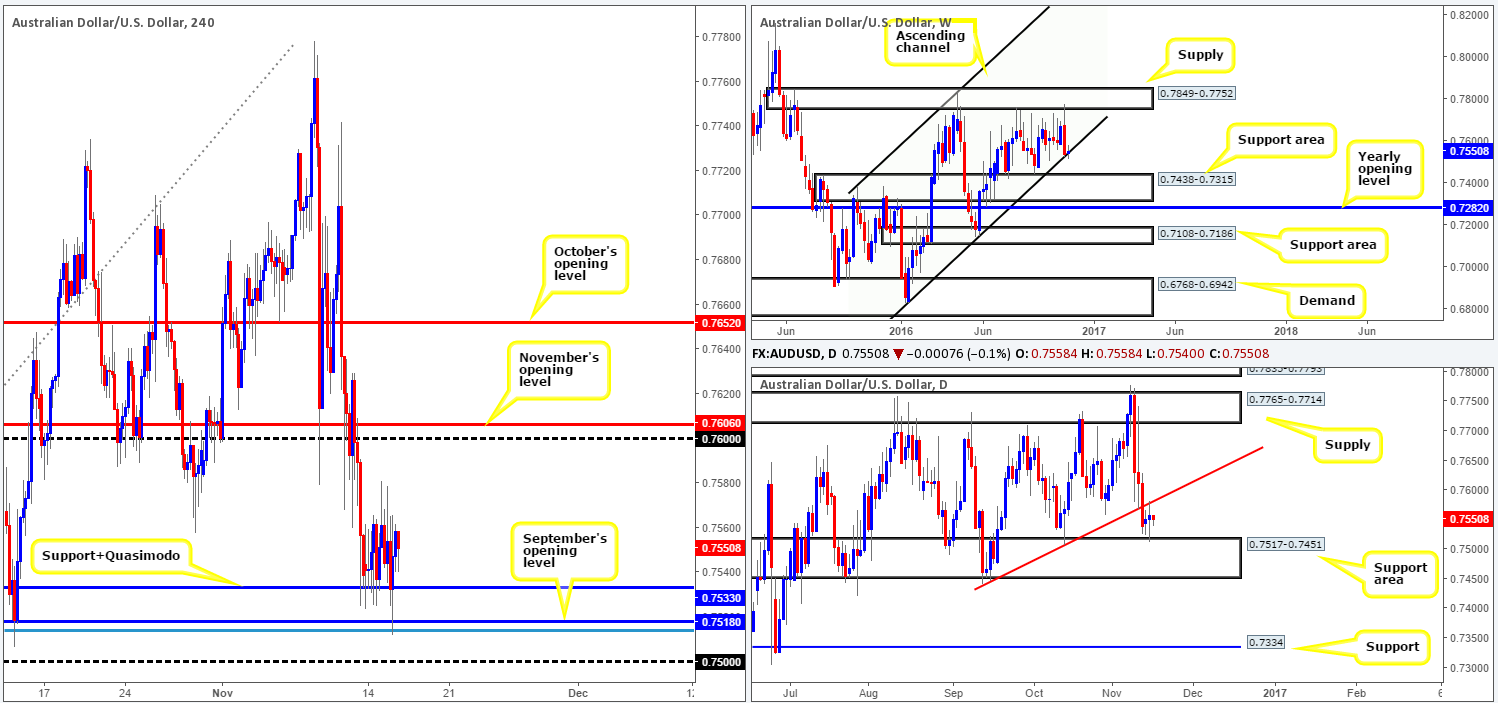
The commodity currency closed marginally higher against its US counterpart yesterday, following a near-to-the-pip strike of September’s opening level at 0.7518 (supported by a H4 78.6% Fib support at 0.7513). Well done to any of our readers who managed to lock in some green pips from this move, as it was, along with the 0.75 handle, a noted level to keep an eye on for longs.
While there is a possibility that further upside could transpire this morning, given that the weekly candles are currently toying with a channel support line taken from the low 0.6827, one has to take into account where price is positioned on the daily chart! The daily trendline resistance extended from the low 0.7442, which held prices lower yesterday, could potentially throw a spanner in the works, so to speak.
Our suggestions: To confidently become buyers at current price, we would need to see the aforementioned daily trendline resistance taken out. We hold the opinion that should a daily close take shape beyond this line, the runway north will likely be clear up to daily supply coming in at 0.7765-0.7714, which happens to be glued to the underside of a weekly supply at 0.7849-0.7752 (the next upside target on the weekly timeframe).
Selling this market on the other hand, is out of the question for us. Not only would you be shorting into a weekly channel support and daily support area, but you’d also be selling into a H4 support/Quasimodo level at 0.7533, followed by the above noted September opening barrier.
Data points to consider: US PPI data at 1.30pm along with FOMC member Bullard speaking at 9am GMT.
Levels to watch/live orders:
- Buys: Flat (stop loss: N/A).
- Sells: Flat (stop loss: N/A).
USD/JPY:
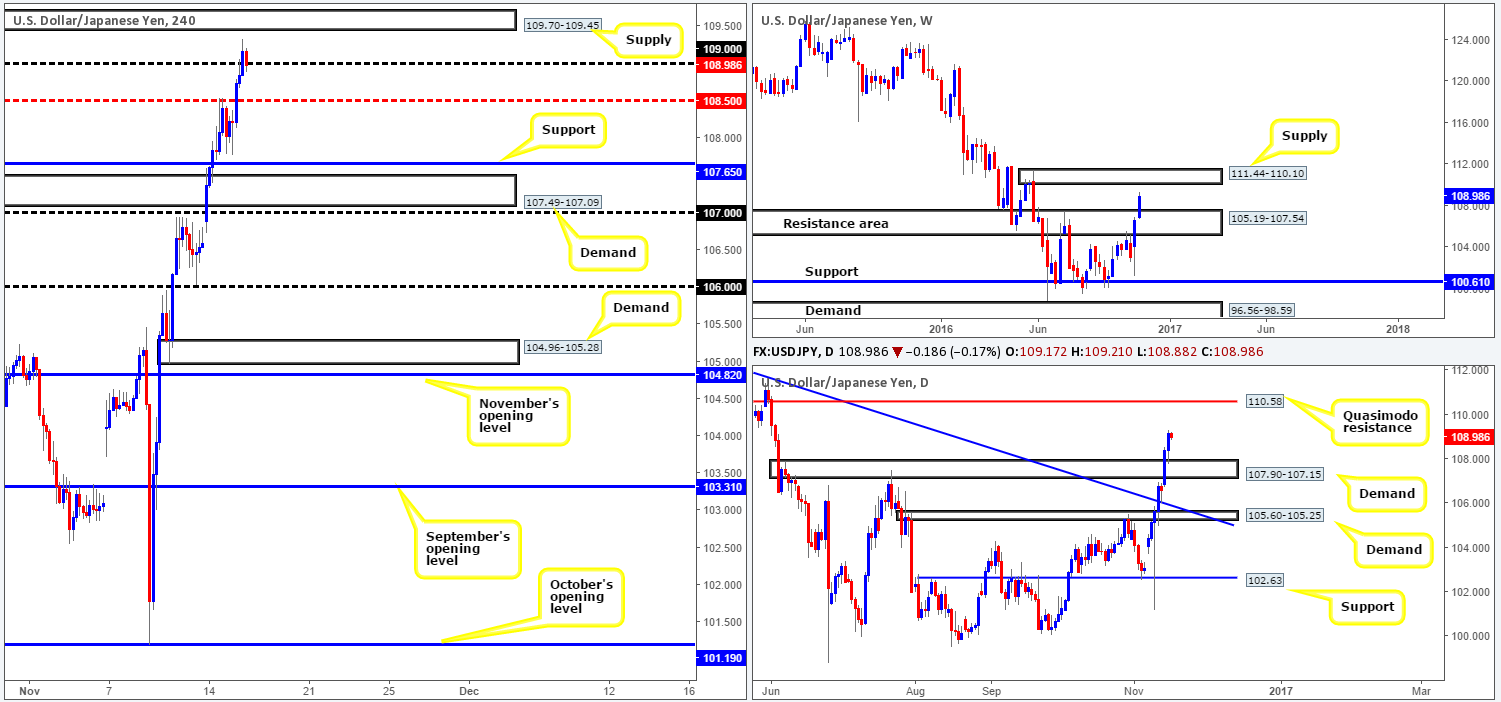
The USD/JPY, once again, closed higher against the yen yesterday, aided by a better than expected US retail sales reading. The move, as you can see, took out both the H4 mid-way resistance at 108.50 and eventually the 109 handle. What the recent bullish assault also accomplished was firmly pushing price above the current weekly resistance area at 105.19-107.54, and placing the current weekly candle within striking distance of a weekly supply drawn from 111.44-110.10. Not only this, but we also saw yesterday’s daily candle retest the top edge of the recently broken supply at 107.90-107.15 as demand. In light of this, traders now likely have their crosshairs on the daily Quasimodo resistance at 110.58 (housed within the above said weekly supply zone) as this is, in our opinion, a reasonable upside target.
Our suggestions: Although both the weekly and daily charts show the path north to be relatively clear until we reach the underside of weekly supply at 110.10, buying, according to the H4 chart, is challenging. This is due to the minor H4 supply sitting directly above 1.09 at 109.70-109.45.
Be that as it may, considering that this area is minor and the higher timeframes advocate further upside, we may still consider looking to buy on a firm retest of 109 today, targeting the 110 handle (essentially marking the underside of the aforementioned weekly supply). We know this trade is a little risky given the aforementioned H4 supply lurking just ahead. However, we feel we have enough confirmation from the higher timeframes to justify a buy from 109.
Data points to consider: US PPI data at 1.30pm along with FOMC member Bullard speaking at 9am GMT.
Levels to watch/live orders:
- Buys: 109 region ([all that we require here is to see 109 respected as support before looking to trade long] stop loss: ideally 10 or so pips beyond 109).
- Sells: Flat (stop loss: N/A).
USD/CAD:
Thanks to a healthy round of buying over in the oil market yesterday, the USD/CAD fell sharply, largely ignoring the better than expected US retail sales reading, and ending the day just ahead of November’s opening level at 1.3419. November’s opening level is interesting. Not only is the number bolstered by a H4 50.0% Fib support at 1.3425, but it is also positioned directly above a daily support at 1.3414, the 1.34 handle, a H4 61.8% Fib support at 1.3387 and a nearby weekly support coming in from 1.3381.
Our suggestions: In view of the collective supports noted above, our desk feels this area (1.3381/1.3425) will very likely hold the market higher today, especially considering that oil is now currently seen trading from a H4 resistance at 45.72.
Seeing as how the above noted buy zone is reasonably large, waiting for a H4 bullish candle to form within the walls of this area is, at least in our book, the more logical route to take. Unless, of course, you’re trading plan allows for large stop losses.
Data points to consider: CAD manufacturing sales at 1.30pm, US PPI data at 1.30pm along with FOMC member Bullard speaking at 9am GMT.

Levels to watch/live orders:
- Buys: 1.3381/1.3425 ([reasonably sized H4 bullish close required prior to pulling the trigger] stop loss: ideally beyond the trigger candle).
- Sells: Flat (stop loss: N/A).
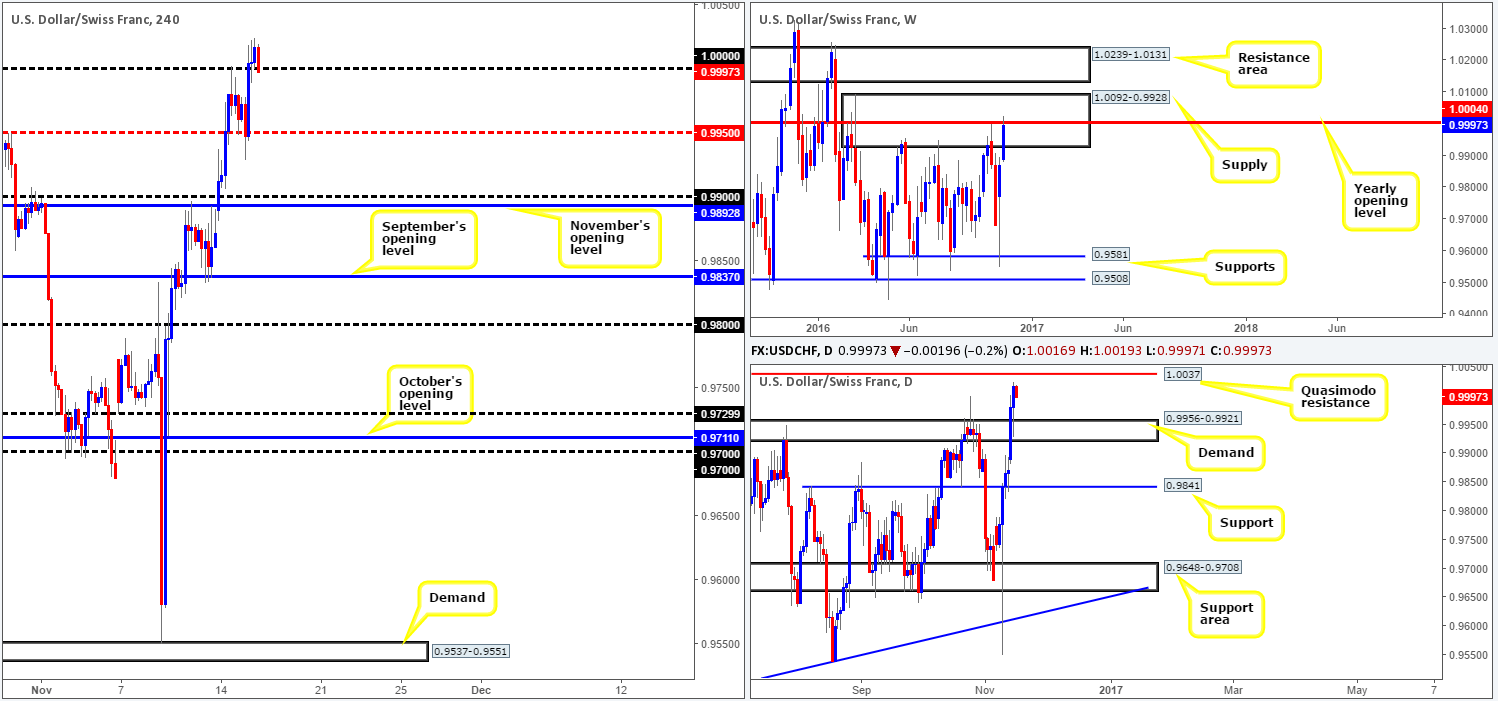
USD/CHF:
Strengthened by upbeat US retail sales data, the USD/CHF broke through parity yesterday and managed to clock highs of 1.0024 on the day. Leaving the daily Quasimodo resistance level at 1.0037 unchallenged, the pair has, at the time of writing, begun to selloff, consequently retesting parity as support. On the daily chart, there’s scope for the unit to continue trading south until we reach demand coming in at 0.9956-0.9921.
Now, just because parity is in play right now, it does not necessarily mean that buyers will come into the market. This becomes even more plausible as we check out the weekly chart. Current action reveals price recently crossed swords with the yearly opening level at 1.0004, which happens to be positioned within a major supply zone drawn from 1.0092-0.9928. Therefore, there is a good chance that we may see parity fail as support today and go on to test the H4 mid-way support 0.9950 (sits six above the aforementioned daily demand).
Our suggestions: In view of weekly action, we have little faith in parity as a support level. With that being the case, our team will be looking for a decisive H4 close to take shape beyond this number. Should this come into view, we’d require a retest to be seen before our desk would consider placing any sells in this market.
Data points to consider: US PPI data at 1.30pm along with FOMC member Bullard speaking at 9am GMT.
Levels to watch/live orders:
- Buys: Flat (stop loss: N/A).
- Sells: Watch for a close below 1.0000 and then look to trade any retest seen thereafter (stop loss: ideally beyond the candle that retests 1.0000 as resistance).
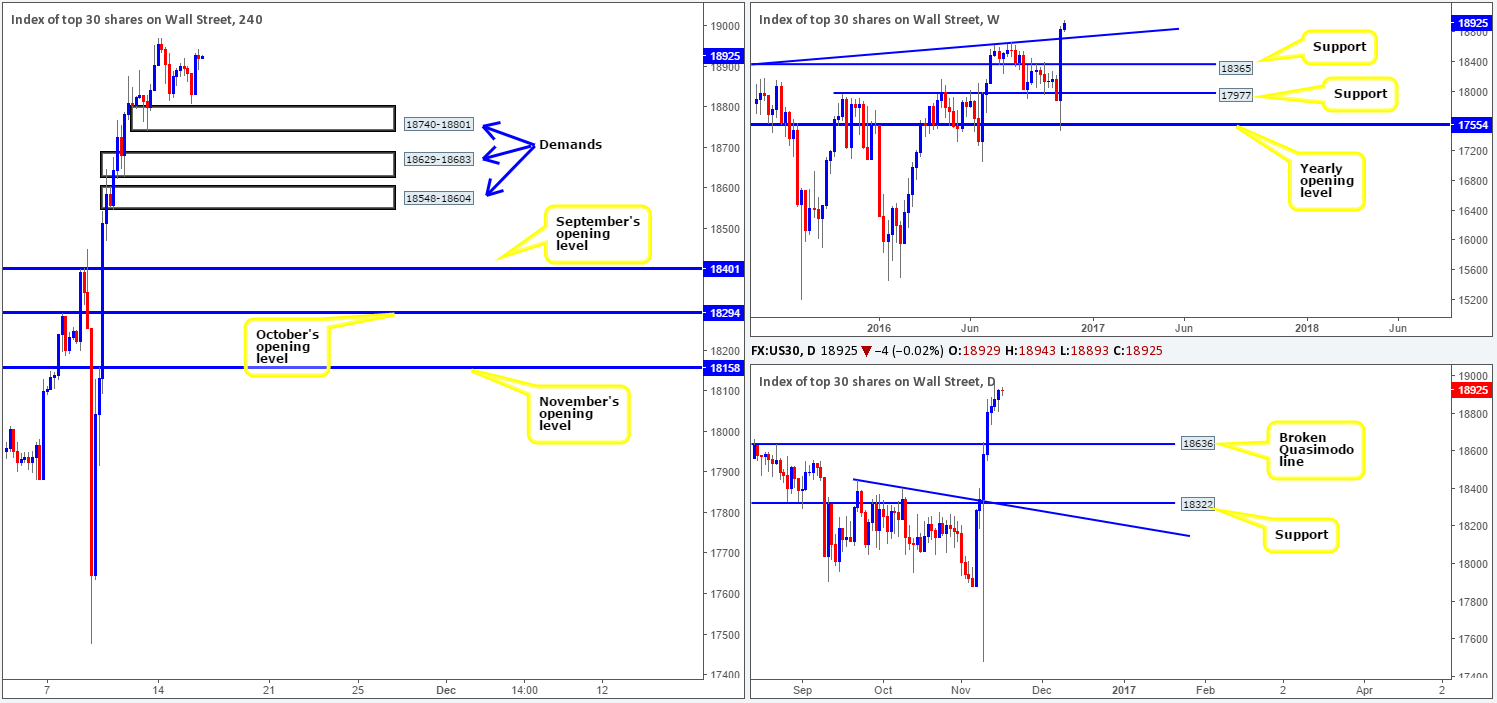
DOW 30:
During the course of yesterday’s trading, the US equity market managed to record its seventh consecutive daily gain! Despite this recent advance, the overall structure of the unit remains unchanged and, as such, we still feel that the overall tone remains biased to the upside.
Given the recent lackluster movement we’ve been seeing, our desk continues to watch the following three areas: The first, the lowest of the three, comes in at 18548-18604: a H4 demand which was formed following the break of the daily Quasimodo resistance level at 18636 (the next downside target on the daily timeframe). The second, the middle of the three is seen at 18629-18683: a H4 demand base that intersects beautifully with the weekly trendline support extended from the high 18365 (the next downside target on the weekly timeframe), boosting its appeal for longs. The third area drawn from 18740-18801, which is also a H4 demand barrier unfortunately has little higher-timeframe significance so is, in our book, liable to be faked should price test this area.
Our suggestions: In view of the higher-timeframe picture displaying room to continue advancing north, the two lower H4 demands are stable enough zones to consider entering at market given their connection with the higher timeframes. The upper area, whilst it has no connection to the bigger picture, could still react. However, we’d advise waiting for at least a H4 bullish close to form prior to pulling the trigger here to avoid the possibility of getting caught on any fakeout.
Data points to consider: US PPI data at 1.30pm along with FOMC member Bullard speaking at 9am GMT.
Levels to watch/live orders:
- Buys: 18740-18801 ([reasonably sized H4 bullish close required prior to pulling the trigger] stop loss: ideally beyond the trigger candle). 18629-18683 ([a possible area to consider entering at market from] stop loss: 18618). 18548-18604 ([a possible area to consider entering at market from] stop loss: 18537).
- Sells: Flat (stop loss: N/A).
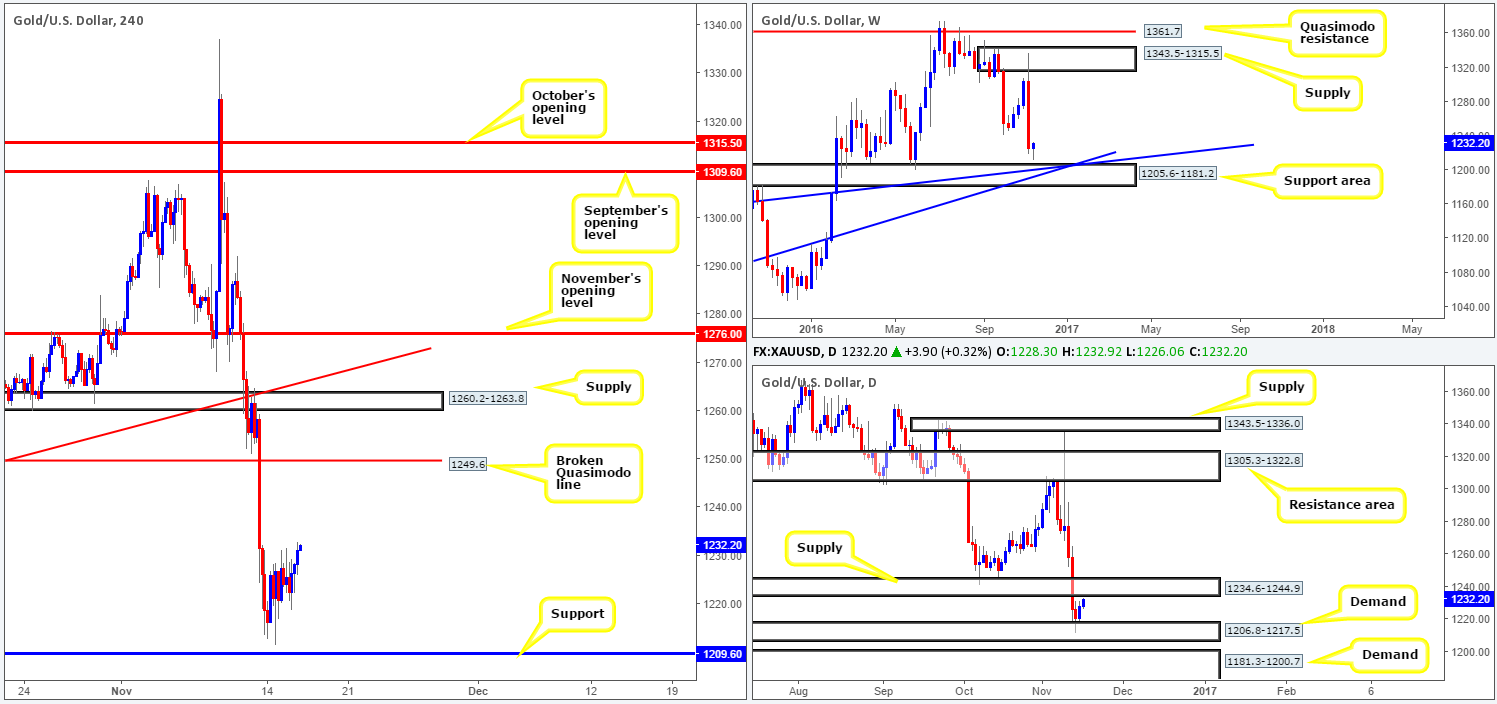
GOLD:
Leaving the H4 support at 1209.6 unchallenged, the yellow metal managed to close in the green yesterday, following three uninterrupted losing days! Daily demand at 1206.8-1217.5, which happens to be positioned directly above a weekly support area at 1205.6-1181.2 was, as far as we can see, the main (technical) catalyst behind yesterday’s advance.
In spite of Gold’s recent U-turn, there’s a daily supply skulking just ahead of current price at 1234.6-1244.9 that could prove to be problematic for buyers. As such, until this area is engulfed, our team will be reluctant to enter into any long positions. Likewise, we’ll also be unwilling to sell bullion based on the current daily demand.
Our suggestions: In light of recent movement, we simply do not see a whole lot to hang our hat on at the moment. Our desk has come to consensus that before a trade can safely be considered here, either the above said daily demand will need to be taken out or the aforementioned daily supply. Only then will we have some idea on the probable direction the candles are heading.
Levels to watch/live orders:
- Buys: Flat (stop loss: N/A).
- Sells: Flat (stop loss: N/A).


