EUR/USD:
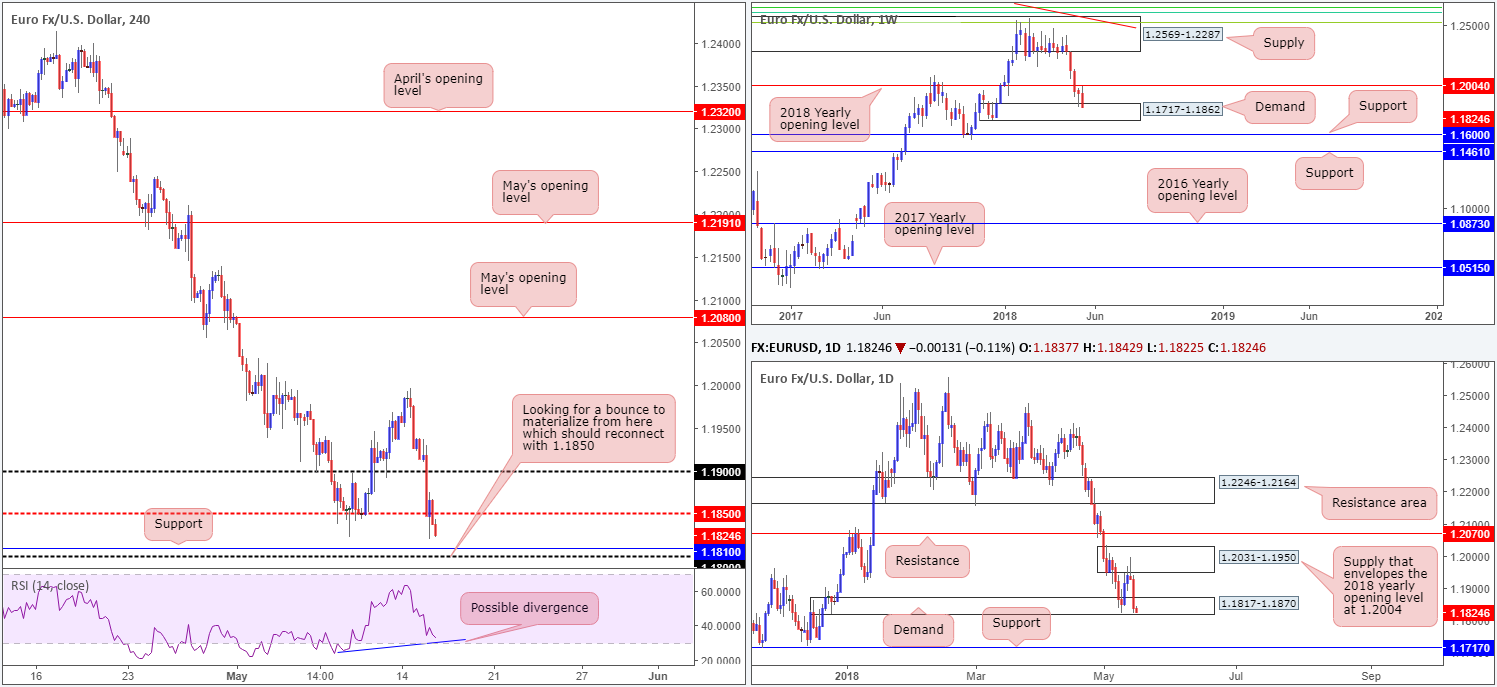
The buck reigned supreme on Tuesday with the currency striking fresh YTD highs, largely taking their cue from Treasury yields which pushed ahead to fresh multi-year highs. This movement – coupled with a German GDP miss and an in-line prelim estimate of Eurozone GDP – saw the euro take out the 1.19 handle along with the H4 mid-level support at 1.1850. Further to this, US retail sales, although printed a less-than-expected number, failed to generate any USD selling. It was quite the opposite in fact!
Technically speaking, the single currency is now seen reconnecting with weekly demand positioned at 1.1717-1.1862, after a near-touch of the 2018 yearly opening level seen directly above it at 1.2004. In conjunction with weekly flow, daily demand at 1.1817-1.1870 (glued to the top edge of the weekly demand) is also back in play. However, judging by the response seen so far, this area may be in trouble. A violation here, therefore, could see the daily support level at 1.1717 enter the fray, which is essentially the lower edge of the weekly demand area mentioned above.
Potential trading zones:
With 1.1850 now likely to serve as resistance on the H4 scale, H4 support at 1.1810, shadowed closely by the 1.18 handle are the next supports in the firing range. Also noteworthy is the H4 RSI indicator appears to be printing a possible divergence reading.
1.1810/1.18 is an area we feel a bounce to the upside may take place. Here’s why. To reach these H4 levels, a breach of the current daily demand needs to occur. Below this demand area are stop-loss orders. These orders, when filled, become sell orders and therefore provide liquidity for bigger traders to come in and buy. Stop-loss orders, for those considering a long, are best placed beyond the 18/12/2017 low 1.1775, with the initial take-profit target falling in at 1.1850.
Data points to consider today: EUR final CPI y/y; ECB President Draghi speaks; US building permits/ US housing starts; FOMC member Bostic speaks; US industrial production m/m and Capacity utilization rate.
GBP/USD:
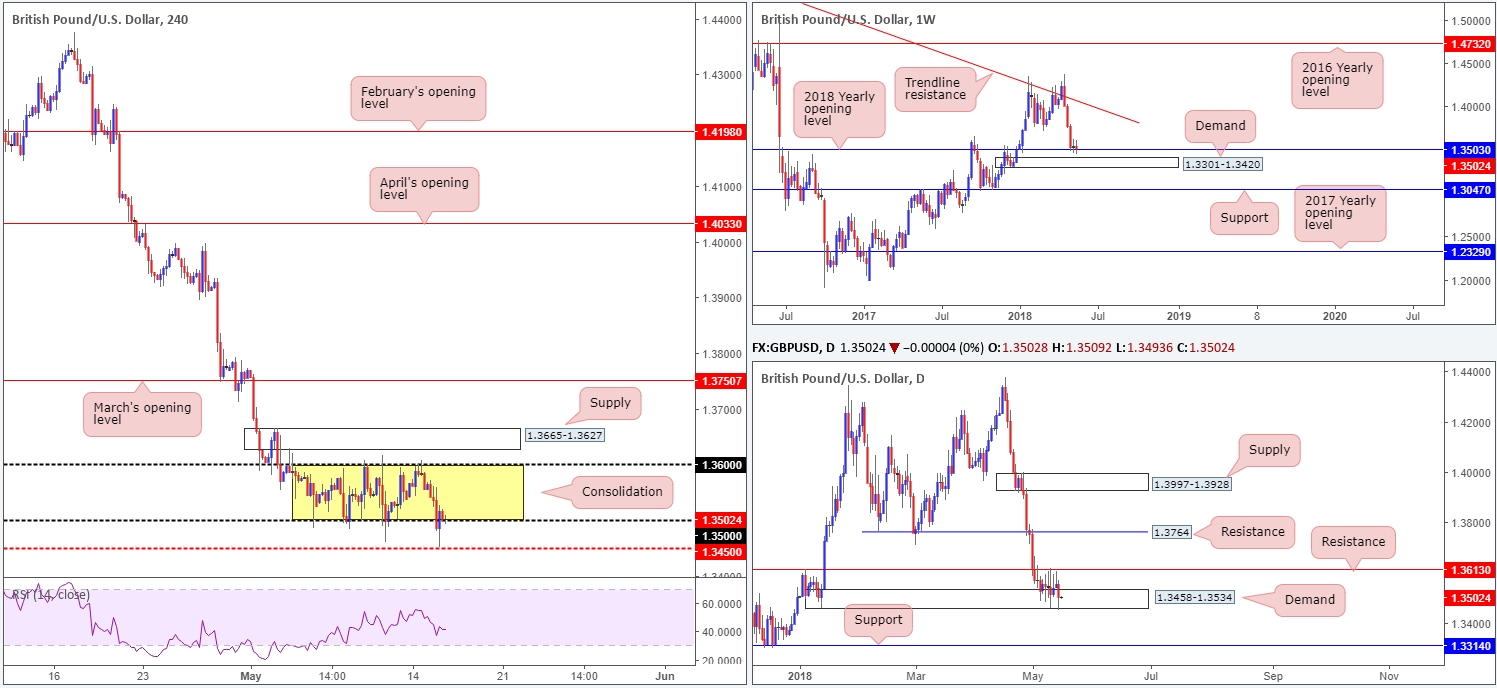
On the back of mixed UK employment data and a robust USD across the board, sterling fell sharply on Tuesday, surpassing January’s low 1.3458 by a couple of pips. Pricing for a June hike remains for unchanged, while August pricing implies that there’s a 40% chance that interest rates may be increased.
Despite a breach of the lower edge of the current H4 range between 1.36/1.35, which brought the H4 candles down to within striking distance of the 1.3450 H4 mid-level support, the ranging formation remains intact, just! Across on the daily timeframe, the daily demand at 1.3458-1.3534 and daily resistance coming in at 1.3613 also remain unharmed, in spite of a marginal breach to the downside being observed. And finally, on the weekly timeframe, the 2018 yearly opening level seen at 1.3583, as you can see, has so far held ground. Though, traders may want to note that the bulls have yet to print anything meaningful to the upside from here, which could mean we may eventually be heading down to weekly demand at 1.3301-1.3420.
Potential trading zones:
Although the immediate trend in this market clearly points in a southerly direction, price action is tricky.
d materialize off the 2018 yearly opening barrier at 1.3503, which not only represents the lower edge of the current H4 range, it is also placed within daily demand at 1.3458-1.3534. On the other hand, however, we have the daily candles bringing out weakness off the current daily resistance level (see the clear daily selling wicks and recent push lower), and a clear downtrend present that could be too much for the buyers to take on!
Despite current structure, there could still be an opportunity for range traders to take advantage of the noted H4 consolidation (1.36/1.35). A long from the lower edge of this region with stop-loss orders positioned beyond the surrounding daily demand may is an option. Utilizing this demand for stop-loss placement will help avoid any nasty surprises in the form of a fakeout which are all too common around psychological numbers!
Data points to consider today: US building permits/ US housing starts; FOMC member Bostic speaks; US industrial production m/m and Capacity utilization rate.
AUD/USD:
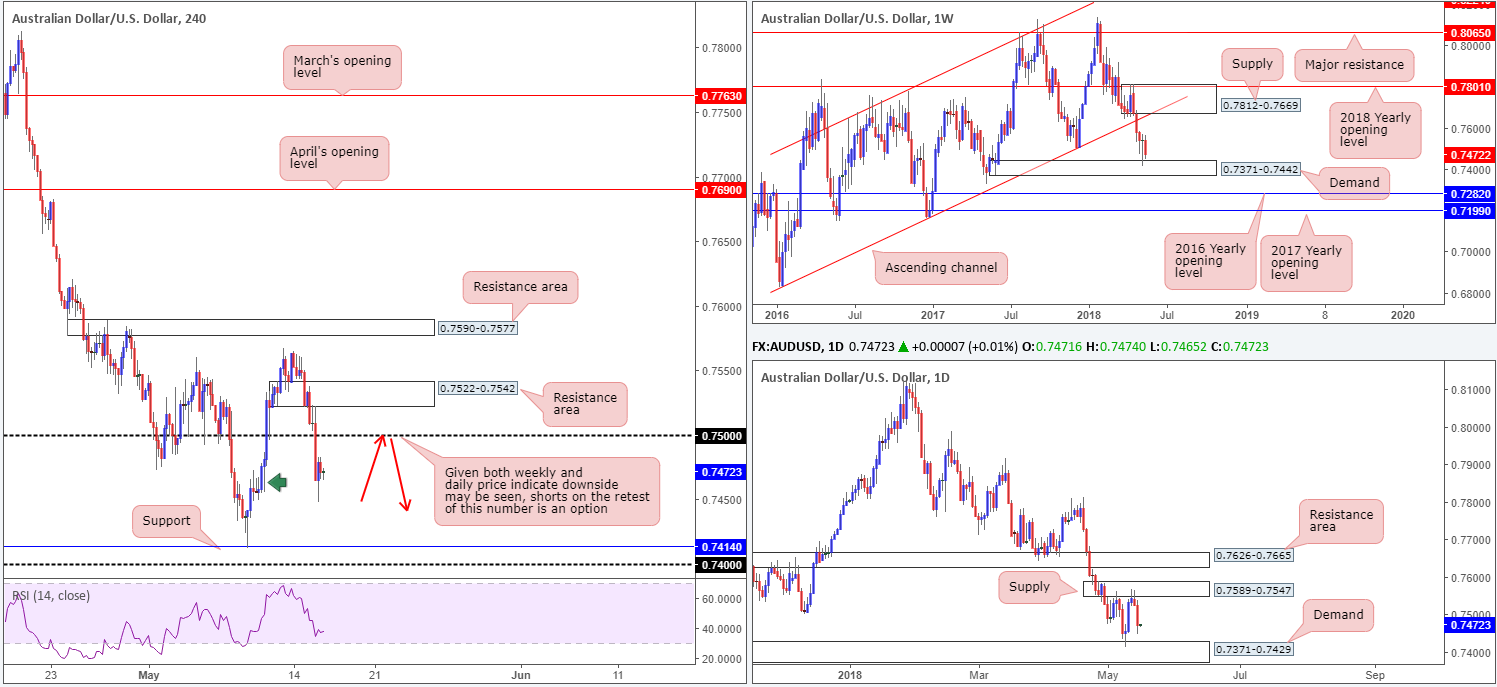
The sellers managed to find their feet early on during Asia hours on Tuesday, following the RBA’s meeting minutes where the central bank largely reiterated its current guidance. In addition to this, Chinese economic news was overall AUD negative. However, it wasn’t until European trade did we see the sellers crunch into a higher gear.
As can be seen on the H4 timeframe this morning, the commodity currency absolutely obliterated the 0.75 handle and clocked a session low of 0.7447. There is H4 demand seen to the left of current price (marked with a green arrow at 0.7448-0.7472), which may continue to hold price action higher during Asia. The next downside target on this scale, though, at least in our opinion, is the H4 support level priced in at 0.7414.
The story on the weekly timeframe shows us that weekly price may look to inch lower today/this week to reconnect with weekly demand positioned at 0.7371-0.7442. Meanwhile, on the daily timeframe, demand at 0.7371-0.7429 (located within the lower limit of the current weekly demand) appears to be the next downside target on the radar.
Potential trading zones:
According to the technicals at this time, the pendulum still appears to be swinging toward more of a bearish approach. A retest seen at the underside of the 0.75 handle as resistance, therefore, may be of interest, targeting the top edge of the current weekly demand at 0.7442 as the initial take-profit barrier.
Data points to consider today: AU. Wage price index q/q; US building permits/ US housing starts; FOMC member Bostic speaks; US industrial production m/m and Capacity utilization rate.
USD/JPY:
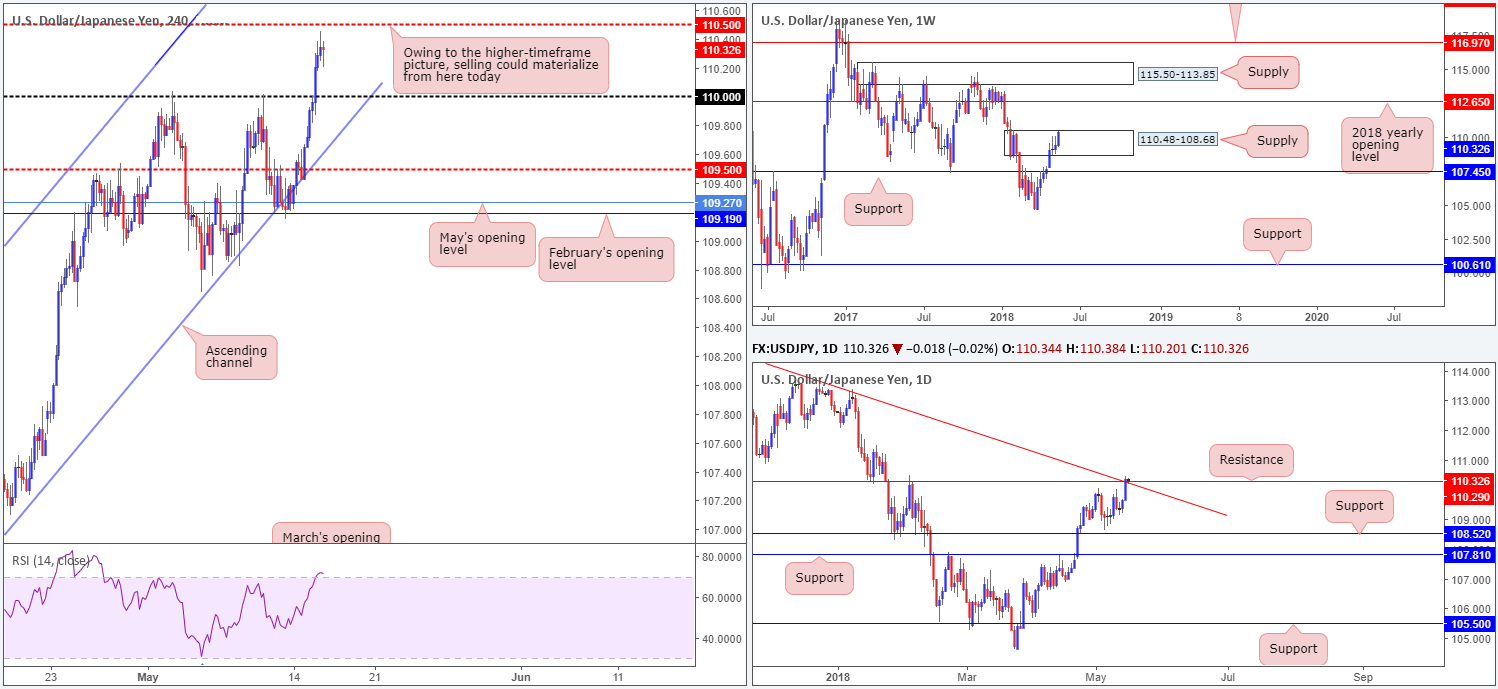
Bolstered by a healthy serving of buying seen in the US Treasury market and a robust USD across the board, the USD/JPY aggressively advanced higher on Tuesday. The 110 handle seen on the H4 timeframe put up little fight and was quickly disposed of. According to H4 structure, the next port of call to the upside resides at 110.50, where we currently see price hovering just ahead of.
The weekly supply area at 110.48-108.68 has weakened dramatically this week, with price action now chewing on the top edge of the zone. A violation of this area may set the stage for a continuation move north towards the 2018 yearly opening level at 112.65. Daily movement, on the other hand, shows price testing resistance formed at 110.29, which, as you can see, intersects beautifully with a daily trend line resistance etched from the high 114.73.
Potential trading zones:
Seeing as weekly price remains within the confines of supply, albeit marginally, and daily price is seen interacting with a particularly interesting collection of resistances, a downside move may take place off of the H4 mid-level resistance 110.50 today. To avoid an unnecessary loss, though, traders may want to wait and see if H4 price can chalk up a full or near-full-bodied bearish candle before pulling the trigger. The first area of concern from this point falls in around the 110 neighborhood.
Data points to consider today: US building permits/ US housing starts; FOMC member Bostic speaks; US industrial production m/m and Capacity utilization rate.
USD/CAD:
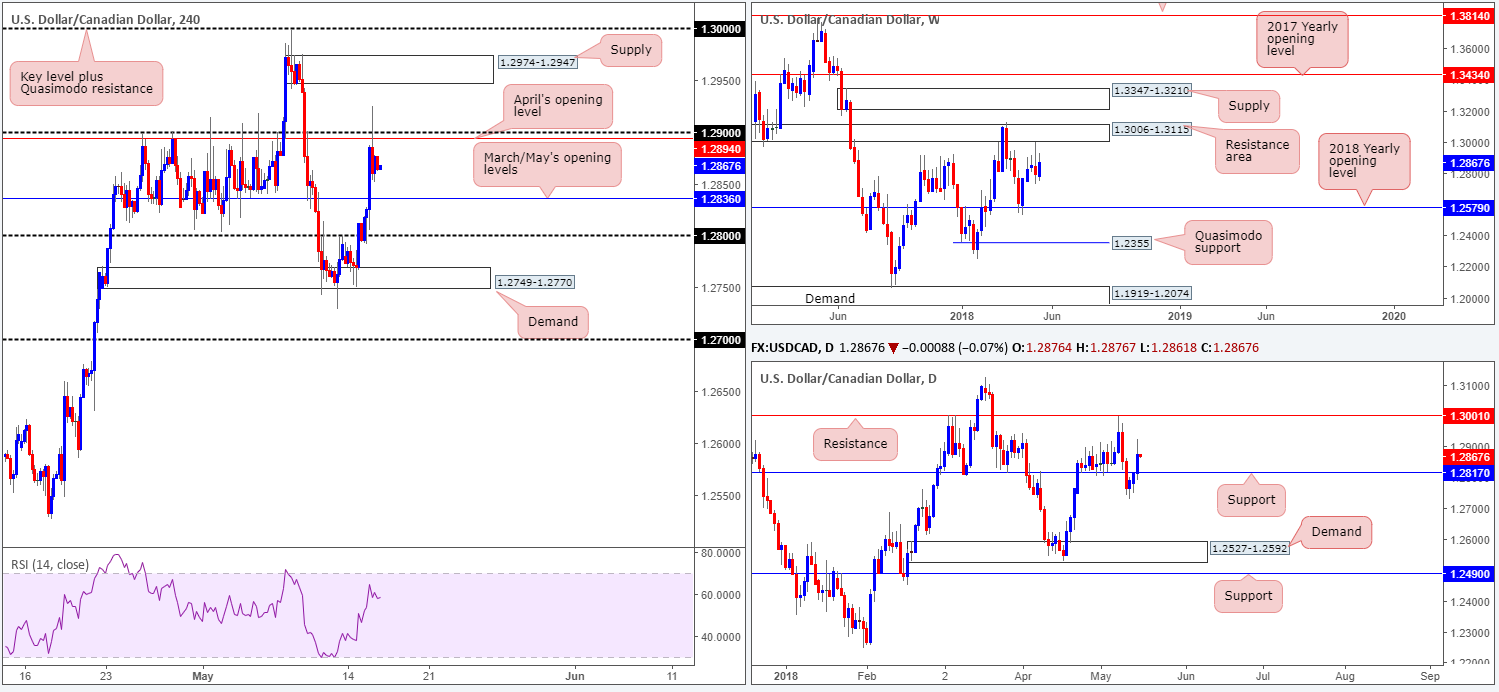
A mighty USD, coupled with doubts that a NAFTA deal could be achieved by Paul Ryan’s soft deadline on May 17, pushed the USD/CAD through 1.29/April’s opening level at 1.2894 during Tuesday’s movement. Despite this, the air was relatively thin above this number, consequently forcing the unit to pare a portion of recent gains into the close.
Technical structure is somewhat restricted on the H4 scale right now. Upside is capped by 1.29, while downside will likely find trouble getting through March/May’s opening levels printed at 1.2836. Daily price, on the other hand, is seen trading above support at 1.2817, thanks to yesterday’s bout of buying. Assuming the bulls maintain a presence, daily resistance at 1.3001 may be brought into the fight. What’s also interesting here is this daily resistance is seen positioned just ahead of a weekly resistance area plotted at 1.3006-1.3115.
Potential trading zones:
While further upside could be seen on the bigger picture, buying on the H4 timeframe is tricky given 1.29 lurking above. Owing to this, the team has noted to watch for a H4 close to print above 1.29. Preferably followed up with a retest as support, buying off of 1.29 could be an option, targeting nearby H4 supply at 1.2974-1.2947, followed then by the key figure 1.30 which effectively represents the current daily resistance.
Data points to consider today: US building permits/ US housing starts; FOMC member Bostic speaks; US industrial production m/m and Capacity utilization rate; CAD manufacturing sales m/m; (CAD) Gov. Council member Schembri speaks.
USD/CHF:
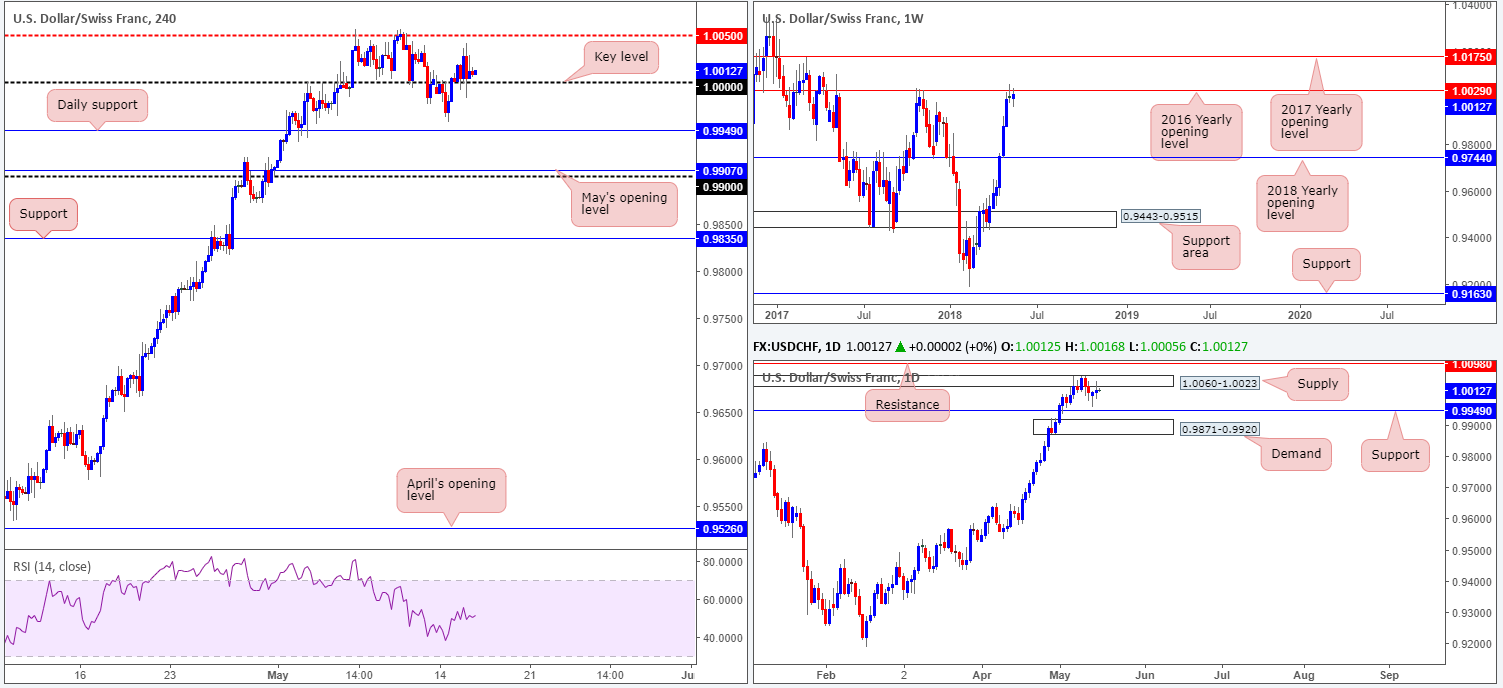
Using parity (1.0000) as a floor on Tuesday, USD/CHF price action was relatively subdued, ranging little more than 50 pips. In response to yesterday’s action, it is clear the bulls are struggling to make headway despite finding support off such a huge number.
In regard to the above, the higher-timeframe picture may be able to answer why the bulls lack oomph! Weekly price is seen hugging the underside of the 2016 yearly opening level positioned at 1.0029. Sellers are clearly present here, but are yet to chalk up any convincing movement. On top of this, we can also see that daily action is trading from a supply zone registered at 1.0060-1.0023. Note that this area holds the weekly level within its lower boundary.
Potential trading zones:
Knowing weekly and daily structure display potentially troublesome resistance ahead, entering long on the basis of H4 price trading from 1.0000 is not really a trade we would label high probability. With that being the case, the team has noted to keep an eye out for another H4 close beneath 1.0000. Should this be followed up with a retest as resistance it’d likely be enough to validate intraday shorting opportunities, targeting daily support at 1.0049 as an initial take-profit zone.
Data points to consider today: US building permits/ US housing starts; FOMC member Bostic speaks; US industrial production m/m and Capacity utilization rate.
Dow Jones Industrial Average:
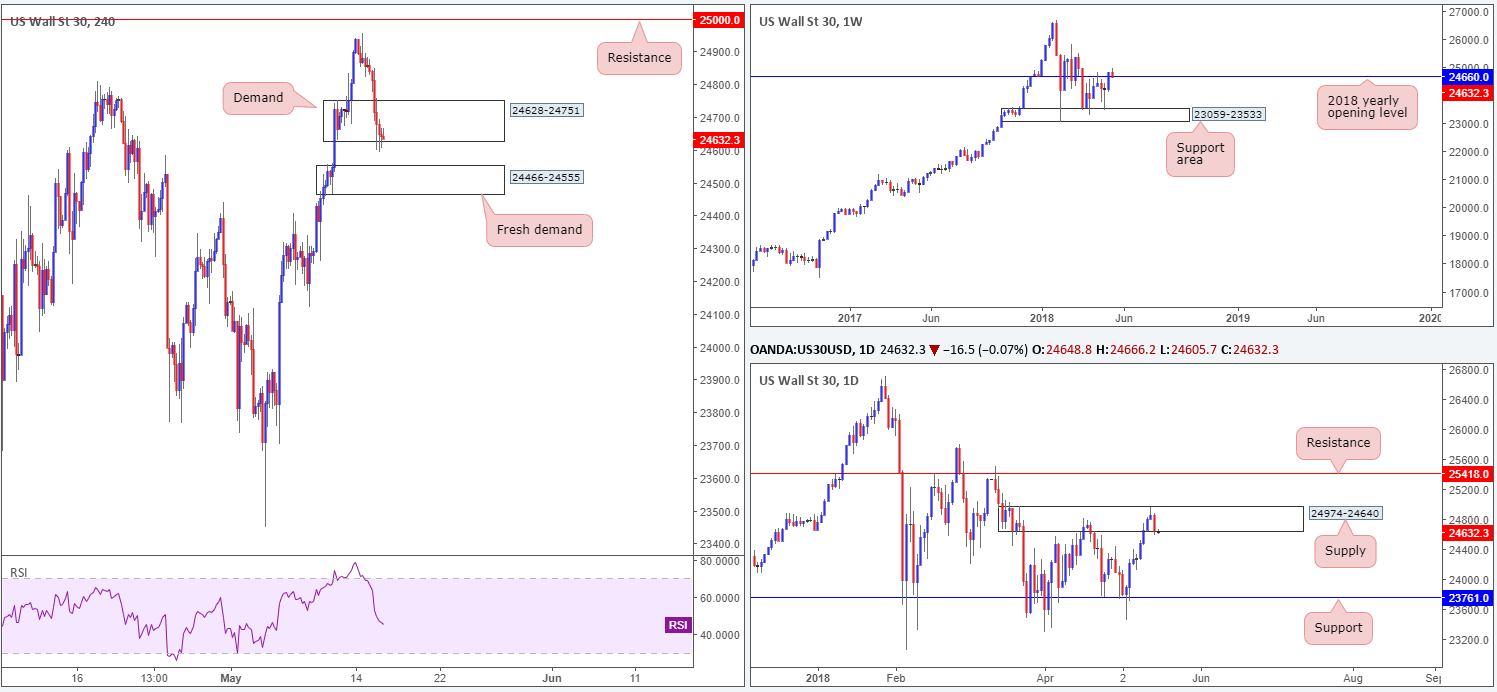
US equities turned aggressively lower on Tuesday, down from Monday’s peak 24957. The 10-year US Treasury yield benchmark climbed to highs of 3.095 (levels not seen since summer 2011), inevitably weighing on US stocks, with the H4 demand at 24628-24751 clearly suffering the consequences! Stop-loss orders positioned beneath this area have likely been filled, potentially opening up space for the index to press lower and bring in fresh H4 demand seen at 24466-24555.
Thanks to yesterday’s downside move, weekly price is seen retesting the 2018 yearly opening level at 24660. Daily price, however, extended lower on the back of Monday’s bearish pin-bar formation found within the upper limit of a daily supply zone at 24974-24640. Technically speaking, we do not see much in the way of support on this timeframe until we achieve 23761 (also can be considered a Quasimodo support level).
Potential trading zones:
The fresh H4 demand mentioned above at 24466-24555 is a point of interest this morning. Not only because the area is fresh, but also due to this zone likely being the ‘decision point’ to break above the 2018 yearly open level on the weekly timeframe! Therefore, traders should expect buyers to make an appearance from here. However, a long based on this area would unfortunately have you going up against daily sellers out of their supply. And on top of this, there’s a chance the current H4 demand could act as a base of resistance. To try and help combat this, traders may want to wait and see if H4 price can chalk up a full or near-full-bodied bull candle out of 24466-24555 before taking the plunge.
Data points to consider today: US building permits/ US housing starts; FOMC member Bostic speaks; US industrial production m/m and Capacity utilization rate.
GOLD:
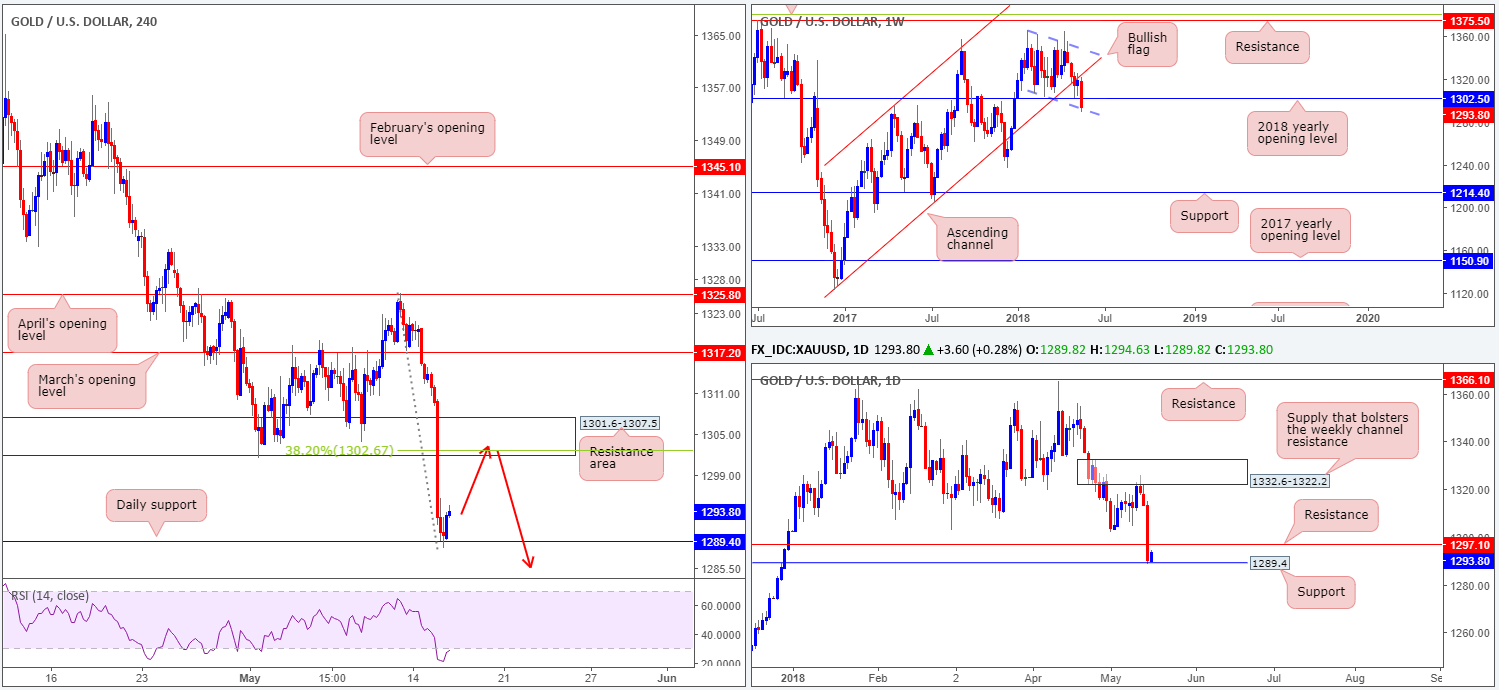
Kicking things off with a look at the weekly timeframe highlights that the yellow metal is now seen testing the lower edge of a bullish flag formation taken from the low 1307.2. Also note that the 2018 yearly opening level seen at 1302.5 was recently taken out. A closer look at price action on the daily timeframe shows us that support at 1297.1 was aggressively wiped out in recent trade, enabling bullion to shake hands with support fixed in at 1289.4.
Across on the H4 scale, the bounce off of the noted daily support level could potentially force the H4 candles to retest the recently broken H4 demand area at 1301.6-1307.5 (now acting resistance), which happens to hold a 38.2% H4 Fib resistance value within at 1302.6.
Potential trading zones:
A retest of the H4 area 1301.6-1307.5 zone is worthy of attention for possible short. Here’s why:
- An area aligned with the current trend (down).
- As mentioned above it holds a 38.2% H4 Fib resistance value within at 1302.6.
- The 2018 yearly opening level on the weekly timeframe is also seen within the lower limit of the area at 1302.5.
Points of concern, however, are the following:
- Weekly price could hold the lower edge of the bullish flag formation and push higher.
- Price could possibly turn lower before reaching our point of interest, given daily resistance is positioned beneath it at 1297.1.
An ideal way to help deal with the above noted uncertainty is to simply observe H4 action once, or indeed if, price reaches 1301.6-1307.5. A full or near-full-bodied bearish candle printed within the walls of the current H4 resistance area would, in our view, be enough to validate shorts. Stop-loss orders, as far as we can see, would be best placed above the H4 (confirmation) candle’s wick.
This site has been designed for informational and educational purposes only and does not constitute an offer to sell nor a solicitation of an offer to buy any products which may be referenced upon the site. The services and information provided through this site are for personal, non-commercial, educational use and display. IC Markets does not provide personal trading advice through this site and does not represent that the products or services discussed are suitable for any trader. Traders are advised not to rely on any information contained in the site in the process of making a fully informed decision.
This site may include market analysis. All ideas, opinions, and/or forecasts, expressed or implied herein, information, charts or examples contained in the lessons, are for informational and educational purposes only and should not be construed as a recommendation to invest, trade, and/or speculate in the markets. Any trades, and/or speculations made in light of the ideas, opinions, and/or forecasts, expressed or implied herein, are committed at your own risk, financial or otherwise.
The use of the site is agreement that the site is for informational and educational purposes only and does not constitute advice in any form in the furtherance of any trade or trading decisions.
The accuracy, completeness and timeliness of the information contained on this site cannot be guaranteed. IC Markets does not warranty, guarantee or make any representations, or assume any liability with regard to financial results based on the use of the information in the site.
News, views, opinions, recommendations and other information obtained from sources outside of www.icmarkets.com.au, used in this site are believed to be reliable, but we cannot guarantee their accuracy or completeness. All such information is subject to change at any time without notice. IC Markets assumes no responsibility for the content of any linked site. The fact that such links may exist does not indicate approval or endorsement of any material contained on any linked site.
IC Markets is not liable for any harm caused by the transmission, through accessing the services or information on this site, of a computer virus, or other computer code or programming device that might be used to access, delete, damage, disable, disrupt or otherwise impede in any manner, the operation of the site or of any user’s software, hardware, data or property.


