A note on lower timeframe confirming price action…
Waiting for lower timeframe confirmation is our main tool to confirm strength within higher timeframe zones, and has really been the key to our trading success. It takes a little time to understand the subtle nuances, however, as each trade is never the same, but once you master the rhythm so to speak, you will be saved from countless unnecessary losing trades. The following is a list of what we look for:
- A break/retest of supply or demand dependent on which way you’re trading.
- A trendline break/retest.
- Buying/selling tails/wicks – essentially we look for a cluster of very obvious spikes off of lower timeframe support and resistance levels within the higher timeframe zone.
- Candlestick patterns. We tend to only stick with pin bars and engulfing bars as these have proven to be the most effective.
We search for lower timeframe confirmation between the M15 the H1 timeframes, since most of our higher-timeframe areas begin with the H4. Stops are usually placed 5-10 pips beyond confirming structures.
EUR/USD:
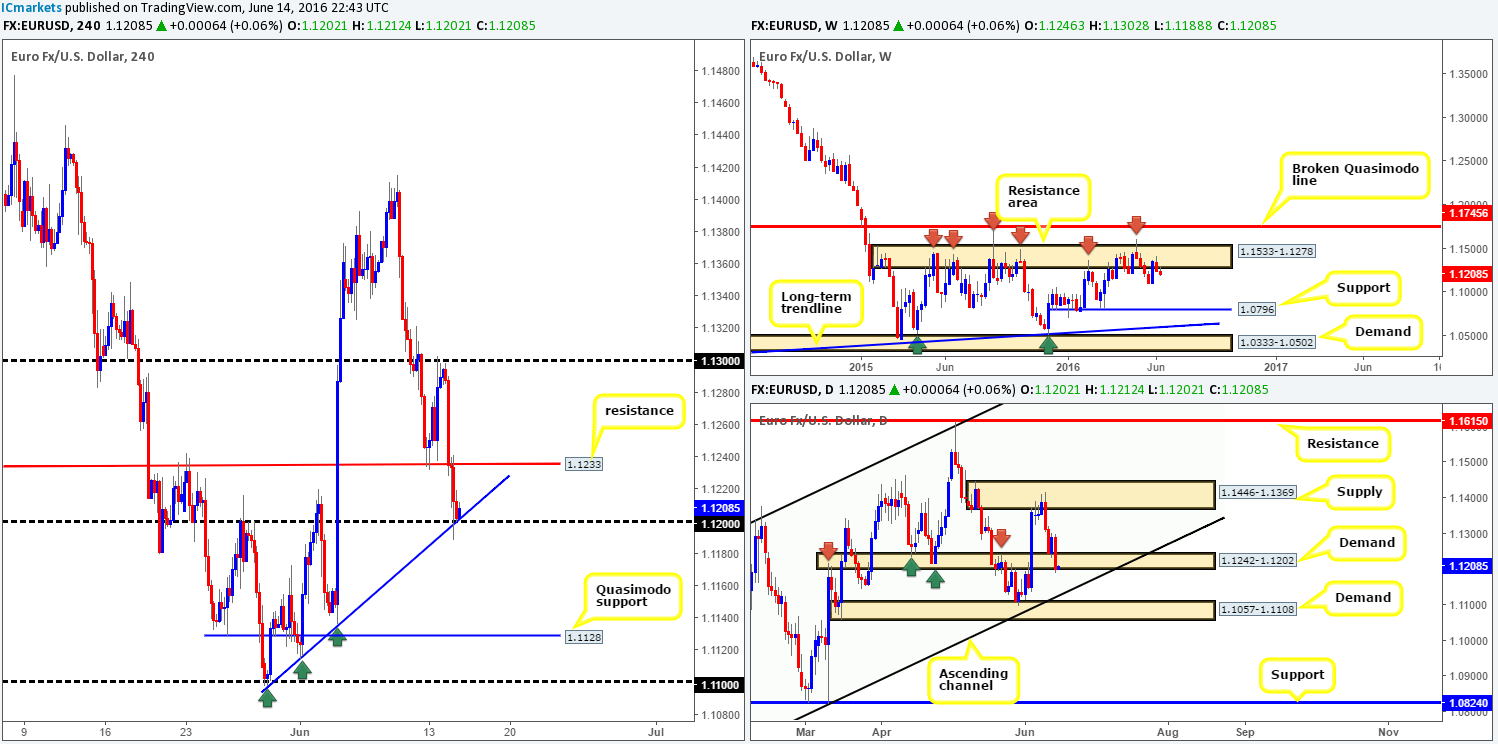
Starting from the top this morning, the weekly bears continue to defend the weekly resistance area drawn from 1.1533-1.1278. This zone, as we have mentioned in past reports, has capped upside in this market since May 2015 (see red arrows), thus further selling is probable. Turning our attention to the daily chart, demand at 1.1242-1.1202 is struggling to hold ground as price is now seen chewing on the lower edge of this area as we write. Should stops be filled from below this zone, it’s very likely we’re then heading down to shake hands with the daily channel support line extended from the low 1.0516.
Stepping over to the H4 chart, we can see that the shared currency failed to sustain gains above the 1.13 handle yesterday. As a result, price tumbled lower and took out H4 support at 1.1233 (now acting resistance), consequently ending the day testing the 1.12 line as support.
Our suggestions: Supported by both a H4 trendline support taken from the low 1.1097 and H4 supply seen over on the USD/SEK at 8.3425-8.3161 (inversely correlated market), 1.12 could see a short-term bounce back up to H4 resistance at 1.1233. We’d be surprised to see it drive higher than this line given our notes on the higher timeframes (see above). That being the case, should the EUR close below 1.12 our team would shift stances and look to short this market. Before we’d consider putting capital at risk, however, two things would need to be seen. Firstly, a retest of 1.12 as resistance, and secondly a lower timeframe sell signal following the retest (see the top of this report for ideas on pinning down lower timeframe setups).
Levels to watch/live orders:
- Buys: Flat (Stop loss: N/A).
- Sells: Watch for price to consume 1.12 and look to trade any retest seen thereafter (lower timeframe confirmation required).
GBP/USD:
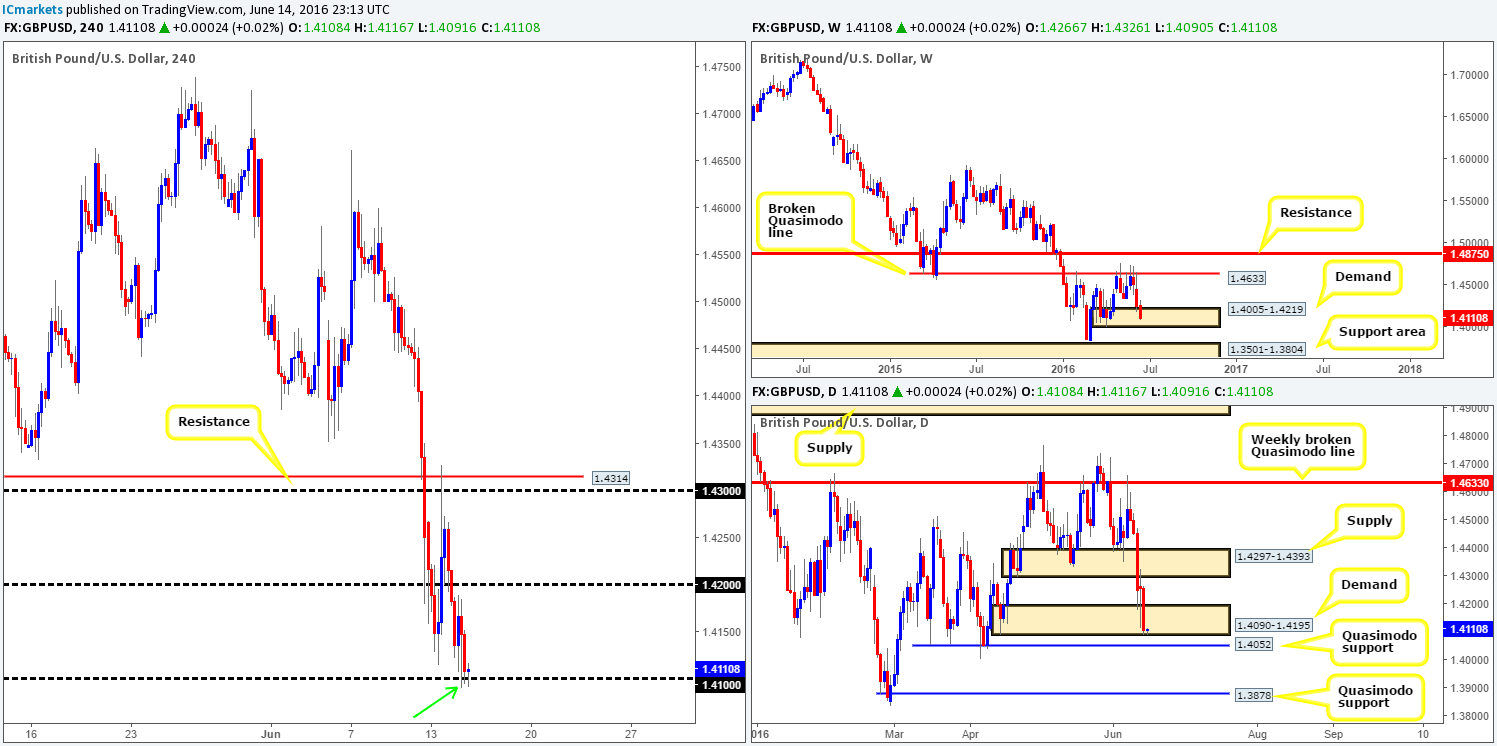
Fears of a ‘Brexit’ have been clearly weighing down on this pair, as cable recently dived below the 1.42 handle and plugged into a floor of bids around 1.41, which for now is seen holding firm. However, looking at the H4 candle action surrounding 1.41 its doubtful price will push higher from here in our opinion. The first visit (seen marked with a green arrow) was unable to close above the prior candle’s body. The second test proved there is still selling pressure from above as price closed within a few pips of 1.41. It is now down to the third touch which is in the process of printing at the moment, and looks to be somewhat bullish.
With the above points in mind, let’s take a peek at the bigger picture… Weekly demand at 1.4005-1.4219 has yet to register bullish intent, which is quite concerning. Along the same vein, daily demand at 1.4090-1.4195 is also on the brink of destruction, as price is currently testing the lower edges of this area as we write. If this zone does indeed give way, there is immediate support seen just below in the form of a daily Quasimodo support coming in at 1.4052. This is, in effect, the last barrier of support shielding this pair from dropping down to cross swords with 1.3878 – another daily Quasimodo support (seen located within a weekly support area at 1.3501-1.3804 – the next downside target beyond the current weekly demand zone)
Our suggestions: We would recommend holding fire trading this pair given the above notes. There is always another day, and trading when unsure is a sure fire way to lose money in the markets as we then become emotional!
Levels to watch/live orders:
- Buys: Flat (Stop loss: N/A).
- Sells: Flat (Stop loss: N/A).
AUD/USD:
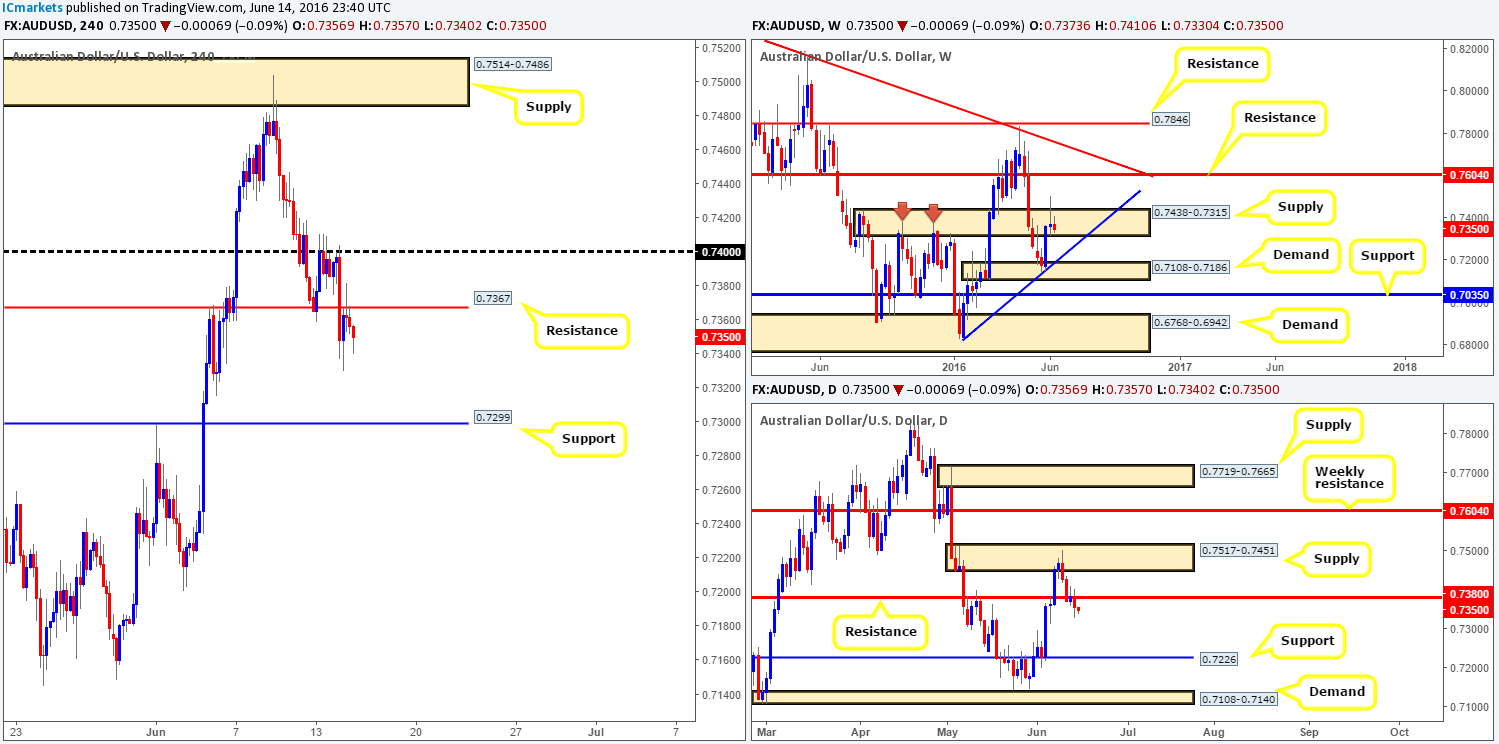
Shortly after the Aussie retested 0.74, price fell sharply yesterday and engulfed H4 support at 0.7367, which, as can be seen from the H4 chart, has now been retested as resistance and looks to be in a solid position. This was in fact a noted move to watch out for in our previous report, and we still believe the Aussie is heading lower to test H4 support at 0.7299. Well done to any of our readers who managed to pin down a setup here!
In support of further downside being seen in this market, the weekly chart shows selling interest forming within weekly supply at 0.7438-0.7315. Alongside this, daily resistance at 0.7380 held steady during yesterday’s trading and now looks to be heading in the direction of daily support penciled in at 0.7226.
Our suggestions: Unless the commodity currency retests the H4 support at 0.7367 for a second time (in which case we’ll look to short with lower timeframe confirmation – see the top of this report for confirming techniques), our team will place this pair on the back burner for the time being and reassess going into tomorrow’s sessions.
Levels to watch/live orders:
- Buys: Flat (Stop loss: N/A).
- Sells: 0.7367 region [Tentative – confirmation required] (Stop loss: dependent on where one confirms this area).
USD/JPY:
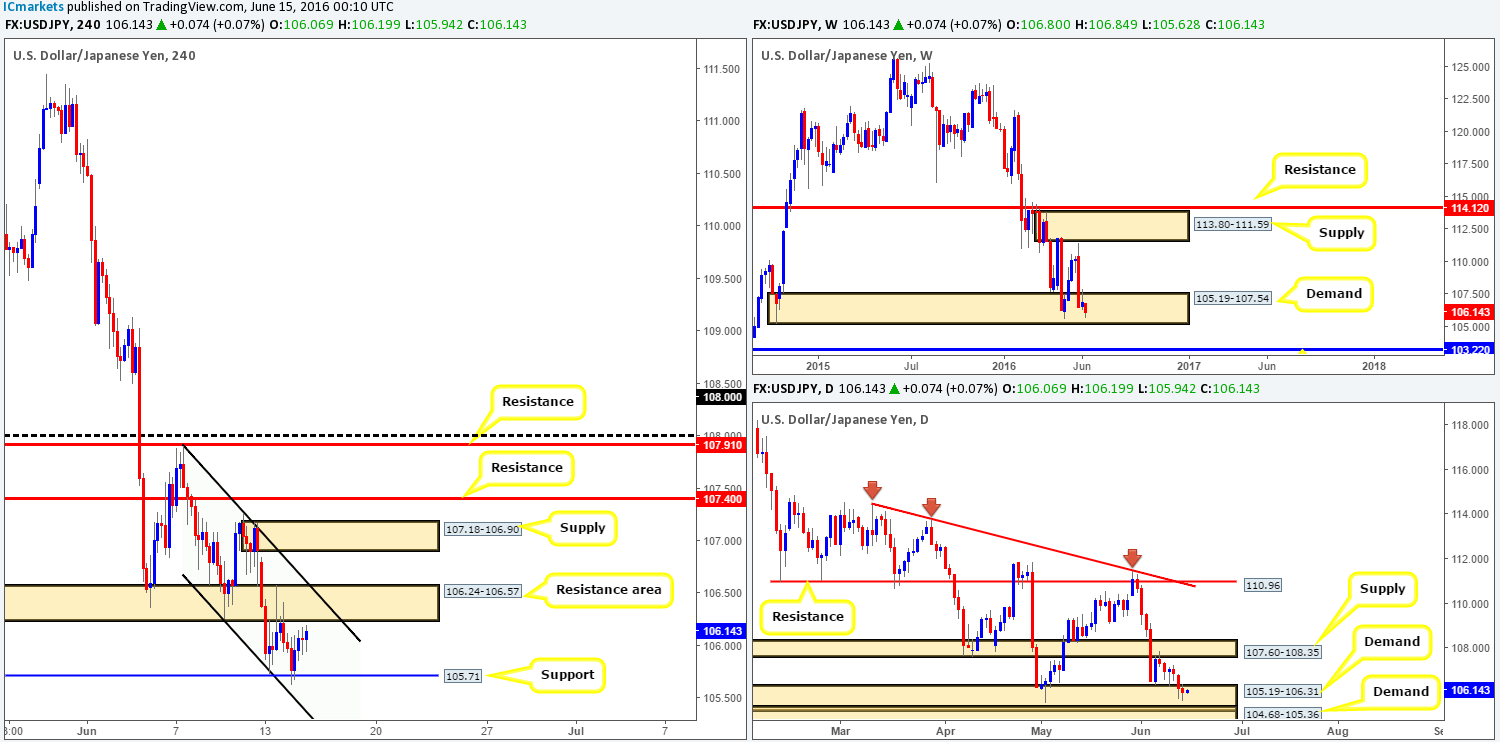
During the early hours of London, the USD/JPY found a pocket of bids around H4 support at 105.71 which pressured this pair to highs of 106.18 on the day. Other than the predominant downtrend in this market right now, there is little direction being seen as far as H4 structure is concerned. The H4 resistance area at 106.24-106.57 (which coincides with H4 channel resistance taken from the high 107.90) caps upside, whilst downside is capped by the aforementioned H4 support.
Looking over to both the weekly and daily charts, it is clear that this market resides within demand at the moment (weekly demand seen at 105.19-107.54 and daily demand coming in at 105.19-106.31). Despite this, buying this pair is tricky due to the current H4 resistance area lurking just above, followed closely by H4 supply seen at 107.18-106.90, and then a neighboring H4 resistance seen positioned above that at 107.40. This – coupled with the strong downtrend in play makes it a very difficult market to long, no matter where higher timeframe price is positioned! Therefore, our team will continue to sit on the sidelines for the time being and reassess the situation going into tomorrow’s sessions.
Levels to watch/live orders:
- Buys: Flat (Stop loss: N/A).
- Sells: Flat (Stop loss: N/A).
USD/CAD:
With the oil market touching lows of $48.00 yesterday, this, as you can see, aided the USD/CAD’s recent surge in buying which closed higher for the third consecutive day. From the daily chart, we can see that there is room seen for this rally to continue up to the daily resistance line at 1.2970. Moving over to the H4 chart, the H4 mid-way resistance 1.2850 was recently taken out, and in by doing so it has likely opened the pathway north for prices to challenge H4 resistance at 1.2911.
Our suggestions: Given the space to move higher seen on both the H4 and daily charts right now (see above), we’re going to be looking to trade any retest seen at 1.2850 today (see green arrows), targeting 1.2911, followed by daily resistance mentioned above at 1.2970.
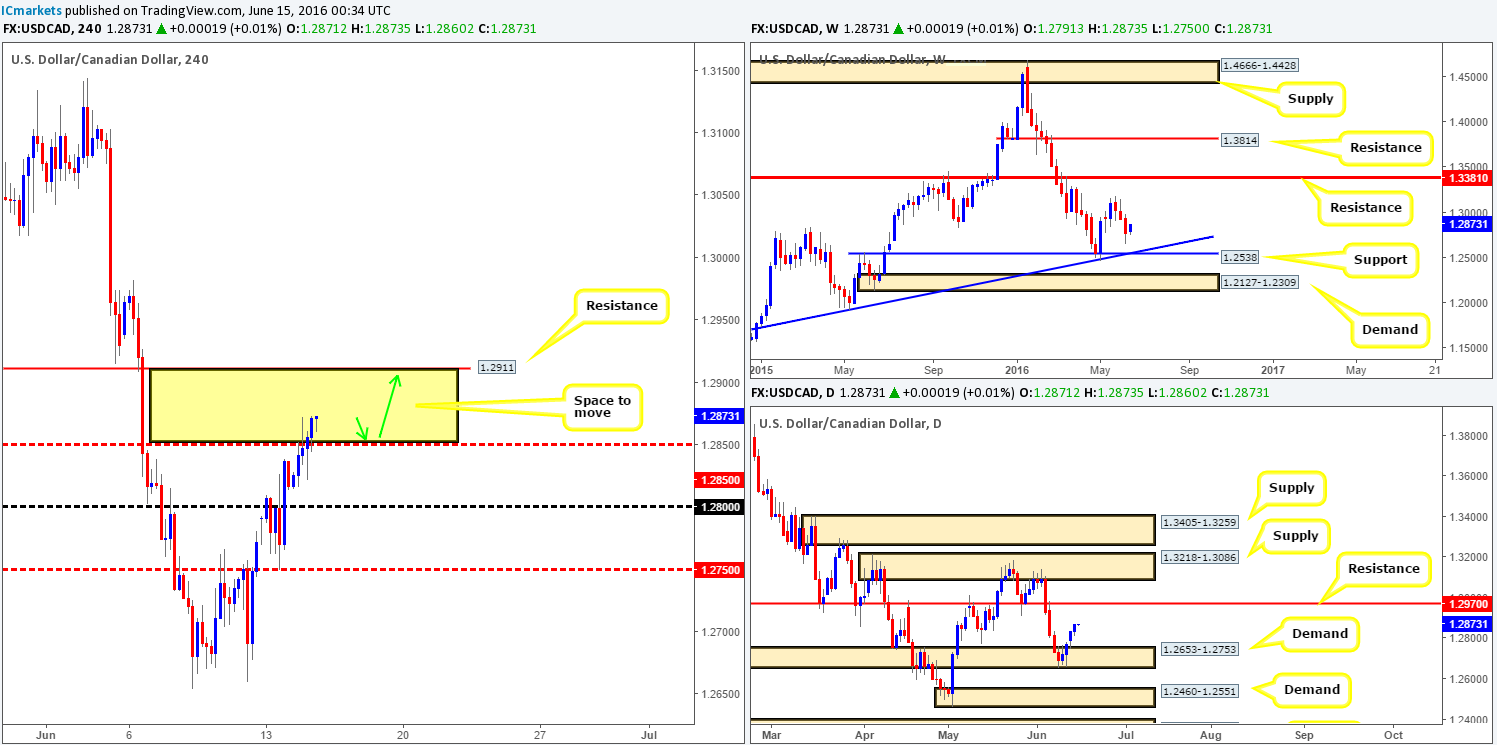
Levels to watch/live orders:
- Buys: 1.2850 region [Tentative – confirmation required] (Stop loss: dependent on where one confirms this area).
- Sells: Flat (Stop loss: N/A).
USD/CHF:
The USD/CHF pair, as you can see, has begun chiseling out a H4 range fixed between 0.9657/0.9619. Beyond the range limits, we can see that there’s a H4 resistance at 0.9684 just above, followed closely by psychological resistance 0.97, and a psychological support at 0.96 seen below.
Despite the above said consolidation, weekly action shows that the sellers remain in control of this market as it appears they’re still en-route to connect with weekly support at 0.9508 (coincides nicely with trendline confluence taken from the low 0.9078). In-line with weekly expectations, daily price chalked up yet another selling wick off the back of a daily supply fixed at 0.9663-0.9708. Assuming that this encourages sellers to participate, the next downside target to keep an eye on is the daily Quasimodo support at 0.9584 (trendline confluence taken from the low 0.9078).
Our suggestions: In view of this higher timeframe picture, it’s more likely that the H4 range will see a breach to the downside. However, shorting this market is difficult. A break below the H4 range lows would place one close to psychological support 0.96, which sits just above the daily Quasimodo support we at 0.9584! Not exactly ideal selling conditions if you ask us. Despite this one could still look to take this trade, should a setup form but with a smaller position size, since let’s not forget that there is potential, according to the weekly chart, for a move down to the 0.95 region.
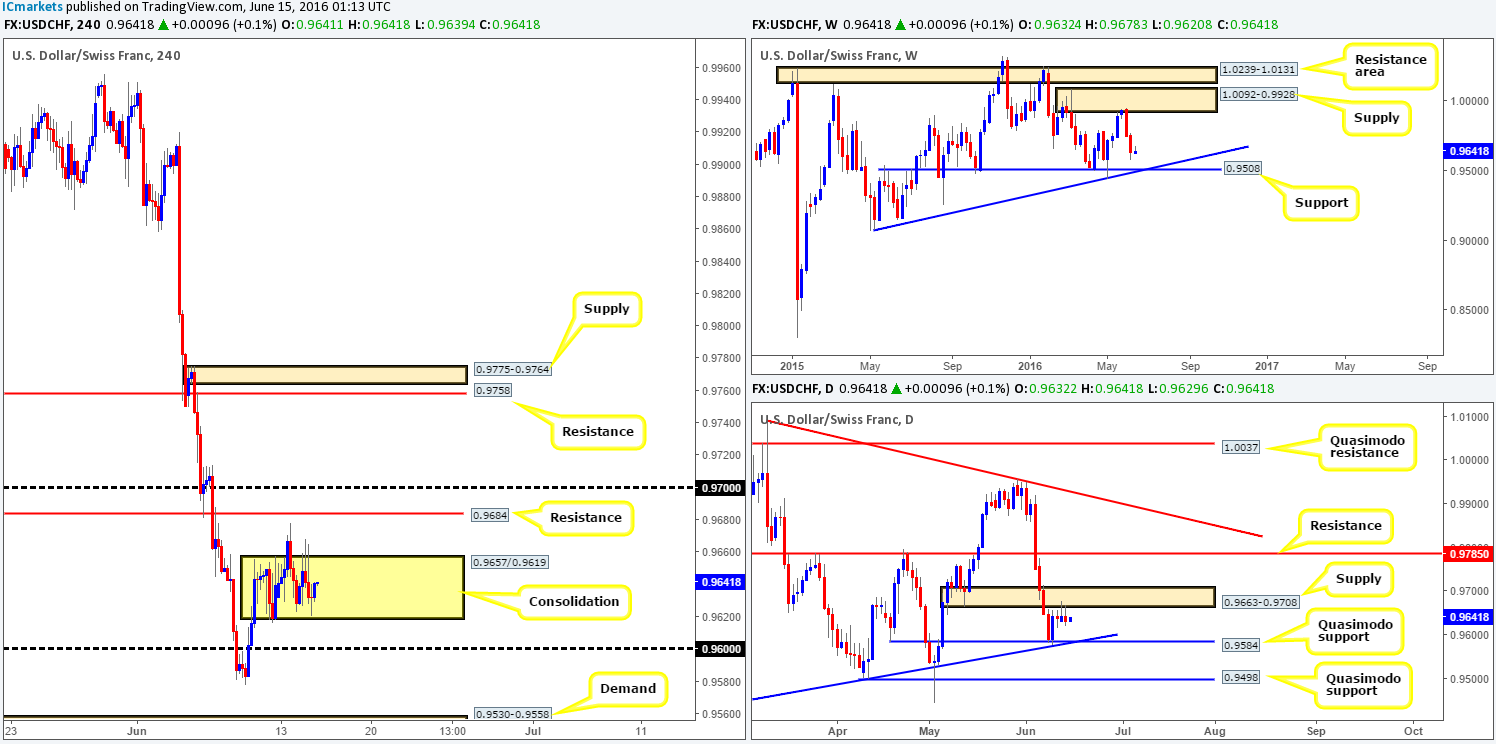
Levels to watch/live orders:
- Buys: Flat (Stop loss: N/A).
- Sells: Watch for price to consume 0.9619 and look to trade any retest seen thereafter (lower timeframe confirmation required).
DOW 30:
Stocks closed lower for the third consecutive day yesterday, consequently breaching the H4 Quasimodo support at 17700 and managing to reach lows of 17592 on the day. What this recent drive lower also did was force price into the jaws of a weekly support area registered at 17446-17606. Nevertheless, before we all start looking for a H4 support to buy from, do take note that daily movement shows room to continue pushing lower down to a daily support area coming in at 17396-17554.
Our suggestions: Some may disagree with the following, but we feel the DOW has further to drop yet despite price currently trading from the top-side of a weekly support area. Our plan of attack will consist of looking for lower timeframe sell entries between 17753 (H4 resistance) and 17700 (H4 Broken Quasimodo line), targeting H4 demand seen at 17463-17509 (green arrows), which is positioned within the daily support area mentioned above at 17396-17554.

Levels to watch/live orders:
- Buys: Flat (Stop loss: N/A).
- Sells: 17753/17700 region [Tentative – confirmation required] (Stop loss: dependent on where one confirms this area).
GOLD:
H4 demand at 1282.1-1278.5 continues to support this market, as further gains were posted going into yesterday’s close. The yellow metal remains well-bid on the back of safe-haven buying due to the risk-off environment currently in play right now. However, as we explained in our previous report, although fundamentally gold could rally higher, technicals show bullion to be crossing swords with weekly supply at 1307.4-1280.0, and daily action trading within the extremes of a daily supply zone at 1288.5-1272.9.
Our suggestions: Therefore, we still remain wary of buying from the current H4 demand given where the shiny metal is positioned on the higher timeframe picture (see above). Should price obey technicals here, however, and go on to break below the H4 demand there is potential for a (lower timeframe) confirmed short trade on any retest seen at this zone, targeting H4 demand at 1264.4-1266.5 (sits just above daily support at 1262.2). For ideas on how to spot lower timeframe confirmation, please see the top of this report.
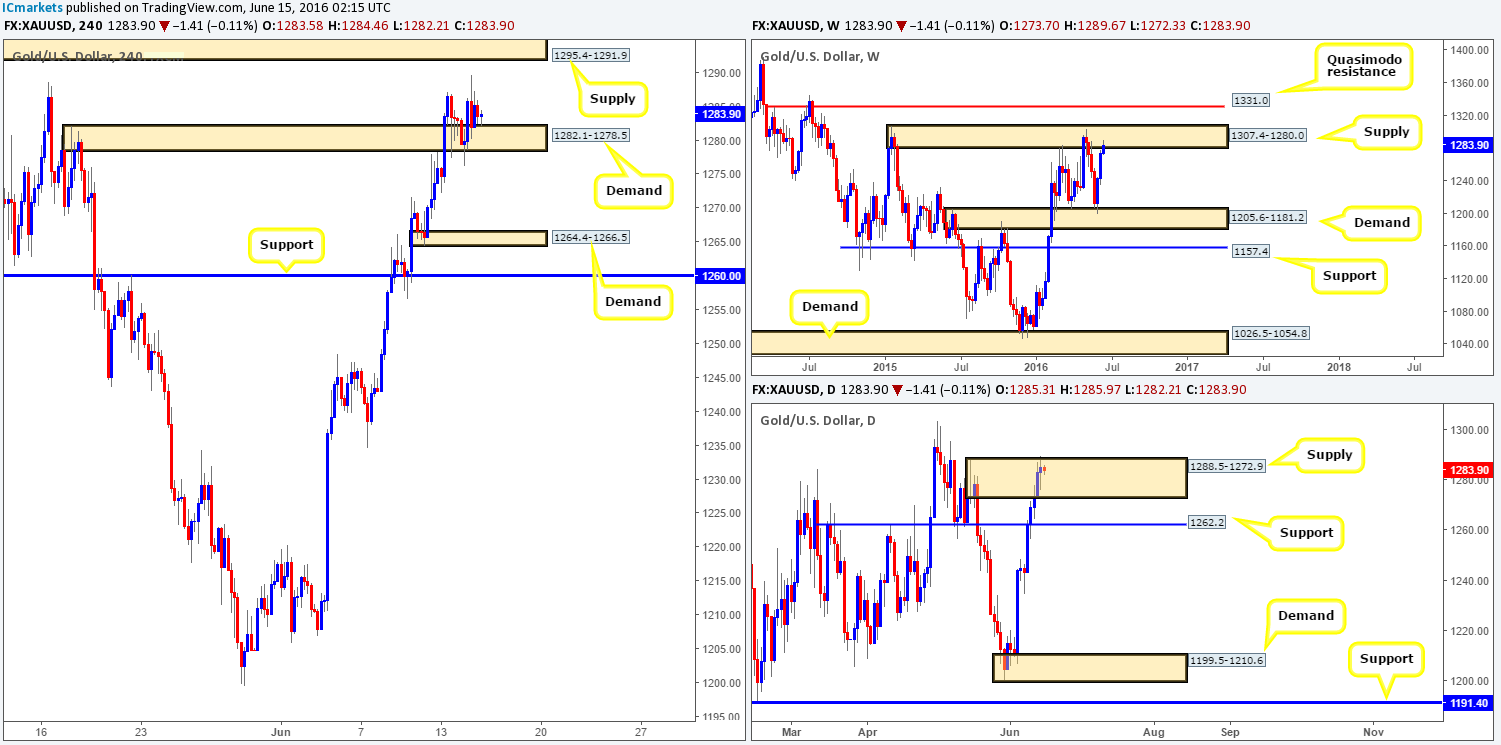
Levels to watch/live orders:
- Buys: Flat (Stop loss: N/A).
- Sells: Watch for price to consume 1282.1-1278.5 and look to trade any retest seen thereafter (lower timeframe confirmation required).


