Lower timeframe confirmation: is something we use a lot in our analysis. All it simply means is waiting for price action on the lower timeframes to confirm direction within a higher timeframe area. For example, some traders will not enter a trade until an opposing supply or demand area has been consumed, while on the other hand, another group of traders may only need a trendline break to confirm direction. As you can probably imagine, the list is endless. We, however, personally prefer to use the two methods of confirmation mentioned above in our trading.
EURUSD:
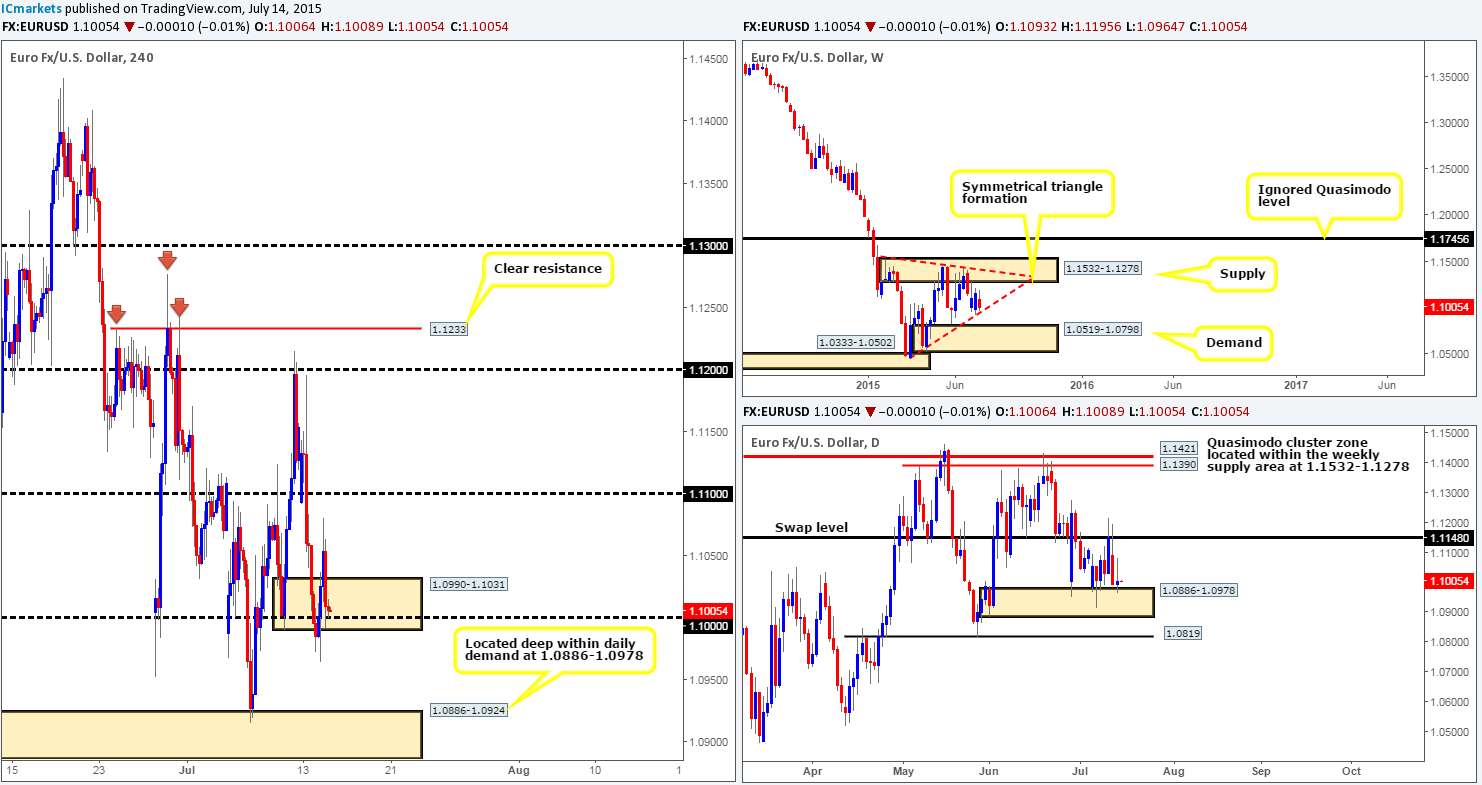
Following The close below the 4hr demand area at 1.0990-1.1031 yesterday, price launched itself north during London’s morning session reaching highs of 1.1080. From here, the buyers clearly ran out of steam as price reversed going into the U.S session, sending price back down to the 1.1000 handle located within the said 4hr demand area to close the day out at 1.1006.
The bigger picture remains the same as yesterday’s report – The weekly chart shows price hovering just above an ascending weekly trendline taken from the low 1.0468 (lower limit of a weekly symmetrical triangle formation), while on the daily chart price is seen floating just above a daily demand area coming in at 1.0886-1.0978.
Given the points made above, here is our two cents’ worth on where the EUR currency may head today:
- In the event that bids hold strong around the 1.1000 region, price could rally to test yesterday’s high, or even potentially fake above here and connect with the round number 1.1100. In the event that we manage to spot a lower timeframe confirmed signal around 1.1000 today, we’d confidently look to enter long here targeting 1.1080/1.1100.
- A move below 1.1000, however, has yesterday’s low 1.0964 to target. Should this low be taken out, we see very little reason why price will not continue south towards 4hr demand at 1.0886-1.0924. Considering this beauty is sitting deep within the aforementioned daily demand area, this would, in our opinion also be a place to look for confirmed long entries into this market today.
Levels to watch/live orders:
- Buys: 1.1000 [Tentative – confirmation required] (Stop loss: dependent on where one confirms this level).
- Sells: Flat (Stop loss: N/A).
GBP/USD:
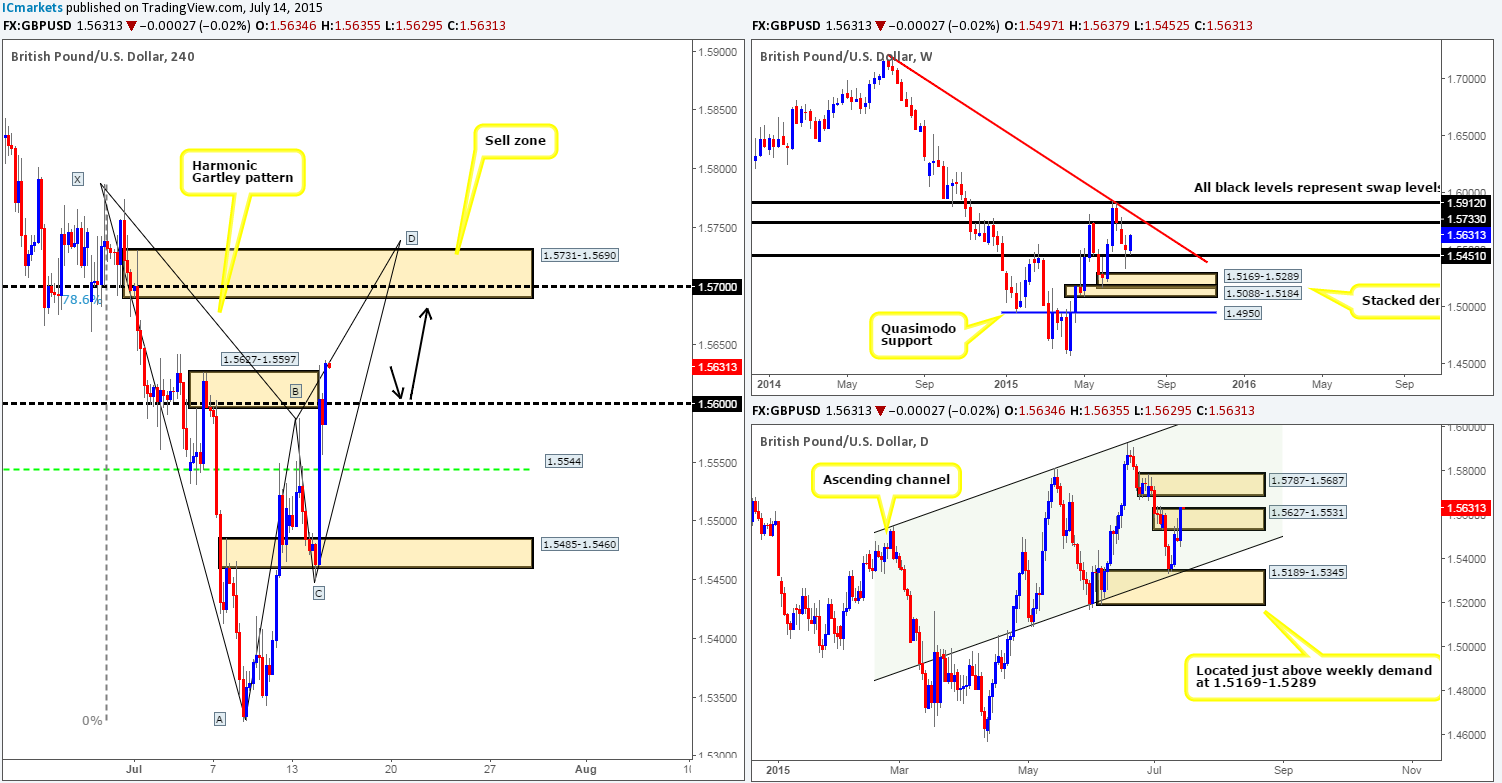
During the course of yesterday’s sessions, the GBP was heavily bid going into the London session from a 4hr swap area coming in at 1.5485-1.5460. This, as you can see, continued going into the U.S session which eventually forced price to close above a strong area of 4hr supply seen at 1.5627-1.5597.
This recent move has chiseled out the beginnings of a nice looking bearish Harmonic Gartley pattern which completes just above a 4hr supply area at 1.5731-1.5690 at 1.5739. This – coupled with the following points makes this one heavily confluent sell zone:
- Located very close to the weekly swap level at 1.5733.
- Positioned nicely within daily supply coming in at 1.5787-1.5687.
- Round number resistance seen at 1.5700.
Given the points made above, our team has decided to place a pending sell order at 1.5686 and a stop just above the high 1.5774 at 1.5778. Even with this relatively large stop, risk/reward is still favorable as we intend to follow Scott Carney’s trade management rules here (0.382 – move stop to breakeven and possibly take partial profits/0.618 take full profits).
Before this happens though, we’re obviously expecting this pair to rally today in order to reach our aforementioned sell zone. As such, we would consider buying this market if price retested the 1.5600 barrier as support, targeting the underside of the aforementioned 4hr supply area 1.5683 (as per black arrows). Waiting for lower timeframe buying confirmation here is highly recommended, as from our experience, round numbers are prone to fakeouts.
Levels to watch/ live orders:
- Buys: 1.5600 [Tentative – confirmation required] (Stop loss: dependent on where one confirms this level).
- Sells: 1.5686 (Stop loss: 1.5778).
AUD/USD:
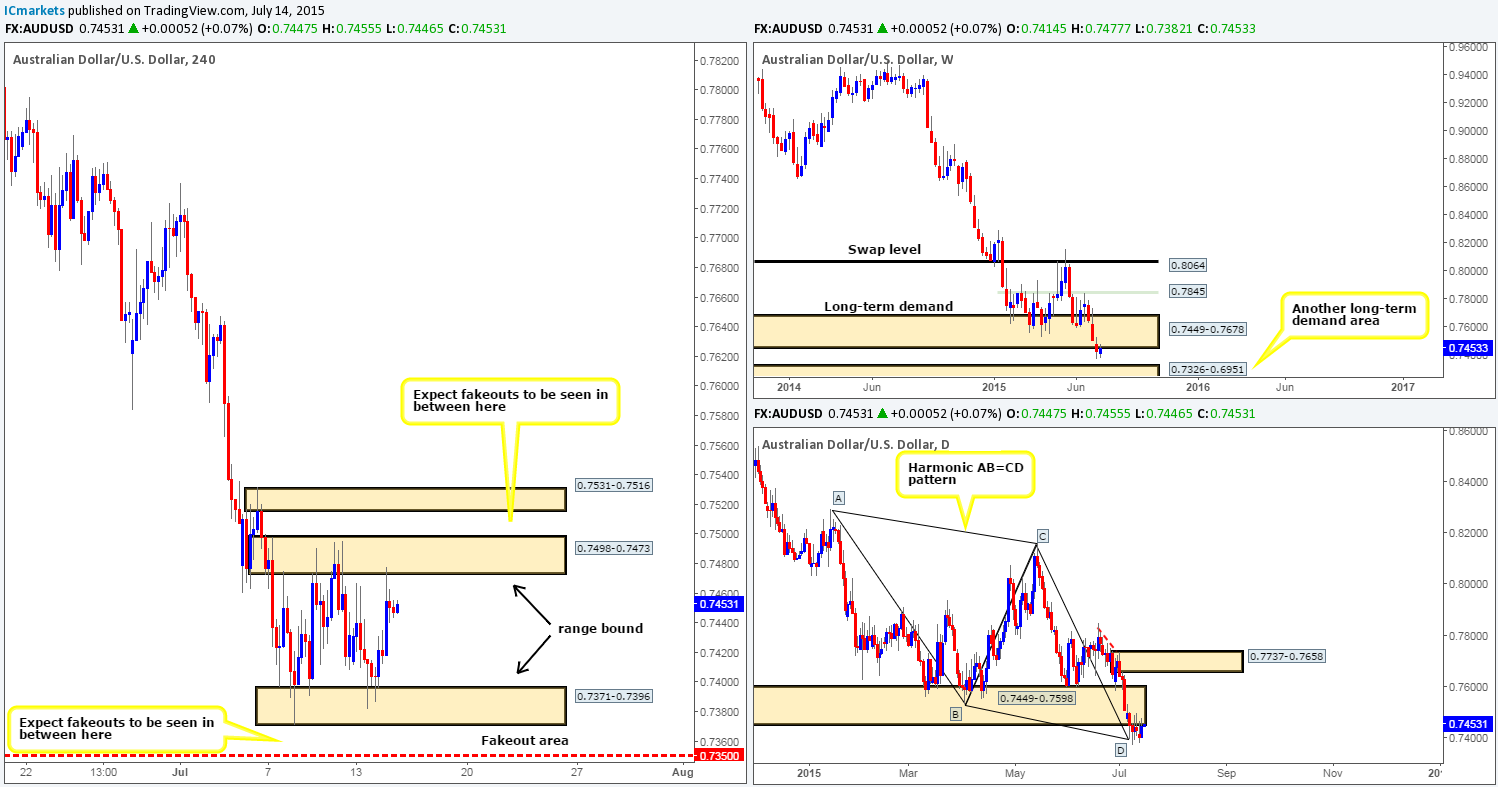
The higher timeframe picture remains relatively unchanged from yesterday’s analysis. Weekly price action shows price nibbling at the underside of a recently broken weekly demand area at 0.7449-0.7678. Meanwhile the daily timeframe is still seen sandwiched between daily demand (now acting supply) at 0.7449-0.7598 and a daily Harmonic support barrier from an AB=CD pattern which completes around the 0.7391 mark.
Recent action shows that price has entered into a phase of consolidation on the 4hr timeframe between 4hr demand at 0.7371-0.7396 and 4hr supply at 0.7498-0.7473. Given the points made above, trading the extremes of this 4hr range is certainly a viable plan today from where we’re standing (buys at 0.7398, sells at 0.7469). However, for us to be permitted to trade here there has to be some sort of lower timeframe confirming signal, since surrounding this 4hr consolidation zone is picture-perfect fakeouts areas. To the upside, there is a 4hr supply area at 0.7531-0.7516 just begging to be tagged into the action, and below we have the mid-level hurdle 0.7350, so do keep this in mind guys when considering a trade here.
Levels to watch/ live orders:
- Buys: 0.7398 [Tentative – confirmation required] (Stop loss: dependent on where one confirms this area).
- Sells: 0.7469 [Tentative – confirmation required] (Stop loss: dependent on where one confirms this area).
USD/JPY:
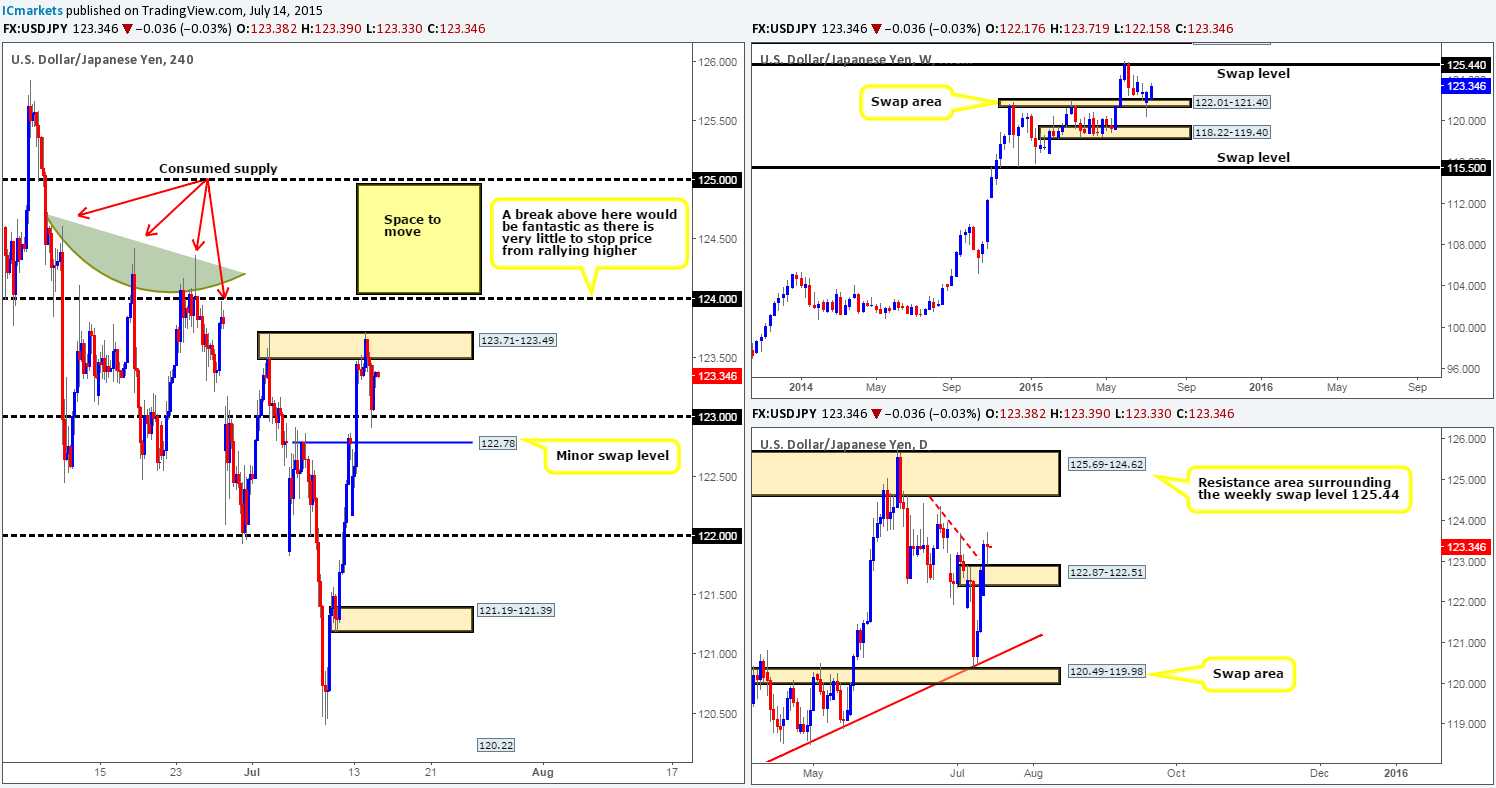
Recent events saw the USD/JPY pierce above the 4hr supply area at 123.71-123.49, sending this market south back down towards 123.00, which, as you can see, was clearly strong enough to support a counter-attack back up to the 123.40 mark.
Given that the weekly timeframe shows price is respecting the weekly swap area at 122.01-121.40, and the daily timeframe also revealing that price was able to hold above a recently broken daily supply area at 122.87-122.51, naturally we’re favoring longs over shorts at this time.
Nevertheless, as far as we can see, there are not any safe entries long into this market on the 4hr timeframe until price closes above 124.00, as above this barrier, there is very little active supply until price reaches 125.00, thus giving plenty of room for price to move into profits. Check out the supply consumption wicks seen marked with red arrows at: 123.97/124.36/124.43/124.61.
Levels to watch/ live orders:
- Buys: Flat (Stop loss: N/A).
- Sells: Flat (Stop loss: N/A).
USD/CAD:
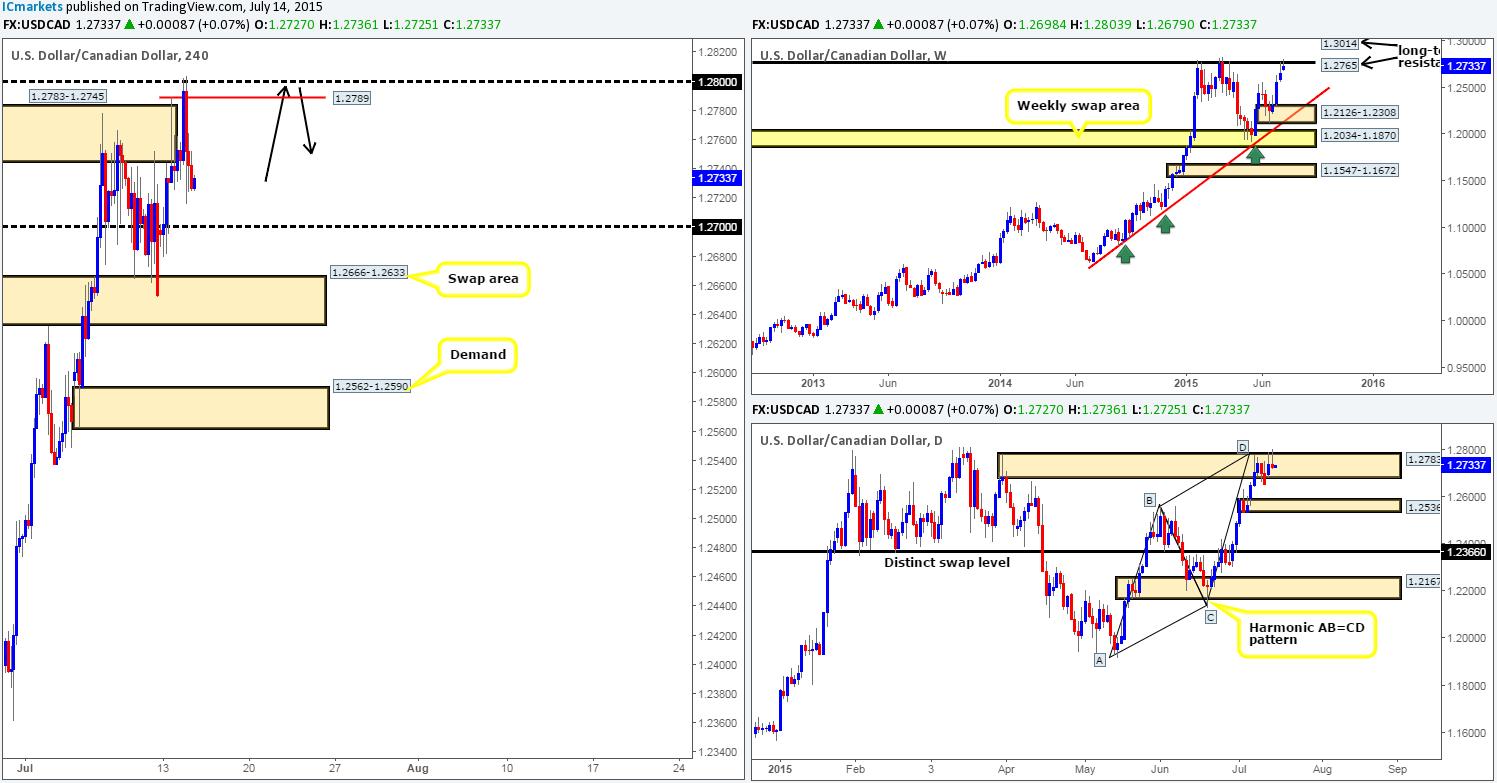
Yesterday’s action shows that price was heavily bid going into the early hours of the European/London session. This led to a break above 4hr supply at 1.2783-1.2745, which as you can see, connected almost to-the-pip with round number resistance 1.2800. From here, the market plunged south reaching lows of 1.2716 on the day.
The sell-off from this region should not really come as much of a surprise, since let’s not forget where price is positioned on the higher timeframe picture:
- Daily supply area at 1.2783-1.2682/Daily Harmonic AB=CD bearish pattern completion point at 1.2783.
- Long-term weekly Quasimodo resistance level at 1.2765.
Given the points made above, should price retrace back up to either the small 4hr Quasimodo resistance level at 1.2789 or the 1.2800 round number today, shorting is certainly a possibility as long as lower timeframe confirmation is also present (as per the black arrows). In the event that bids remain weak at current prices, price will likely trickle south to marry up with bids sitting around the near-term round number 1.2700, where we’ll patiently await the market’s next move.
Levels to watch/ live orders:
- Buys: Flat (Stop loss: N/A).
- Sells: 1.2789/1.2800 [Tentative – confirmation required] (Stop loss: dependent on where one finds confirmation).
USD/CHF:
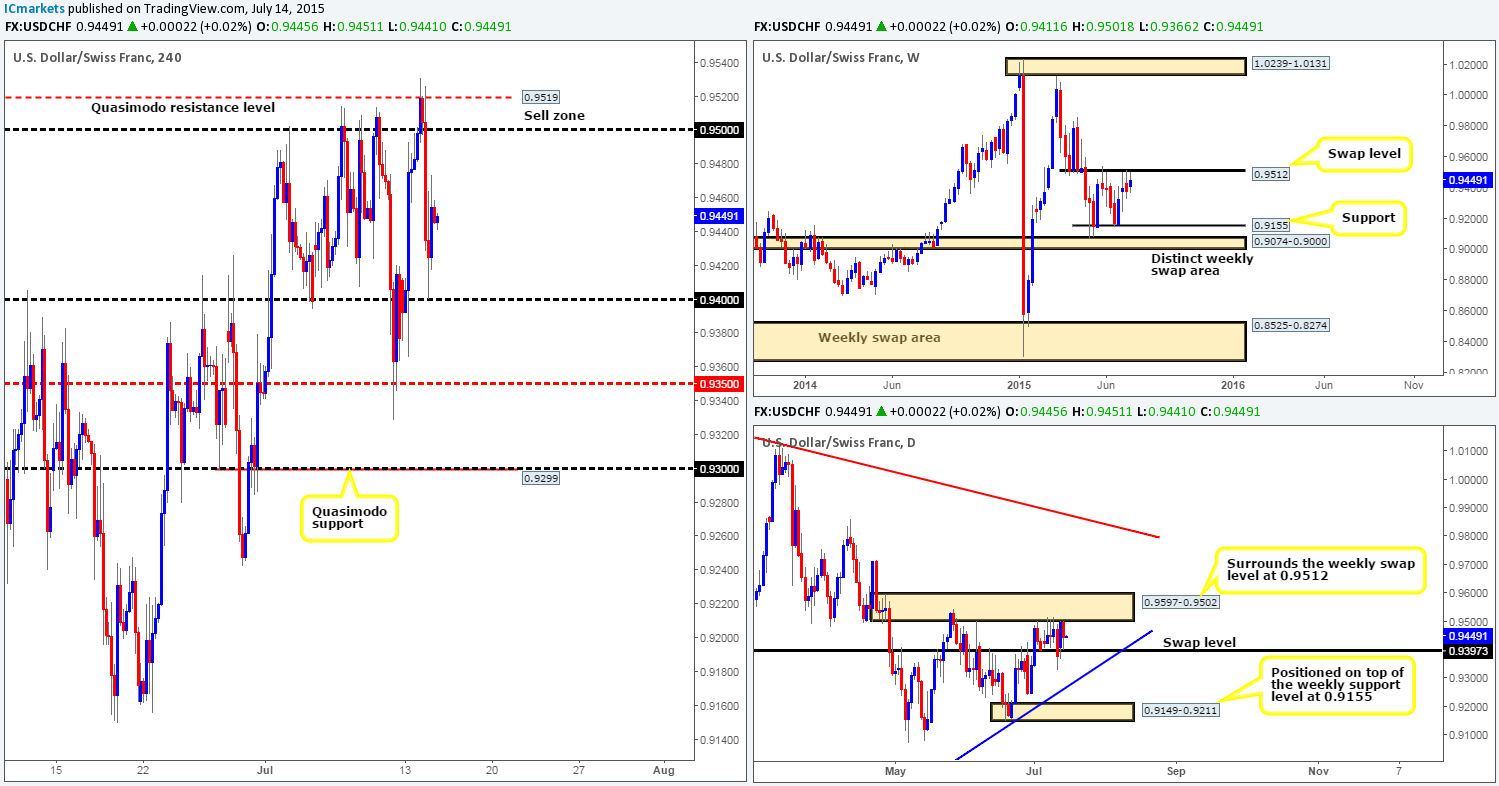
After the USD/CHF pair shook hands with the 4hr Quasimodo resistance level at 0.9519 yesterday, a strong wave of offers came into the market pushing price over 100 pips south into round number support 0.9400. We do hope some of our readers took part in this move as this was an area of interest we mentioned to keep an eye on for shorting opportunities yesterday.
With price now showing selling pressure from the weekly swap level 0.9512, and the daily action sandwiched between daily supply at 0.9597-0.9502 and a daily swap level at 0.9397, it is very difficult at this time for us to judge medium-term direction. Therefore, the best thing we believe we can do today is primarily stick to intraday setups. Levels we currently have noted down are as follows:
Bids:
- Round number 0.9400. The respect this level has seen in the past certainly makes this a barrier to have on your watchlist today. Furthermore, let’s also not forget that this number lines up perfectly with the daily swap level 0.9397.
- Mid-level number 0.9350. Granted this level is not as strong looking as its big brother 0.9400, but it did see a monumental move north from this area recently on the 10/07/15. Therefore, there may very well be some unfilled buy orders remaining here.
Offers:
- 0.9500/0.9519. Between these two levels price has been held lower on five separate occasions now, making this a strong area of importance.
Levels to watch/ live orders:
- Buys: 0.9400 [Tentative – confirmation required] (Stop loss: dependent on where one confirms this level) 0.9350 [Tentative – confirmation required] (Stop loss: dependent on where one confirms this level).
- Sells: 0.9500/0.9519 [Tentative – confirmation required] (Stop loss: dependent on where one confirms this zone).
DOW 30:
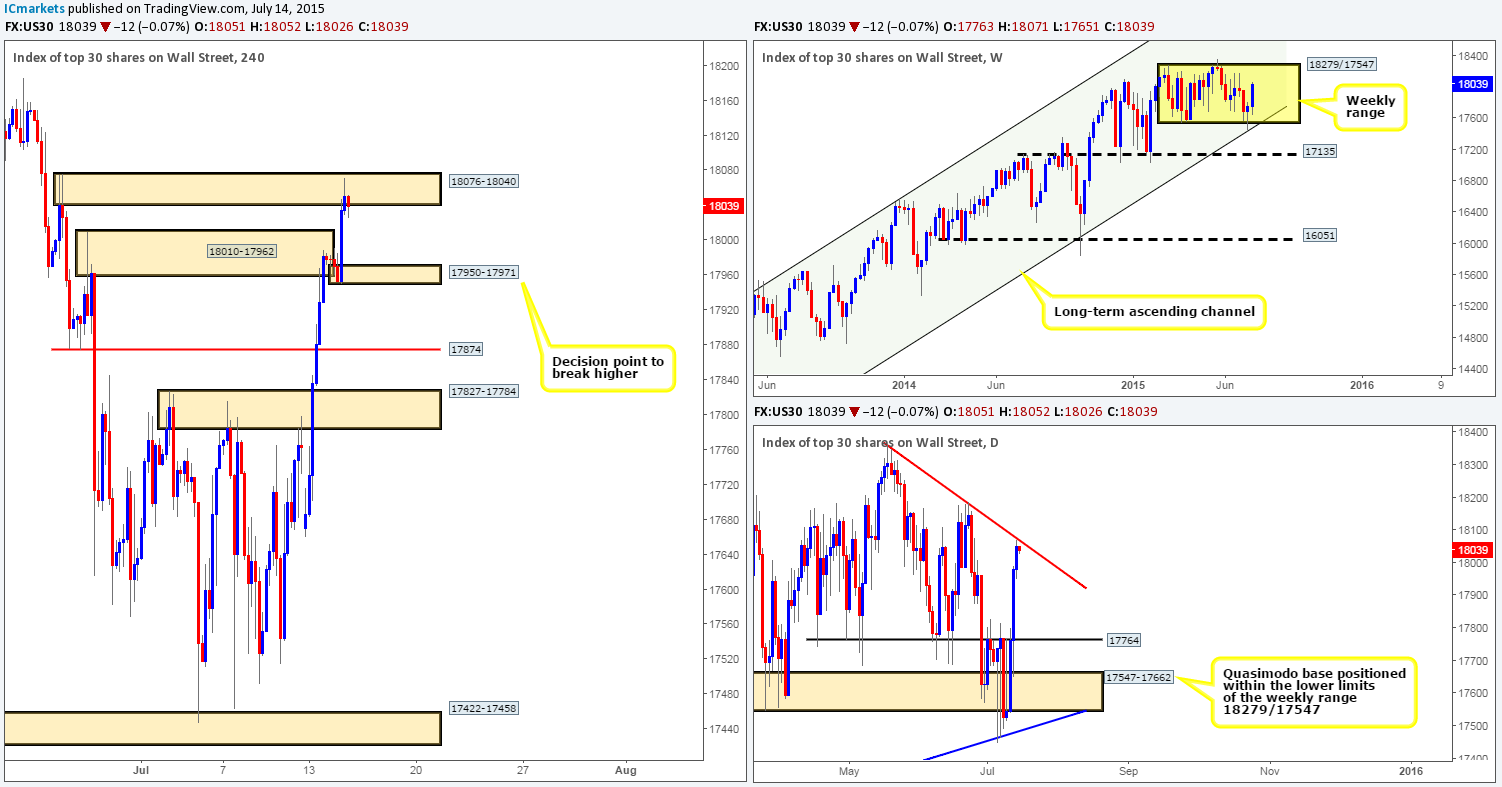
During the course of yesterday’s sessions, we can see that a heavy round of bids came into the market going into the U.S session. This, as you can see, demolished the 4hr supply area sitting at 18010-17962, and jabbed into another 4hr supply just above it at 18076-18040, which at the time of writing is holding firm.
Given the space seen below the current 4hr supply area, and the fact that it converges just beautifully with a daily downtrend line taken from the high 18365, it is certainly somewhere we’d consider a possible sell zone today. However, we have no interest in trading this zone at market due to the weekly timeframe showing price currently hovering mid-range between 18279/17547. Therefore, for us to be given the green light to go short at the current 4hr supply zone, we’d need to see very attractive lower timeframe confirming price action come into the market. Should we manage to find an entry short here, our stop-loss order will likely be placed above the zone at 18083, and as for our first take-profit target we’ll be looking down to the newly-formed 4hr demand area at 17950-17971.
Levels to watch/ live orders:
- Buys: Flat (Stop loss: N/A).
- Sells: 18076-18040 [Tentative – confirmation required] (Stop loss: 18083).
XAU/USD: (Gold)
Consequent to the lackluster performance seen during yesterday’s sessions, much of the following analysis will be similar to the previous.
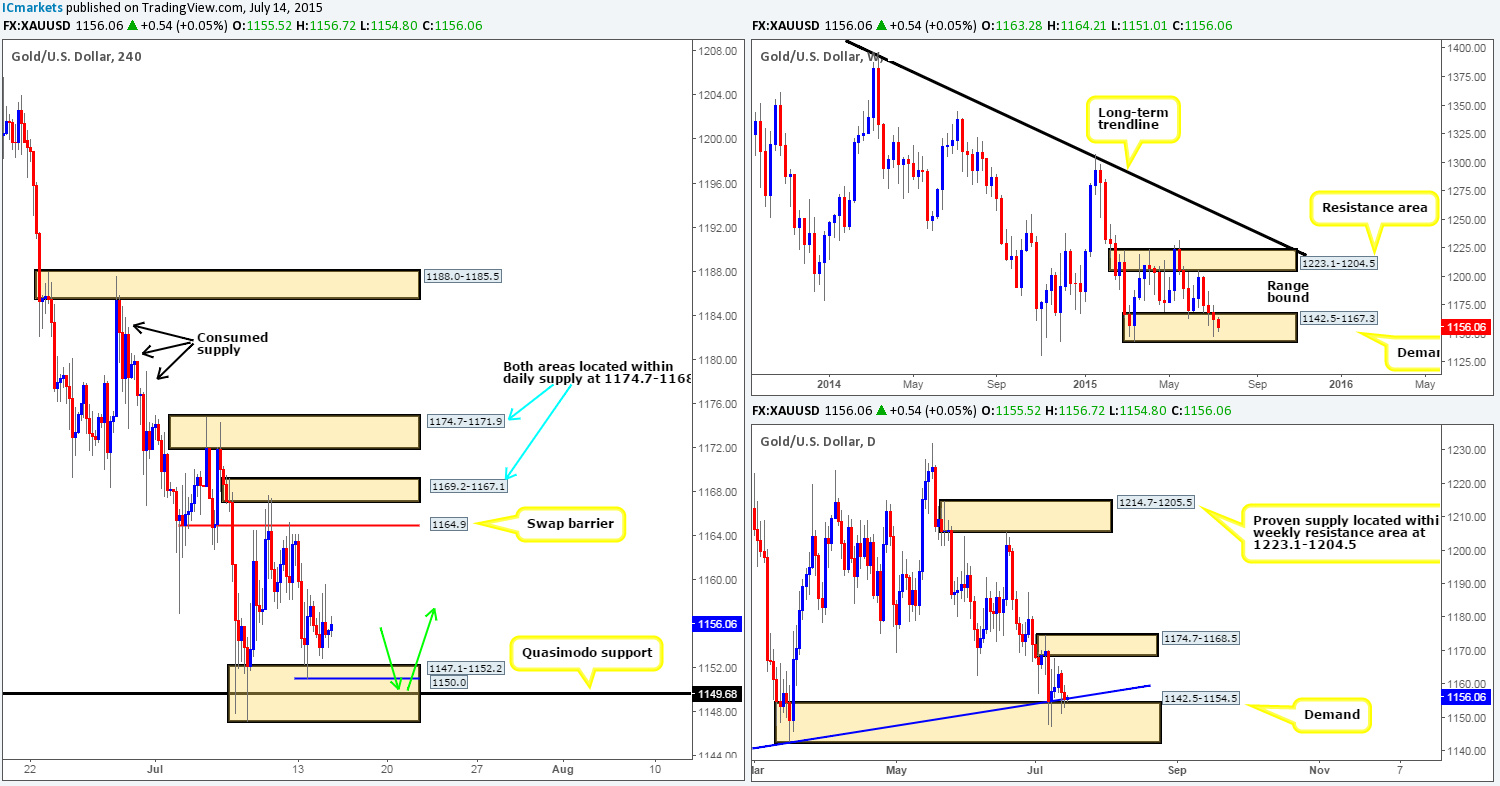
Although price is still currently loitering above the 4hr buy zone at 1147.1-1152.2, we still believe this to be a high-probability reversal point in the market for the following reasons:
- Located within weekly demand at 1142.5-1167.3.
- Located within daily demand at 1142.5-1154.5, which converges with a daily trendline extended from the low 1130.1.
- Converges with a 4hr Quasimodo support level at 1149.6.
As we mentioned yesterday, buying right now is not something we’re interested in since the risk/reward would be absolutely terrible. Therefore, we’re looking for a push back down into the aforementioned 4hr buy zone, which breaches the low 1150.0 and connects up with the aforementioned 4hr Quasimodo support level. We already know there were active buyers within this 4hr buy zone at one point, so a fake below the swing low into 4hr Quasimodo support could trigger another reversal. Lower timeframe confirmation (primarily the 1-15 min timeframes will be used) will need to be seen following a break lower, however, since we can never be sure how many willing buyers are left. Should we manage to spot a long signal here today, our stop will likely be placed below at 1145.3, and as for our first take-profit target it will ultimately be dependent on how price approaches our buy zone.
Levels to watch/ live orders:
- Buys: 1150.0/1149.6 [Tentative – confirmation required] (Stop loss: 1145.3).
- Sells: Flat (Stop loss: N/A).