EUR/USD:
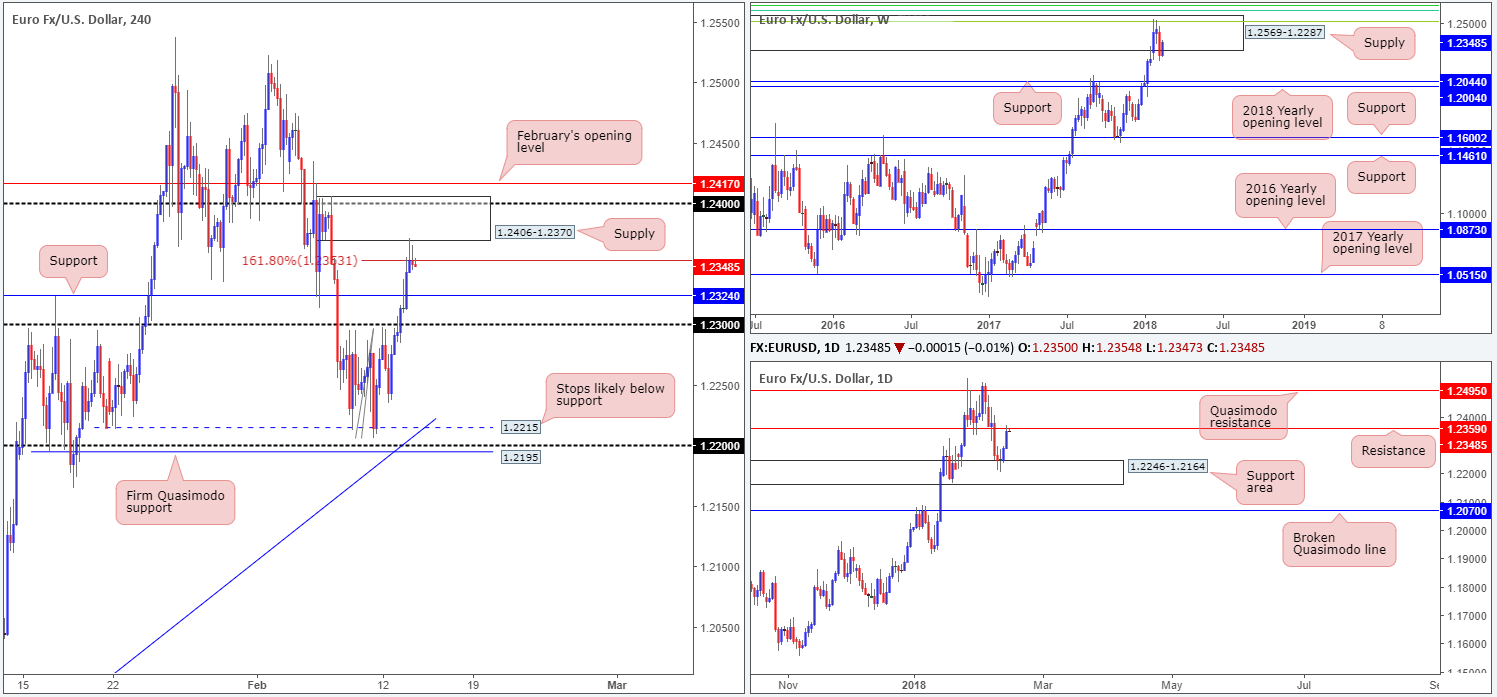
Daily resistance at 1.2359, as you can probably see, elbowed its way into the spotlight on Tuesday, after the euro extended gains for a third consecutive session. From a technical standpoint, the recent buying strength is somewhat of a surprise given weekly sellers printed a strong selling candle from within the walls of a weekly supply at 1.2569-1.2287 last week. Should price fail to defend the current daily resistance, the next point of interest on the daily scale can be seen at 1.2495: a daily Quasimodo resistance level that’s located within the upper limits of the noted weekly supply.
Over on the H4 candles, we can see that price dominated both the 1.23 handle and H4 resistance level at 1.2324 (now acting support) during yesterday’s advance. This allowed the unit to whipsaw through a H4 161.8% Fib ext. point at 1.2363 (can also be considered a H4 alternate AB=CD formation) and shake hands with a nearby FRESH H4 supply area coming in at 1.2406-1.2370.
Potential trading zones:
Technically speaking, the single currency is likely going to fade 1.2363 today and reconnect with the noted H4 support at 1.2324/1.23 handle. Our rationale behind this comes down to all three timeframes portending a downside move:
- Weekly supply in play at 1.2569-1.2287.
- Daily resistance level at 1.2359.
- The current H4 supply and H4 161.8% Fib ext.
The only grumble here is one will need to pin down a reasonably tight setup to take advantage of the potential move lower, since risk/reward needs to be taken into consideration.
Data points to consider: German prelim GDP q/q at 7am; German Buba President Weidmann speaks at 8am; EUR flash GDP q/q; US inflation and retail sales figures at 1.30pm GMT.
Areas worthy of attention:
Supports: 1.23 handle; 1.2324; 1.2215; 1.2246-1.2164.
Resistances: 1.2569-1.2287; 1.2359; 1.2406-1.2370; 1.2363.
GBP/USD:
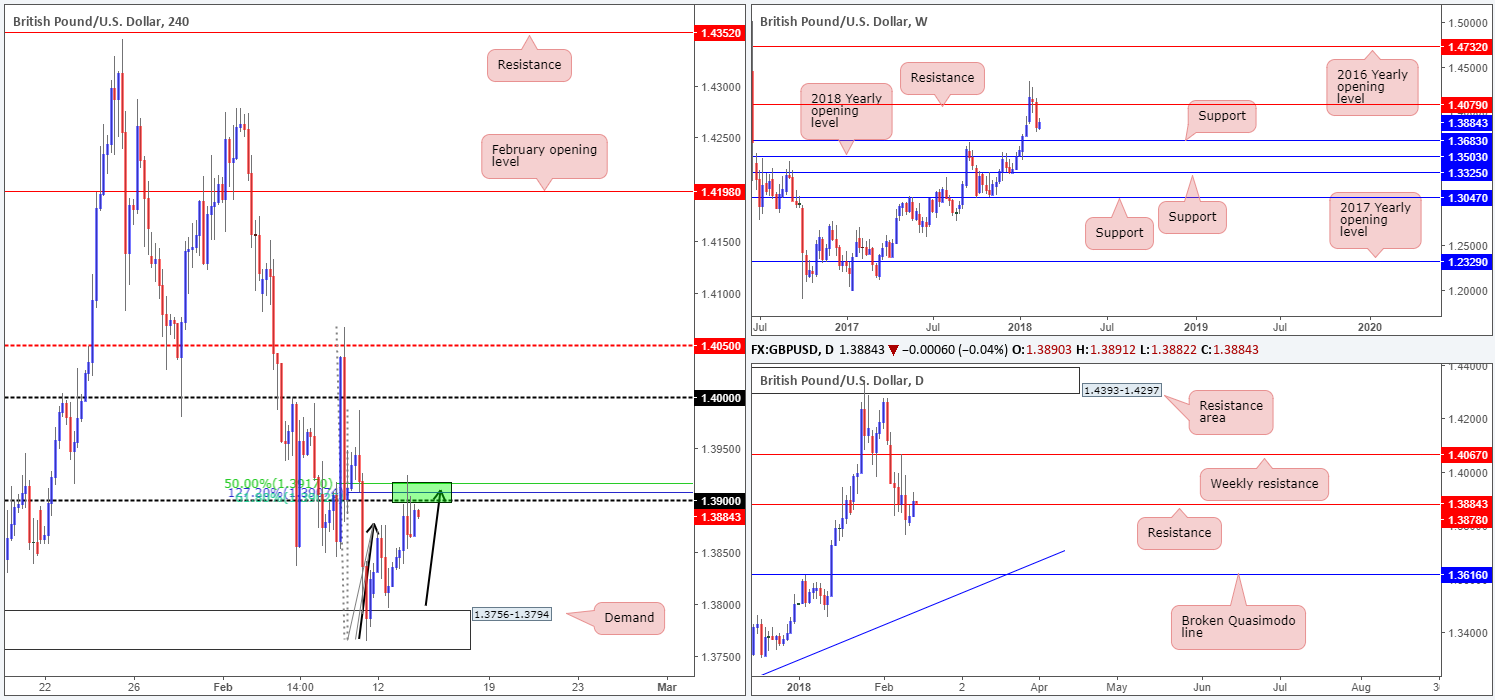
Despite climbing to session highs of 1.3942 in the wake of Tuesday’s UK inflation figures, the unit was incapable of sustaining upside beyond the 1.39 handle.
In Tuesday’s morning report, we highlighted a green H4 zone at 1.3917/1.39 as an area of importance (comprised of the round number 1.39, a 50.0% resistance value at 1.3917, a 61.8% Fib resistance at 1.3901 and an AB=CD [black arrows] 127.2% Fib ext. point at 1.3907). Apart from yesterday’s spike higher, this area has so far managed to hold ground.
Turning the attention to the bigger picture, weekly price shows room to stretch down to a support band coming in at 1.3683. Daily movement, although marginally closed above daily resistance at 1.3878 yesterday, continues to reflect a bearish stance, in our view. We say this for the reason that the close above the said resistance was not one of conviction, and resistance levels should ALWAYS be treated as zones rather than pre-defined price levels.
Potential trading zones:
1.3917/1.39 continues to be an area of importance on the H4 scale. Should a H4 full or near-full-bodied bearish candle print from this zone today, it’s a good indication that cable is heading back down to at least H4 demand plotted at 1.3756-1.3794. Stop-loss orders, however, would be best placed above Tuesday’s high, thus giving the trade some breathing room.
Data points to consider: US inflation and retail sales figures at 1.30pm GMT.
Areas worthy of attention:
Supports: 1.3756-1.3794; 1.3683.
Resistances: 1.3878; 1.3917/1.39.
AUD/USD:
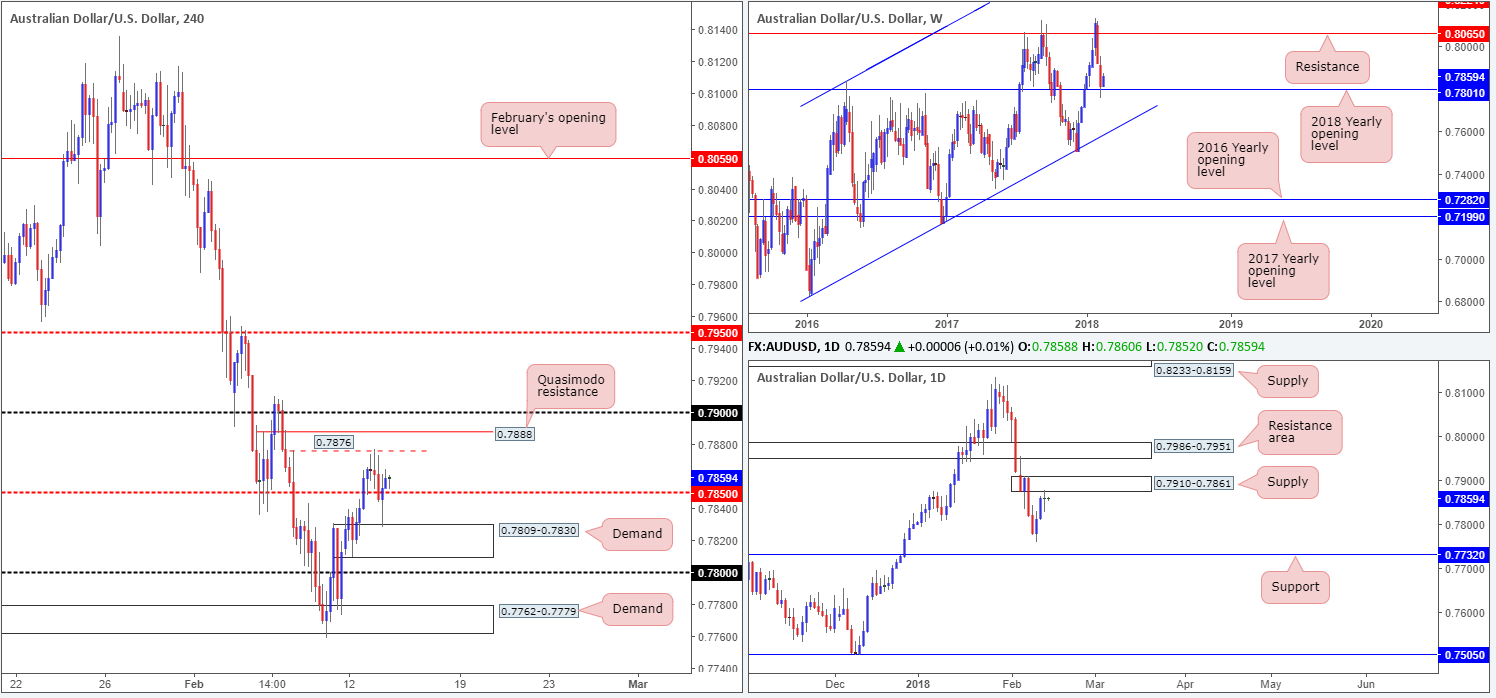
While weekly action is currently seen standing tall above the 2018 yearly opening level at 0.7801, daily movement recently checked in with a daily supply zone noted at 0.7910-0.7861 and printed somewhat of an indecision candle. This clearly places a question mark on this market in terms of medium-term direction.
A closer look on the H4 timeframe, however, shows that the unit stabbed through the H4 mid-level support at 0.7850 on Tuesday and crossed swords with a H4 demand base coming in at 0.7809-0.7830. This area, in our opinion, was likely the ‘decision point’ to push above 0.7850, so yesterday’s reaction should not come as too much of a surprise.
The local H4 resistance seen at 0.7876 is likely of interest to intraday traders today, given the near-to-the-pip reaction. Therefore, there will likely be stop-loss orders positioned directly above.
Potential trading zones:
With stop-loss orders likely lurking above 0.7876, a short from the nearby H4 Quasimodo resistance level plotted at 0.7888/0.79 handle could be an option today. In view of where these two levels are positioned on the daily timeframe (within the aforementioned daily supply), we feel stop-loss order placement is best situated beyond the walls of this daily zone. Should one take advantage of 0.79/0.7888 today, expect active buying to be present around 0.7850 (this is the initial port of call – it should not be the final take-profit target).
Data points to consider: US inflation and retail sales figures at 1.30pm GMT.
Areas worthy of attention:
Supports: 0.7809-0.7830; 0.7850; 0.7801.
Resistances: 0.7910-0.7861; 0.7876; 0.7888; 0.79 handle.
USD/JPY:
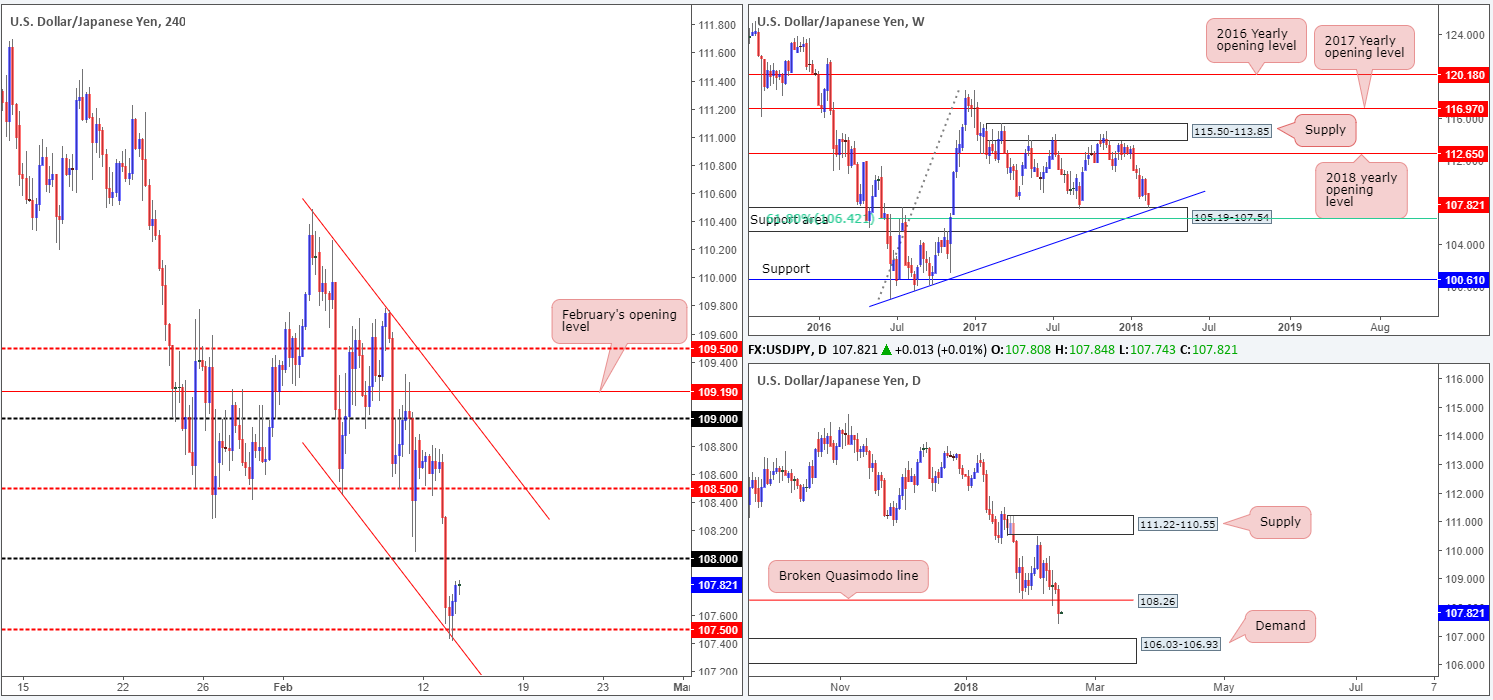
The USD/JPY experienced a weighty selloff amid Tuesday’s segment, and only really saw any refuge once the unit connected with the H4 mid-level support band at 107.50 (merges with a H4 channel support taken from the low 108.45). Perhaps the most compelling factor here, though, is the weekly support area at 105.19-107.54 was brought into the fray, which happens to intersect beautifully with a weekly trendline support etched from the low 98.78 and a weekly 61.8% Fib support at 106.42.
While we expect buyers to extend the mild correction seen from 107.50, it is still worth noting that over on the daily timeframe price recently conquered a daily Quasimodo support at 108.26 (now acting resistance). By and of itself, this may set the stage for a continuation move down to daily demand pegged at 106.03-106.93.
Potential trading zones:
Seeing as there is a major weekly support area in play right now, the 108 handle is likely going to be retested sometime during the course of today’s sessions. Given how close this number is situated, however, buying this market intraday could end in drawdown since active sellers are likely in wait here.
Even with a H4 close printed above 108, which on the H4 scale clears upside to 108.50, it is not a move we’d label a high-probability buy. The reason why simply comes down to the daily broken Quasimodo line at 108.26.
As you can see, despite weekly price suggesting a recovery could be in store, we’re finding it difficult to pin down an entry that allows a trade room to breathe.
Data points to consider: US inflation and retail sales figures at 1.30pm GMT.
Areas worthy of attention:
Supports: 107.50; H4 channel support; weekly trendline support; 105.19-107.54; 106.42; 106.03-106.93.
Resistances: 108 handle; 108.26.
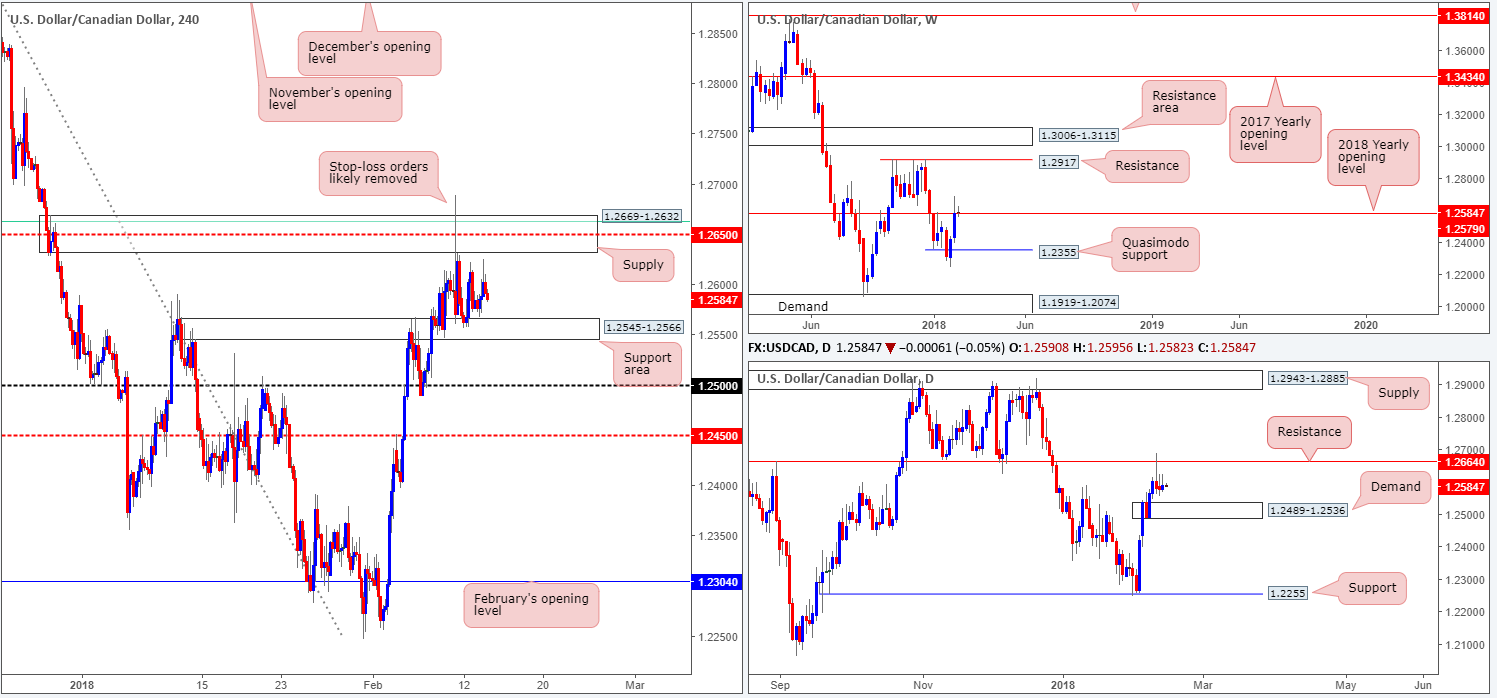
USD/CAD:
As you can see on the H4 timeframe this morning, structure has experienced little change so far this week. As such, much of the following will echo thoughts put forward in yesterday’s analysis.
H4 movement remains limited between H4 supply at 1.2669-1.2632 (houses a H4 61.8% Fib resistance at 1.2663 and H4 mid-level resistance at 1.2650) and a H4 support area coming in at 1.2545-1.2566.
Also in play is the daily resistance level planted at 1.2664 (seen fixed within the upper limits of the aforementioned H4 supply area). Downside from this angle is somewhat limited, though, given the nearby daily demand area seen at 1.2489-1.2536 (positioned just beneath the current H4 support area). In addition to the daily resistance, we can also see that the 2018 yearly opening band at 1.2579 is in view.
Potential trading zones:
Should H4 price revisit the noted H4 supply area today/this week, a short trade could still very well be an option. We say this simply because of the structures seen housed within.
However, seeing as how the H4 zone was faked on Friday, sellers may be guarded. Therefore, you may want to consider waiting for additional H4 candle confirmation in the form of a H4 full or near-full-bodied bearish candle to take shape. This way you can be reasonably confident sellers are involved and price will likely reach the nearby H4 support area at 1.2545-1.2566, thus giving enough room to reduce risk to breakeven.
Data points to consider: US inflation and retail sales figures at 1.30pm; Crude oil inventories at 3.30pm GMT.
Areas worthy of attention:
Supports: 1.2545-1.2566; 1.2489-1.2536; 1.2355.
Resistances: 1.2669-1.2632; 1.2664; 1.2579.
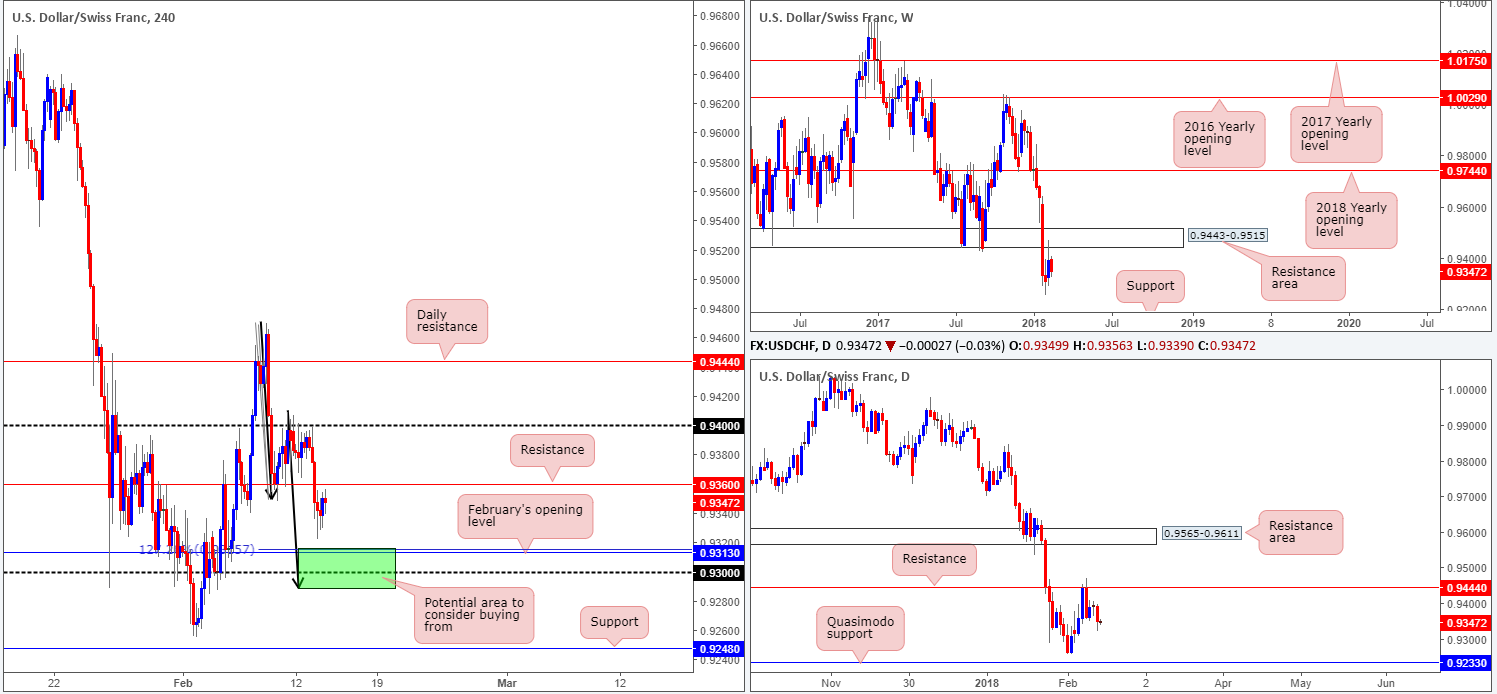
USD/CHF:
Following a revisit to the underside of the 0.94 handle on the H4 timeframe in the early hours of Tuesday’s segment, the Swissie fell to a session low of 0.9322. As you can see, the H4 candles bottomed just ahead of a rather interesting area of support, comprised of February’s opening level at 0.9313, a 127.2% H4 Fib ext. point at 0.9315, the 0.93 handle and the H4 AB=CD (see black arrows) completion point at 0.9288 (green zone).
Both weekly and daily structure, however, shows space to move south. Weekly price has the support level at 0.9163 to target, whereas daily price has the Quasimodo support at 0.9233 in its range.
Potential trading zones:
The H4 green zone is, despite higher-timeframe structure suggesting lower prices, still a point of interest given its confluence. Nevertheless, in order to buy from this zone, waiting for a H4 full or near-full-bodied bull candle is advised. This will help identify buyer intent. First take-profit target from this range can be seen around the 0.9360ish point, with stops best placed beyond the H4 rejection candle’s low.
Data points to consider: US inflation and retail sales figures at 1.30pm; Gov. Board member Zurbrugg speaks at 8.50am/11.20am GMT.
Areas worthy of attention:
Supports: 0.93 handle; 0.9288; 0.9313; 0.9315; 0.9233; 0.9163.
Resistances: 0.9360; 0.9444; 0.9443-0.9515.
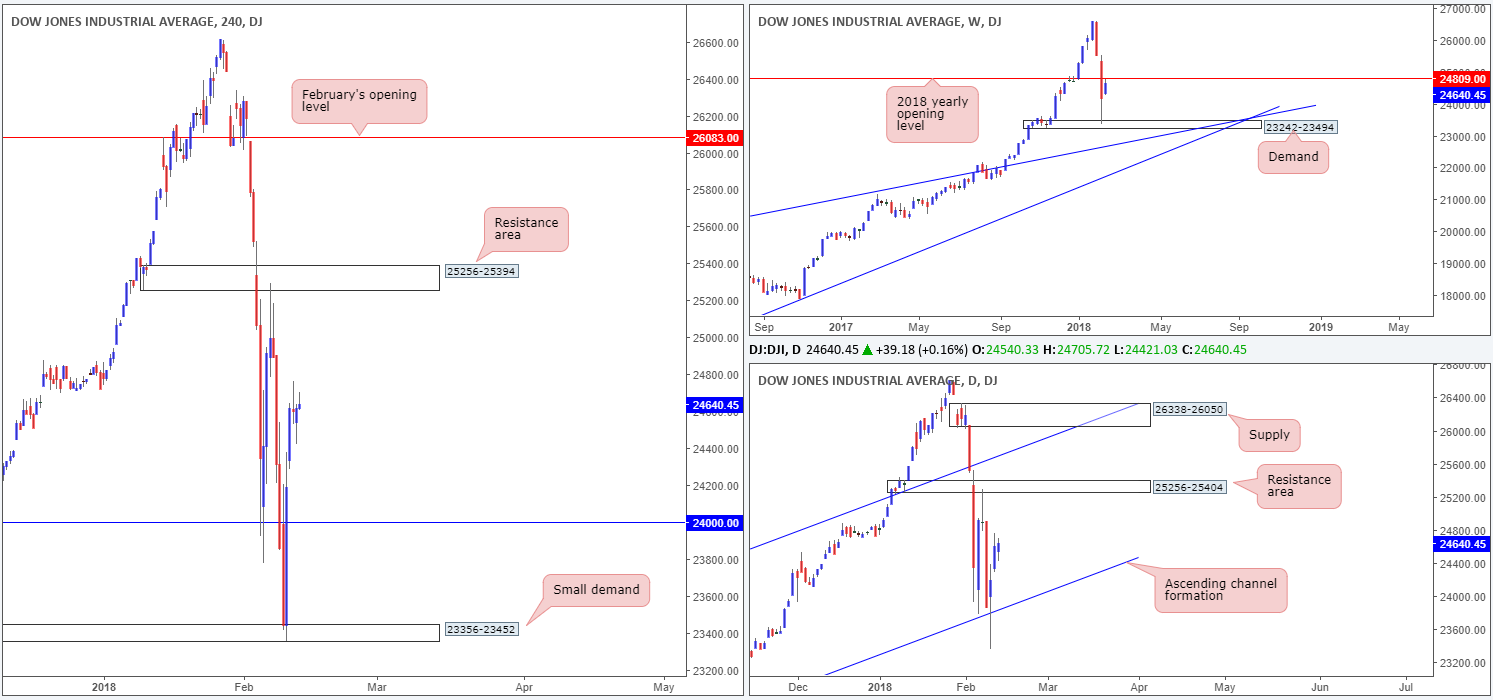
DOW 30:
The Dow Jones Industrial Average extended gains on Tuesday, adding 39 points of value and settling at 24640. Once again, all three major US indexes closed in the green.
While both H4 and daily structures show room to advance (H4 price has the H4 resistance area at 25256-25394 to target, which is lodged within a daily resistance area coming in at 25256-25404), the index is trading within close proximity to the 2018 yearly opening level seen on the weekly timeframe at 24809. This could pull the unit back down to the 24K mark (held as support in recent trade), which aligns with a daily channel support extended from the low 17883.
Potential trading zones:
Should the H4 unit retest 24K as support today, a long trade could be an option (targeting the H4 resistance area at 25256-25394) as long as H4 price proves buyer intent here. What we mean by this is simply waiting for a H4 full or near-full-bodied bull candle to form, before pulling the trigger. That way you help avoid an unnecessary loss!
Data points to consider: US inflation and retail sales figures at 1.30pm GMT.
Areas worthy of attention:
Supports: Daily channel support; 23242-23494; 23356-23452; 24000.
Resistances: 25256-25394; 25256-25404; 24809.
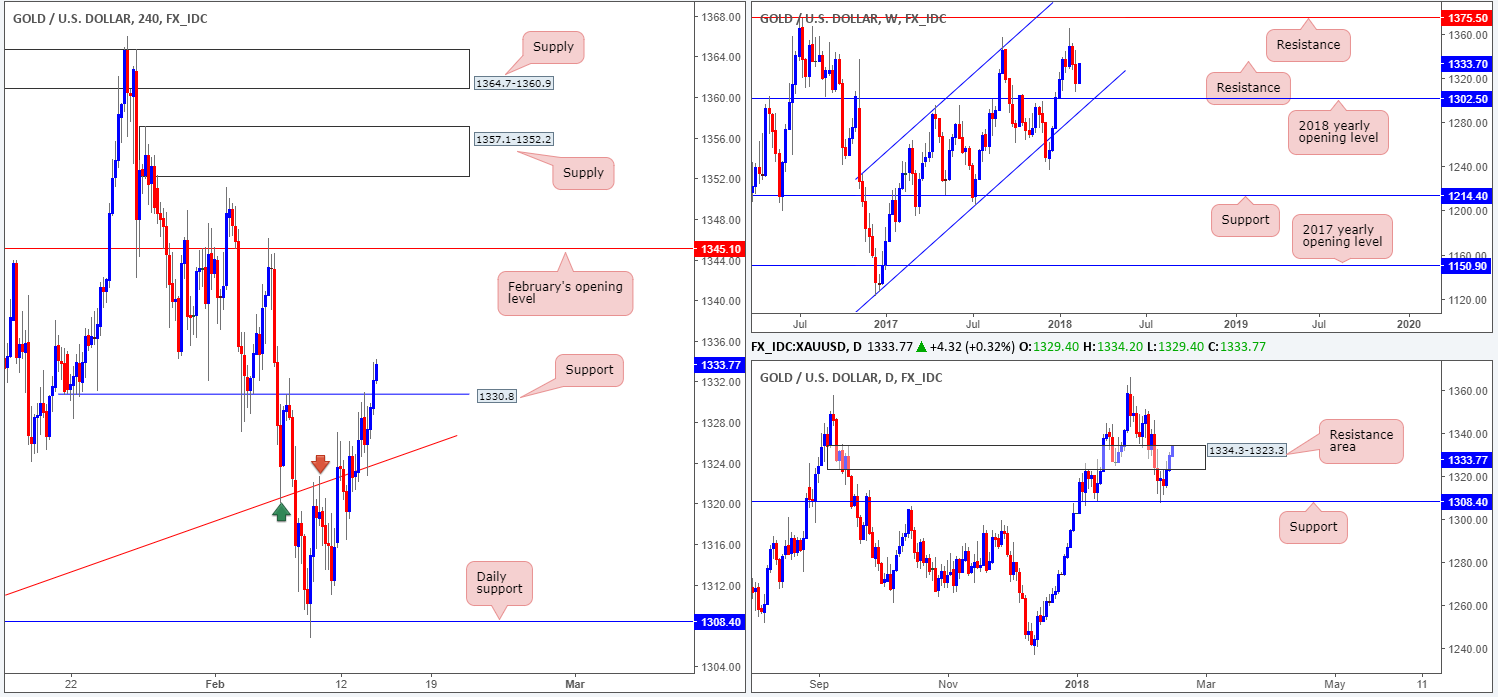
GOLD:
The yellow metal extended gains for a second consecutive session on Tuesday, on the back of a waning US dollar.
H4 movement, as you can see, retested the trendline extended from the low 1305.6 and eventually engulfed the nearby H4 resistance level drawn from 1330.8. With this level out of the picture and likely to offer support in the future, the team’s crosshairs are locked on February’s opening level plotted at 1345.1.
Daily price, on the other hand, is seen teasing the top edge of a daily resistance area at 1334.3-1323.3. A violation of this top would likely open the doors to higher prices. On the daily timeframe, however, we do not see any active supply to the left of current price, which could indicate that weekly buyers will be free to pull the unit up as far north as the weekly resistance level at 1375.5. This could, nevertheless, take a few weeks to come to fruition.
Potential trading zones:
With the daily resistance area not yet out of view, buying this market (even on a successful retest of H4 support at 1330.8) is not a trade setup we would label high probability. Buying, at least from our technical view, is only something to consider upon witnessing a DAILY close higher.
On account of the above structures, opting to remain on the sidelines today may be the better path to take.
Areas worthy of attention:
Supports: H4 trendline support; 1330.8.
Resistances: 1345.1; 1334.3-1323.3; 1375.5.
This site has been designed for informational and educational purposes only and does not constitute an offer to sell nor a solicitation of an offer to buy any products which may be referenced upon the site. The services and information provided through this site are for personal, non-commercial, educational use and display. IC Markets does not provide personal trading advice through this site and does not represent that the products or services discussed are suitable for any trader. Traders are advised not to rely on any information contained in the site in the process of making a fully informed decision.
This site may include market analysis. All ideas, opinions, and/or forecasts, expressed or implied herein, information, charts or examples contained in the lessons, are for informational and educational purposes only and should not be construed as a recommendation to invest, trade, and/or speculate in the markets. Any trades, and/or speculations made in light of the ideas, opinions, and/or forecasts, expressed or implied herein, are committed at your own risk, financial or otherwise.
The use of the site is agreement that the site is for informational and educational purposes only and does not constitute advice in any form in the furtherance of any trade or trading decisions.
The accuracy, completeness and timeliness of the information contained on this site cannot be guaranteed. IC Markets does not warranty, guarantee or make any representations, or assume any liability with regard to financial results based on the use of the information in the site.
News, views, opinions, recommendations and other information obtained from sources outside of www.icmarkets.com.au, used in this site are believed to be reliable, but we cannot guarantee their accuracy or completeness. All such information is subject to change at any time without notice. IC Markets assumes no responsibility for the content of any linked site. The fact that such links may exist does not indicate approval or endorsement of any material contained on any linked site.
IC Markets is not liable for any harm caused by the transmission, through accessing the services or information on this site, of a computer virus, or other computer code or programming device that might be used to access, delete, damage, disable, disrupt or otherwise impede in any manner, the operation of the site or of any user’s software, hardware, data or property.


