EUR/USD:
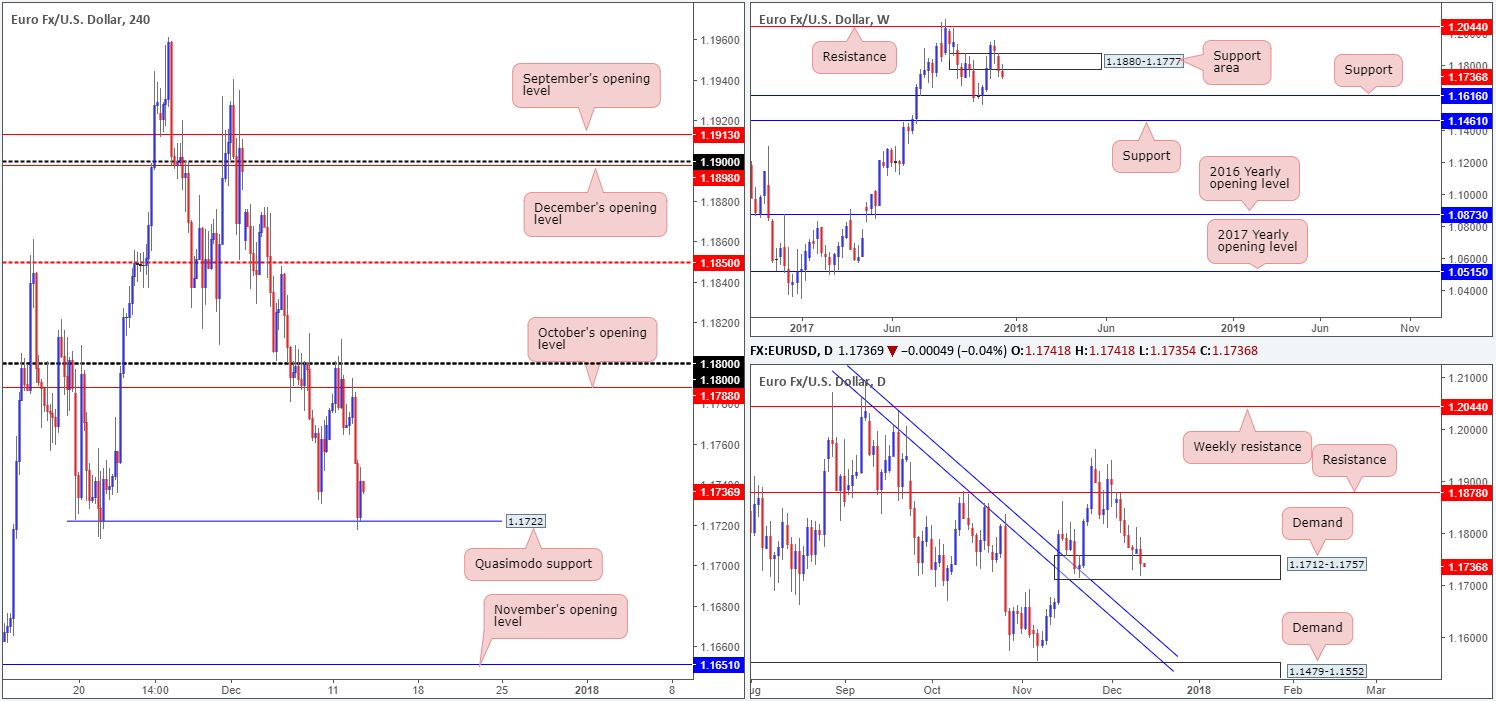
The euro, as you can see, came under pressure on Tuesday after retesting October’s opening level seen on the H4 timeframe at 1.1788. The selloff received additional fuel on the back of stronger-than-expected US PPI data, forcing the unit to connect with a H4 Quasimodo support coming in at 1.1722, which held firm and mildly pared losses into the close.
Turning our attention over to the weekly timeframe, we can see the weekly support area at 1.1880-1.1777 has, more or less, been consumed. This, technically speaking, likely opens up the path south down to as far as weekly support drawn from 1.1616. Before this level can be challenged, though, daily demand at 1.1712-1.1757 will need to be taken out.
Direction:
- Long: Buying on the basis of the current H4 Quasimodo support located within the aforesaid daily demand is certainly noteworthy. The only drawback, of course, is the fact that weekly price indicates further selling might be on the cards. Should a long be initiated, however, taking profits around the 1.1777 mark (underside of weekly zone) could be an idea since strong sellers likely reside here.
- Short: Although weekly price suggests selling this market, shorting into H4 and daily structure is not considered a high-probability trade. The better sell would be on the break of these opposing levels.
In addition to the above, the FOMC will announce its interest-rate decision later on today. With a rate hike expected, economic projections and the tone of the statement will play a key role in today’s movement.
Data points to consider: US CPI figures at 1.30pm; FOMC interest-rate decision, economic projections and statement at 7pm; FOMC press conference at 7.30pm; FOMC member Brainard speaks at 11pm GMT.
Areas worthy of attention:
Supports: 1.1722; 1.1880-1.1777; 1.1712-1.1757.
Resistances: 1.1788; 1.18 handle.
GBP/USD:
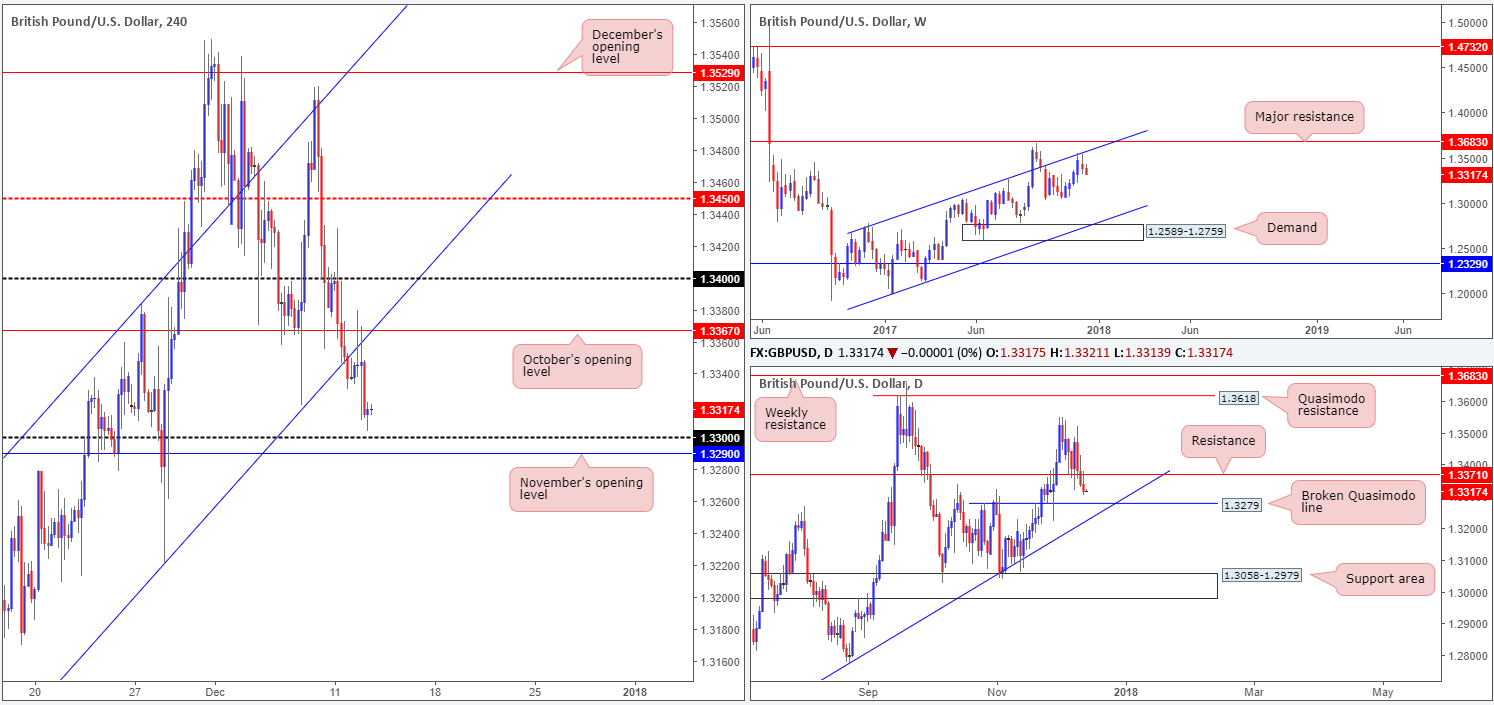
Coming in from the top this morning, we can see that weekly price continues to paint a bearish image from the weekly channel resistance extended from the high 1.2673. According to the daily timeframe, further selling is likely to be seen up until the candles shake hands with a nearby broken daily Quasimodo support at 1.3279, which is positioned directly above a daily trendline support taken from the low 1.2108.
Across on the H4 timeframe, the pair retested the underside of October’s opening level at 1.3367/H4 channel support-turned resistance taken from the low 1.3061 (a highlighted setup in Tuesday’s outlook), and tumbled lower. This would have been a tricky move to sell since price connected with these levels following better-than-expected UK inflation numbers!
Direction:
- Long: The pair concluded the day bottoming just ahead of the 1.33 handle/November’s opening level at 1.3290 (H4 timeframe). For that reason, these levels are likely under the spotlight for many traders this morning. With that said, however, it might be worth noting that a potential fakeout through these levels is a possibility, as directly below we have the aforementioned daily broken Quasimodo level. Adding to this, we also have selling pressure from the weekly timeframe to contend with. Therefore, trading long from the 1.33 region is not a trade that’s considered high probability.
- Short: Despite weekly price trading from a concrete resistance, selling this market is a minefield. Besides the current H4 supports in view, just beyond that, as highlighted above, we have a daily support! As you can see, this is not really ideal selling conditions!
Data points to consider: UK employment figures at 9.30am; US CPI figures at 1.30pm; FOMC interest-rate decision, economic projections and statement at 7pm; FOMC press conference at 7.30pm; FOMC member Brainard speaks at 11pm GMT.
Areas worthy of attention:
Supports: 1.33 handle; 1.3290; 1.3279; daily trendline support taken from the low 1.2108.
Resistances: 1.3367; 1.3371; weekly channel resistance taken from the high 1.2673; H4 channel support-turned resistance extended from the low 1.3061.
AUD/USD:
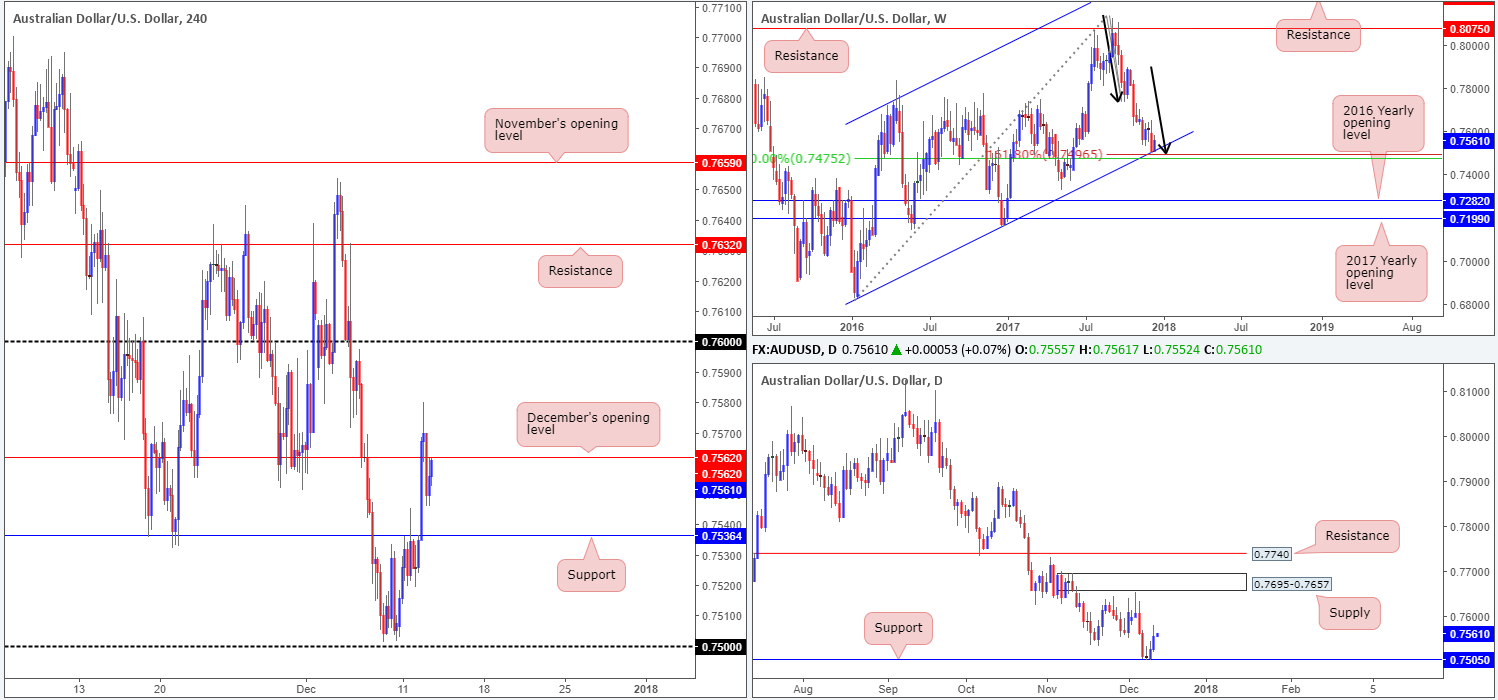
The AUD/USD managed to extend gains on Tuesday; consequently surpassing December’s opening level seen on the H4 timeframe at 0.7562 and reaching a session high of 0.7580. It was at this point, things started to turn sour for the commodity currency. Helped by better-than-expected US PPI data, H4 price mildly pared gains as we entered the US segment, forcing the unit to retreat back below Dec’s open line into the close.
Technically speaking, the recent upside move is likely due to a daily support at 0.7505 and the weekly channel support extended from the low 0.6827(merges closely with a weekly 50.0% value at 0.7475 taken from the high 0.8125, and a nice-looking weekly AB=CD [see black arrows] 161.8% Fib ext. point situated at 0.7496) currently in play. Adding to this, we do not see much higher-timeframe structure stopping the unit from adding to recent gains, since the next logical area of resistance does not come into the firing range until the daily supply zone pegged at 0.7695-0.7657.
Direction:
- Long: Ultimately, further buying is likely on the cards, despite H4 price currently finding resistance beneath Dec’s opening level at the moment. A decisive H4 close above this line, followed up with a reasonably strong retest would, in our opinion, be enough to attract fresh buyers into the market, targeting the 0.76 handle and possibly beyond.
- Short: Selling at current price is tempting since monthly opening levels usually do such a good job of holding price. However, when faced with higher-timeframe opposition, these levels tend to fatigue easily.
Data points to consider: US CPI figures at 1.30pm; FOMC interest-rate decision, economic projections and statement at 7pm; FOMC press conference at 7.30pm; FOMC member Brainard speaks at 11pm GMT.
Areas worthy of attention:
Supports: weekly channel support extended from the low 0.6827; weekly AB=CD 161.8% Fib ext. point situated at 0.7496; 07505; 0.7536.
Resistances: 0.7562; 0.76 handle; 0.7695-0.7657.
USD/JPY:
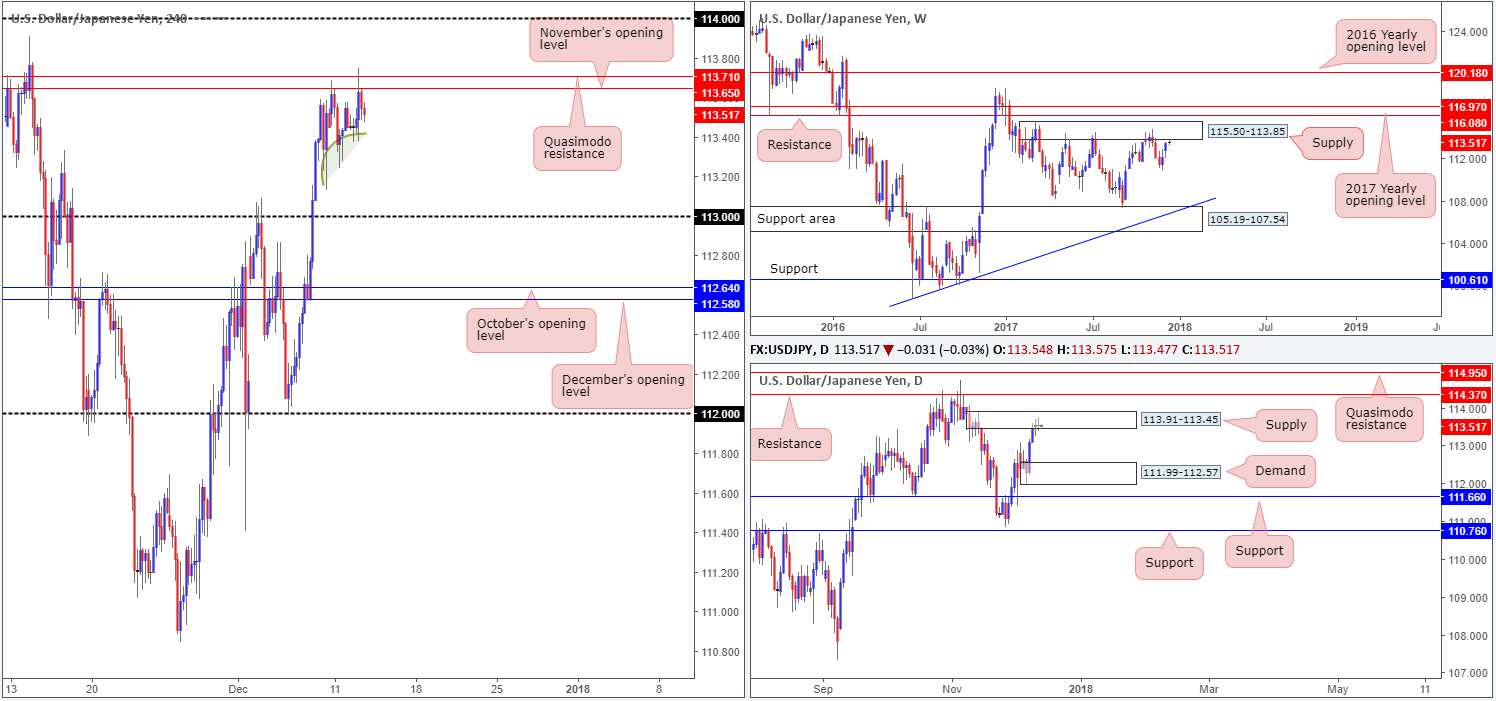
In recent trading, H4 action lifted the pair to highs of 113.75 on the back of upbeat US PPI data. As can be seen from the H4 timeframe, however, price failed to sustain gains beyond 113.71/113.65 (H4 Quasimodo resistance/November’s opening line) going into the US session and retreated to lows of 113.37.
For those who read previous reports, you may recall that we highlighted 113.71/113.65 as a potential resistance zone. As these two levels are drawn within the current daily supply zone sited at 113.91-113.45, and knowing that this daily supply is bolstered by a weekly supply fixed at 115.50-113.85, it was not surprising to see the H4 base hold firm for second time.
Direction:
- Long: It’d be very risky to buy into current structure, despite the latest swing north!
- Short: Well done to those already short from 113.71/113.65. Most have likely placed stops above the current daily supply at 113.93. Given that H4 demand appears incredibly consumed beneath current price (check out the H4 buying tails marked with a green arc), traders may want to consider holding out for the 113 handle and quite possibly the daily demand base seen at 111.99-112.57 (positioned nearby December/October’s opening levels on the H4 timeframe at 112.58/112.64).
Data points to consider: US CPI figures at 1.30pm; FOMC interest-rate decision, economic projections and statement at 7pm; FOMC press conference at 7.30pm; FOMC member Brainard speaks at 11pm GMT.
Areas worthy of attention:
Supports: 113 handle; 111.99-112.57.
Resistances: 113.65; 113.71; 114 handle; 113.91-113.45; 115.50-113.85.
USD/CAD:
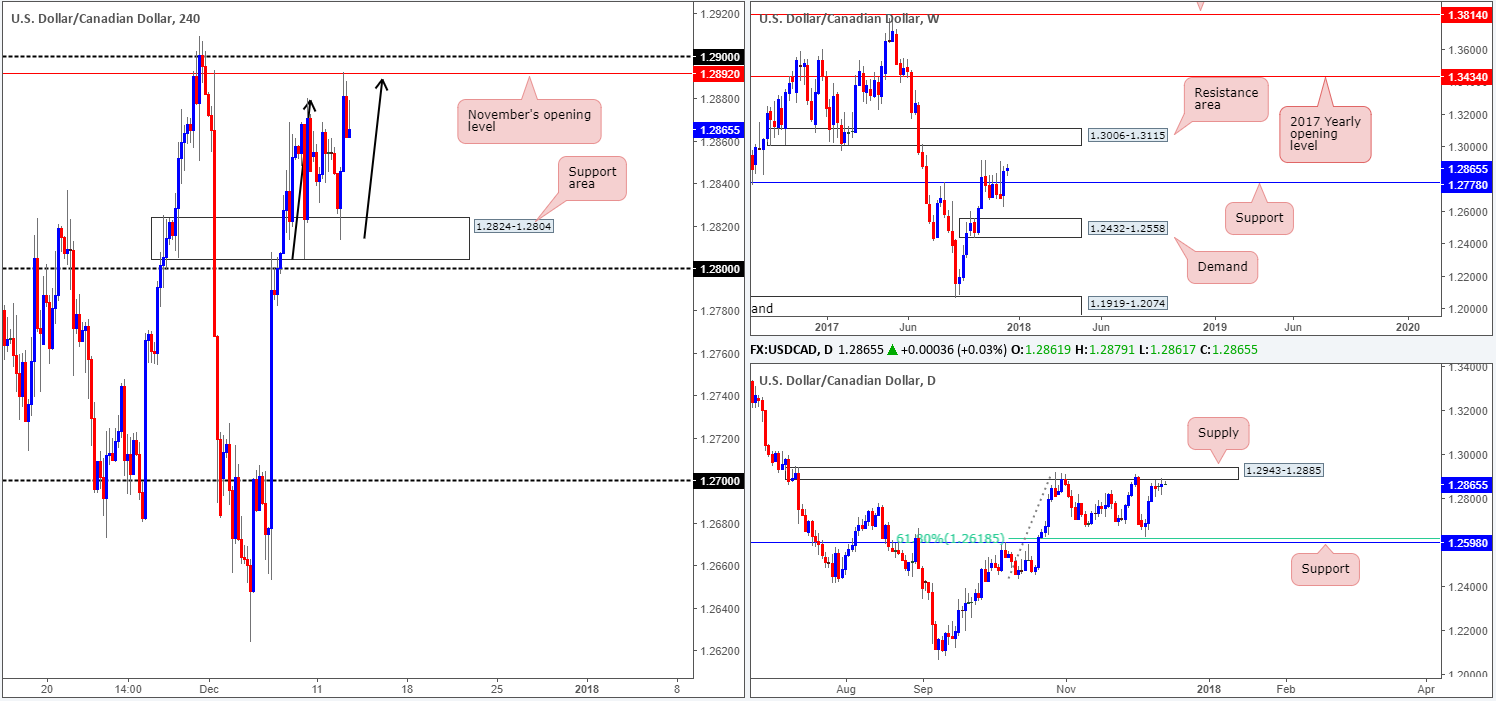
During the course of yesterday’s sessions the USD/CAD advanced beautifully from a H4 support area at 1.2824-1.2804 on the back of a drop in oil prices, and ended the day touching gloves with November’s opening level seen on the H4 timeframe at 1.2892. Traders may have also noticed that this movement formed a nice-looking H4 AB=CD bearish pattern, which happened to complete around Nov’s opening level.
As highlighted in previous reports, weekly price firmly closed above weekly resistance at 1.2778 (acting support) last week, potentially clearing upside to a weekly resistance area coming in at 1.3006-1.3115. Stopping weekly buyers from pushing north, however, is a daily supply zone located at 1.2943-1.2885 (back-to-back daily indecision candles seen printed here). This area has capped upside since late October, so there’s a good chance that we may see history repeat itself here.
Direction:
- Long: Buying is difficult. Granted, we have cleared a weekly resistance level, but in the process of doing so, a daily supply was brought into the fray!
- Short: In Tuesday’s report we highlighted that 1.29/1.2892 could be a H4 area to consider, as it is sited within daily supply and, therefore, allows one to position stops above the daily zone whilst shorting a H4 base. This was an even more attractive sell given the recent AB=CD completion! Well done to any of our readers who managed to pin down a trade from here. Profit taking will likely be seen around the noted H4 support area, with the possibility of a fakeout down to the 1.28 handle.
Data points to consider: US CPI figures at 1.30pm; FOMC interest-rate decision, economic projections and statement at 7pm; FOMC press conference at 7.30pm; FOMC member Brainard speaks at 11pm GMT.
Areas worthy of attention:
Supports: 1.2824-1.2804; 1.28 handle; 1.2778.
Resistances: 1.29 handle; 1.2892; 1.2943-1.2885; 1.3006-1.3115.
USD/CHF:
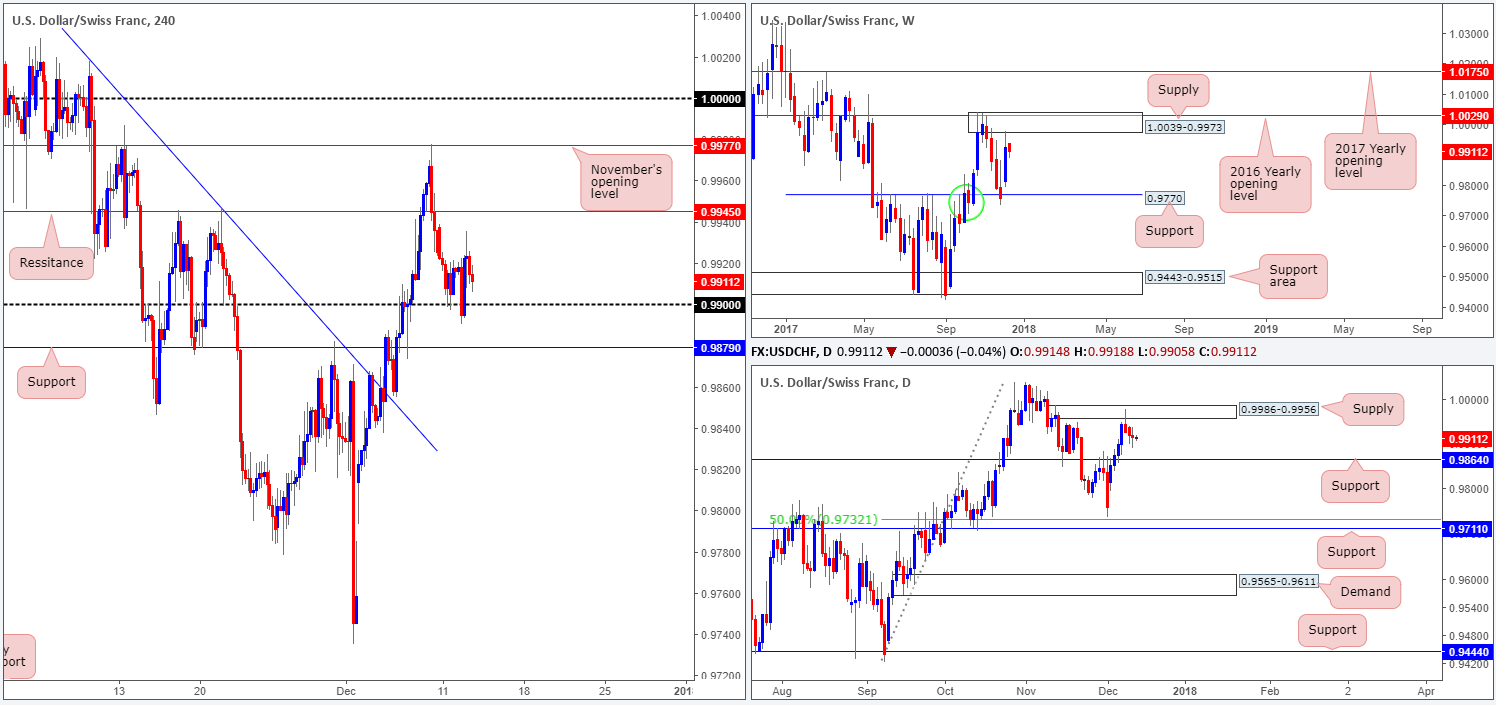
It was a somewhat subdued day in the USD/CHF market on Tuesday as price spent the segment hovering around the 0.99 handle. In the event that price climbs higher from 0.99, the next area of potential H4 resistance sits at 0.9945. A violation of 0.99 on the other hand, would almost immediately bring this market into contact with a H4 support level pegged at 0.9879.
Turning our attention to the weekly timeframe, we can see that weekly price recently crossed paths with a weekly supply zone at 1.0039-0.9973 that houses the 2016 yearly opening level seen at 1.0029. Along similar lines, daily price is also seen trading from a daily supply zone coming in at 0.9986-0.9956. In fact this daily zone is glued to the underside of the noted weekly area. Should higher-timeframe sellers remain defensive from this point, then the next port of call will likely be the daily support level at 0.9864.
Direction:
- Long: Buying from 0.99 whilst both weekly and daily price are seen selling from supplies is not a trade that echoes high probability!
- Short: Unfortunately selling is just as awkward. A sell beyond 0.99 would place one against potential buying from H4 support at 0.9879. And a break below this support would land one within striking distance of daily support mentioned above at 0.9864.
Data points to consider: US CPI figures at 1.30pm; FOMC interest-rate decision, economic projections and statement at 7pm; FOMC press conference at 7.30pm; FOMC member Brainard speaks at 11pm GMT.
Areas worthy of attention:
Supports: 0.99 handle; 0.9879; 0.9864.
Resistances: 0.9945; 1.0039-0.9973; 1.0029; 0.9986-0.9956.
DOW 30:
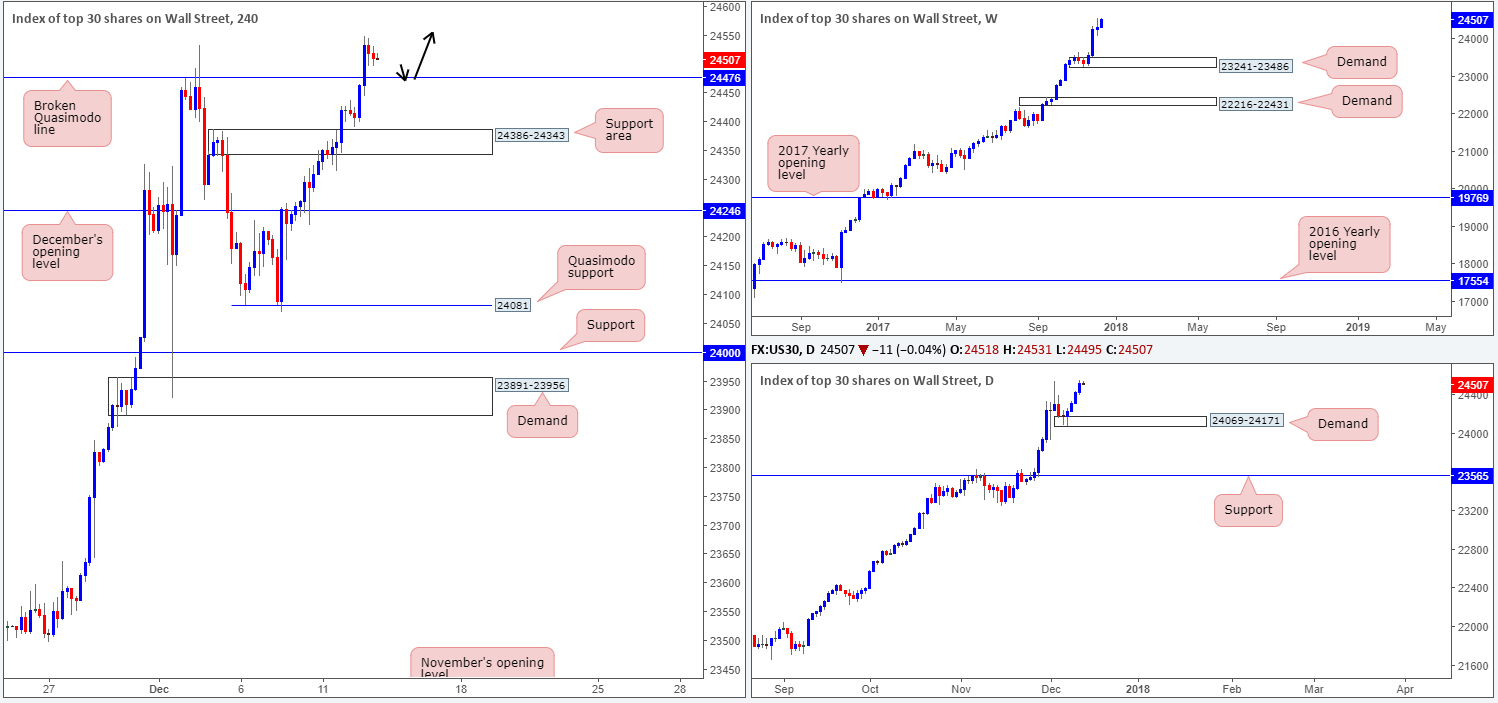
US equities advanced to a fresh record high of 24548 on Tuesday, after conquering the H4 Quasimodo resistance level coming in at 24476. At this point, sellers’ stop-loss orders are likely filled, with this line now likely to offer a base of support.
Direction:
- Long: Traders may want to consider exercising a bit of patience here and waiting for H4 price to RETEST 24476 as support. After support is confirmed by a reasonably sized H4 bull candle, one can feel relatively confident that further upside is on the cards.
- Short: Selling this market with absolutely no obvious resistance in sight is not a trade that most would label high probability. Therefore, sell with caution!
Data points to consider: US CPI figures at 1.30pm; FOMC interest-rate decision, economic projections and statement at 7pm; FOMC press conference at 7.30pm; FOMC member Brainard speaks at 11pm GMT.
Areas worthy of attention:
Supports: 24476; 24386-24343.
Resistances: …
GOLD:
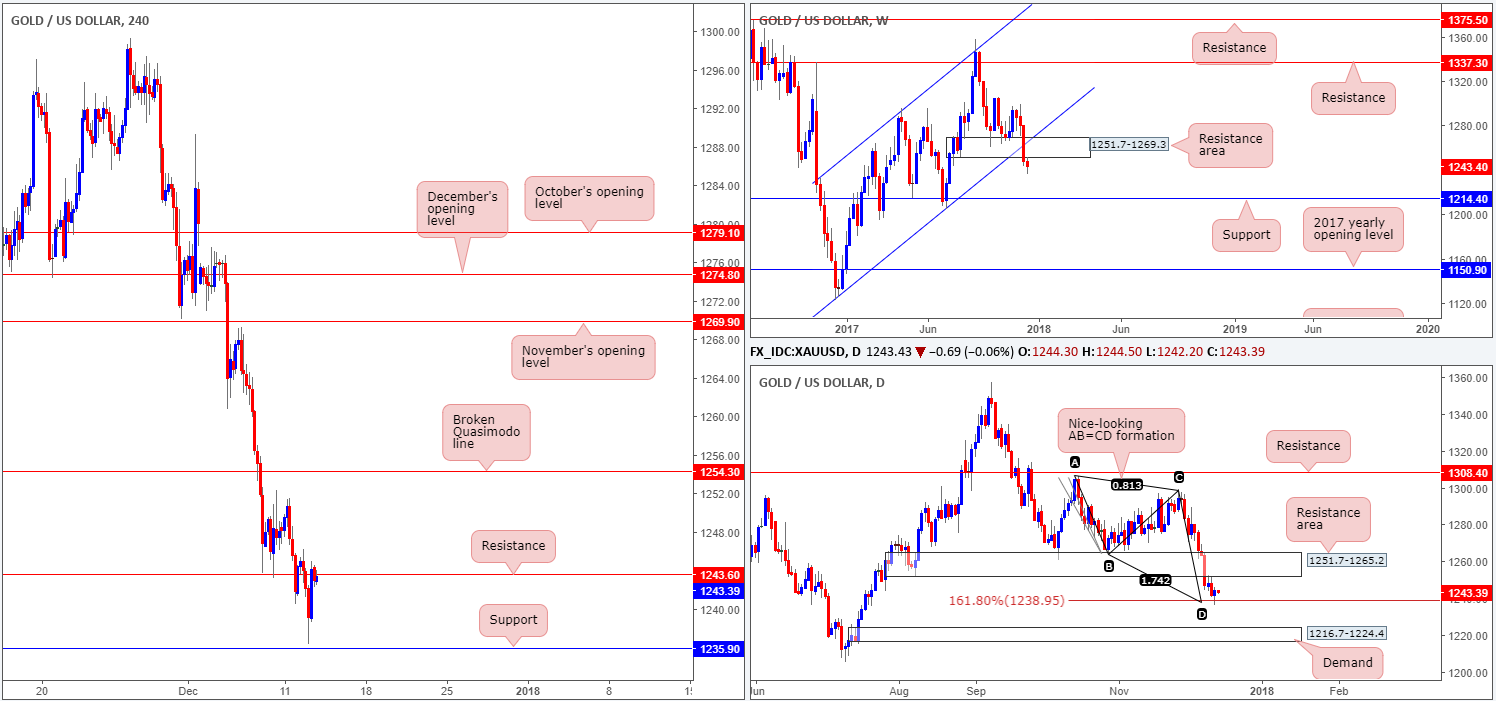
Working our way from the top of the charts this morning, it is clear to see that stops below the weekly support area at 1251.7-1269.3 (now acting resistance area) are highly likely consumed. By and of itself, this may have unlocked the door for the sellers to probe as far south as the weekly support line coming in at 1214.4.
However, before this can be accomplished one has to take into account where daily price is trading. Amid Tuesday’s segment, the precious metal crossed paths with a daily AB=CD 161.8% Fib ext. point at 1238.9 and formed a reasonably respectable daily buying tail. Further buying from this point could bid price up to the underside of a daily resistance area fixed at 1251.7-1265.2.
Resistance on the H4 timeframe at 1243.6 is, as you can see, currently holding ground. How long this will last, however, is anybody’s guess given the room daily buyers have to push higher at the moment. A move to the downside from the current resistance would likely bring in the H4 support level at 1235.9, which came within striking distance during yesterday’s movement.
Direction:
- Long: With a H4 resistance in play and weekly price portending further selling, buying the daily AB=CD ext. point may not be the best path to take. The most we see a long trade offering is the underside of the aforementioned daily resistance area.
- Short: A sell beyond the aforementioned H4 support on the other hand could be something to consider. A decisive H4 close lower, followed up with a retest and a reasonably sized H4 bear candle would, as far as we can see, attract fresh buyers, targeting H4 support at 1228.1, followed closely by the top edge of a daily demand at 1224.4.
Areas worthy of attention:
Supports: 1235.9; 1214.4; 1216.7-1224.4; 1228.1.
Resistances: 1243.6; 1251.7-1265.2.


