Waiting for lower timeframe confirmation is our main tool to confirm strength within higher timeframe zones, and has really been the key to our trading success. It takes a little time to understand the subtle nuances, however, as each trade is never the same, but once you master the rhythm so to speak, you will be saved from countless unnecessary losing trades. The following is a list of what we look for:
- A break/retest of supply or demand dependent on which way you’re trading.
- A trendline break/retest.
- Buying/selling tails/wicks – essentially we look for a cluster of very obvious spikes off of lower timeframe support and resistance levels within the higher timeframe zone.
- Candlestick patterns. We tend to stick with pin bars and engulfing bars as these have proven to be the most effective.
We typically search for lower-timeframe confirmation between the M15 and H1 timeframes, since most of our higher-timeframe areas begin with the H4. Stops are usually placed 1-3 pips beyond confirming structures.
EUR/USD:
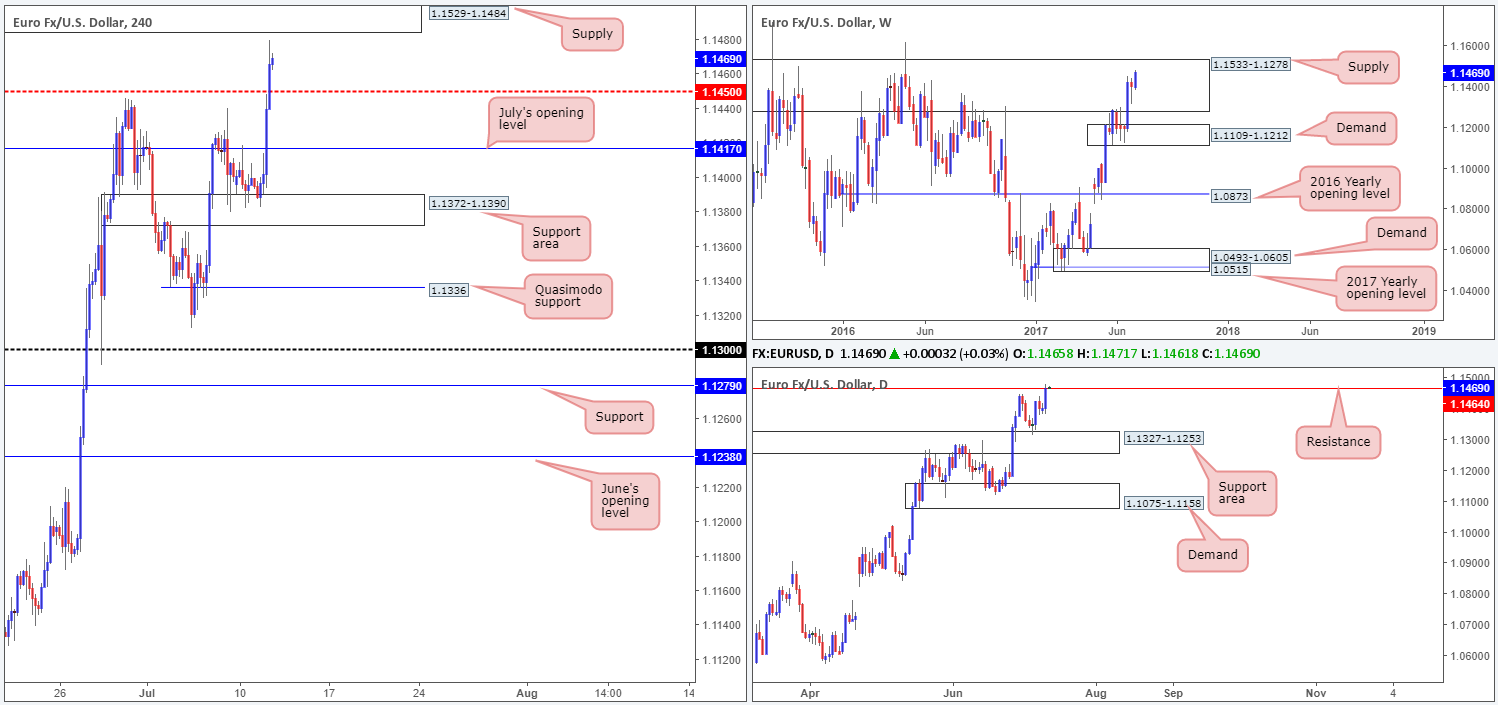
Influenced by bearish comments from FOMC member Brainard, the EUR/USD shifted to the upside during yesterday’s US session. July’s opening level at 1.1417 as well as the H4 mid-level resistance at 1.1450 were taken out, with the major ending the day closing just ahead of a H4 supply base coming in at 1.1529-1.1484 (formed back in May 2016).
What’s interesting about the said H4 supply is that it is fresh, and is positioned around the upper edge of a major weekly supply drawn from 1.1533-1.1278 (that has capped upside since May 2015). Alongside this, we can also see daily price currently teasing a resistance level at 1.1464.
Our suggestions: With the above notes in mind, this recent Bull Run could be tested today! Our desk has decided to set a pending sell order at 1.1484, and place a stop-loss order above the WEEKLY supply edge at 1.1535. Although this is a 50-pip stop, one has to take into account that price could potentially move 100s of pips from this base given that it’s positioned within a weekly supply zone. Should this setup come to fruition, we will ultimately be looking for the bears to run through 1.1450 and challenge July’s opening level at 1.1417, before taking partial profits and reducing risk to breakeven.
Data points to consider: Fed Chair Yellen testifies at 3pm GMT+1.
Levels to watch/live orders:
- Buys: Flat (stop loss: N/A).
- Sells: 1.1484 (stop loss: 1.1535).
GBP/USD:
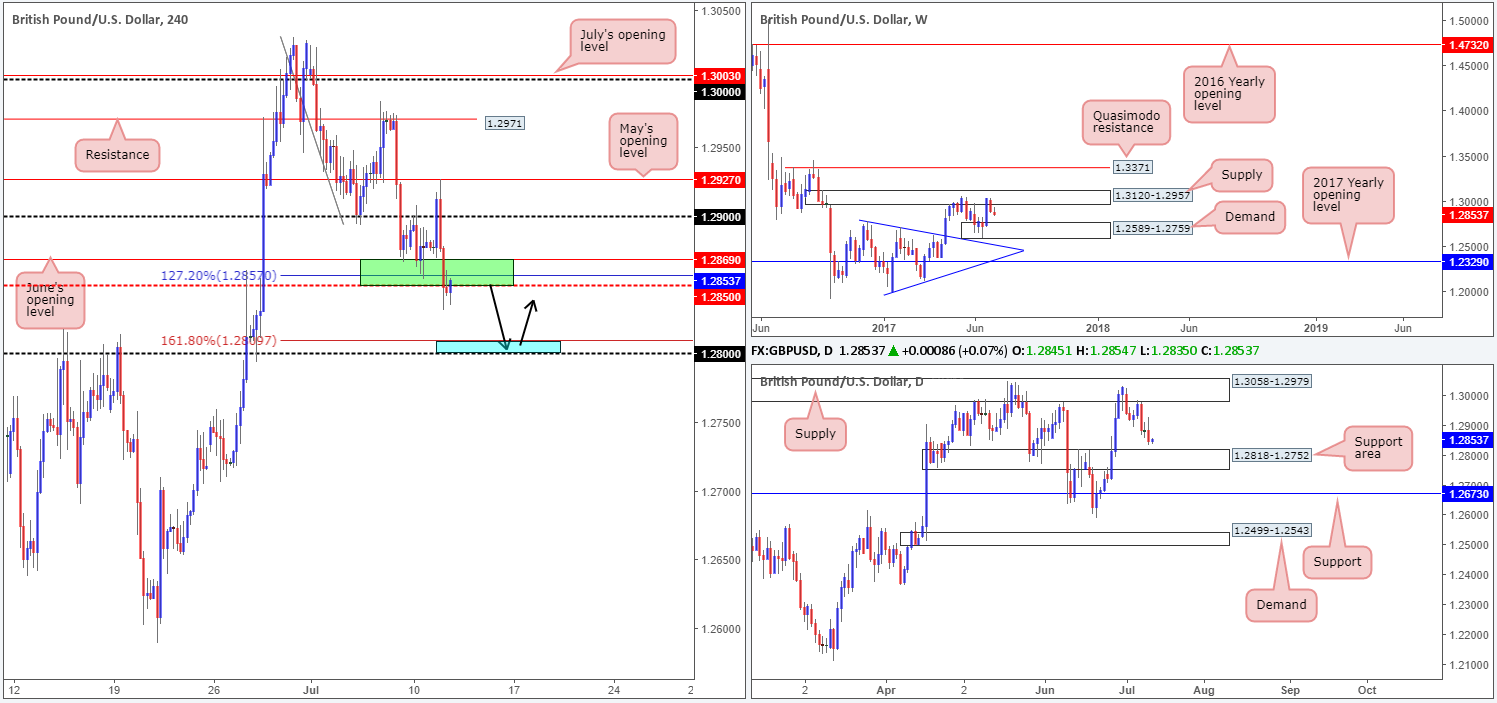
As anticipated, H4 price bounced nicely from the green area marked at 1.2850-1.2869, but failed to generate much follow through beyond the 1.29 handle.
Weekly price continues to trade bearishly from supply at 1.3120-1.2957, with the next downside target being seen around demand pegged at 1.2589-1.2759. Also of interest here is the daily timeframe – the candles are still showing some space to stretch down to 1.2818-1.2752: a support area glued to the top edge of the noted weekly demand.
So, where does the above analysis leave us on the H4 timeframe?
Well, considering that the top edge of the daily support area is sited at 1.2818, we are not keen sellers below 1.2850. Instead, our attention remains focused on the 1.28 handle (blue area) seen below, which happens to converge with the 161.8% ext. point at 1.2809 taken from the high 1.3030 and is also lodged within the said daily support area!
Our suggestions: To trade long from the 1.28 neighborhood, however, our desk would need to see evidence of buyer intent in the form of a H4 bullish candle, preferably a full-bodied candle. The reason for requiring this is because price could simply trade deeper into the aforementioned daily support area, thereby faking the 1.28 level and liquidating our stop. Waiting for intent to be shown helps avoid this! In the event that this trade comes to fruition, 1.2850 will be the first port of call regarding profit taking. Beyond this number, we’d be looking at 1.29/1.2927.
Data points to consider: UK employment figures at 9.30am. Fed Chair Yellen testifies at 3pm GMT+1.
Levels to watch/live orders:
- Buys: Currently watching the 1.28 neighborhood for a potential long opportunity. To trade from here we would highly recommend waiting for at least a H4 bullish candle to form, preferably a full-bodied candle, before pulling the trigger (stop loss: ideally beyond the candle’s tail).
- Sells: Flat (stop loss: N/A).
AUD/USD:
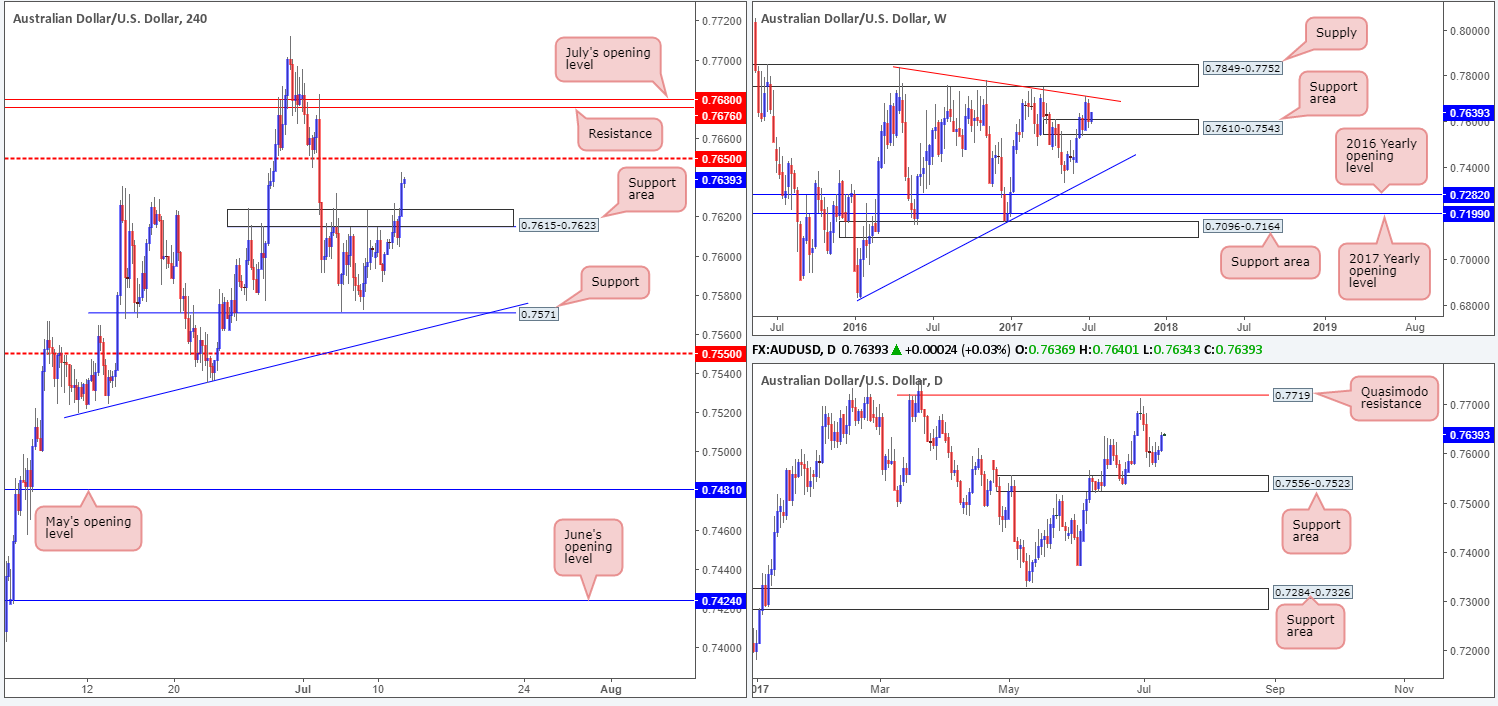
Of late, we’ve seen Aussie bulls pick up the pace and push higher, consequently breaking through 0.7615-0.7623, which has now come to be a potential H4 support area. Technically speaking, we believe the move was influenced by the fact that the weekly candles recently connected with a support area carved from 0.7610-0.7543.
Selling from the nearby H4 mid-level resistance at 0.7650 is not really something that interests us this morning, due to the fact that this would involve shorting into potential weekly buyers. Therefore, we feel this level is best left alone!
A H4 close above 0.7650 on the other hand would, of course, further confirm bullish intent from the weekly support area, but it is not something we would feel comfortable getting involved in. The reason for this is because there is a H4 resistance level lurking up ahead at 0.7676, followed closely by July’s opening level at 0.7680, which was already tagged earlier this month and thus has proved itself as a potential resistance.
Our suggestions: As far as we can see, technical elements are mixed at the moment leaving us with little choice but to remain on the sidelines today.
Data points to consider: Fed Chair Yellen testifies at 3pm GMT+1.
Levels to watch/live orders:
- Buys: Flat (stop loss: N/A).
- Sells: Flat (stop loss: N/A).
USD/JPY:
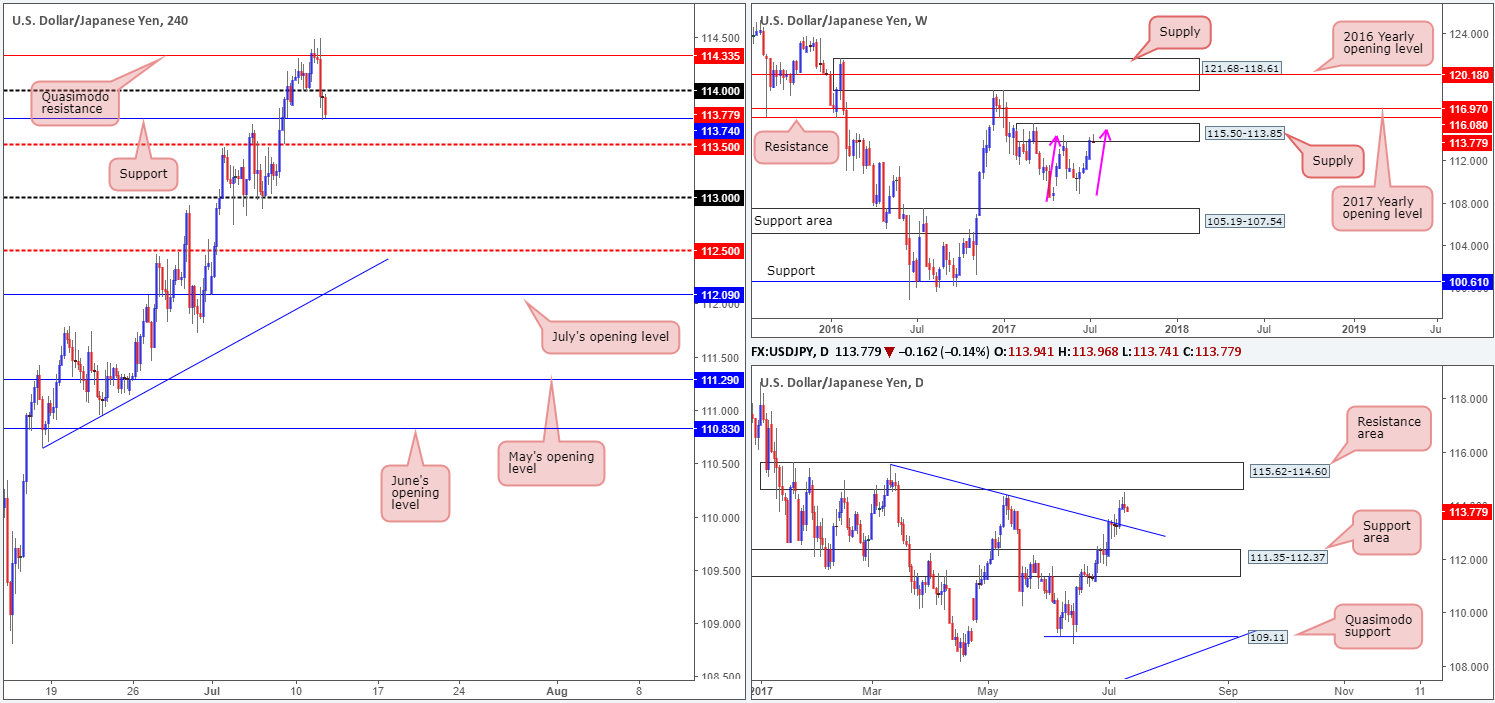
Leaving the weekly AB=CD completion point at 115 (see pink arrows) unchallenged, the sellers have begun to make an appearance from within the weekly supply coming in at 115.50-113.85.
Traders may have also noticed that daily price came within a cat’s whisker of clipping the underside of a resistance area marked at 115.62-114.60 yesterday. Providing that the bears remain in a dominant position here, it’s possible that we may see price touch gloves with a trendline support etched from the high 115.50.
A closer look at price action on the H4 timeframe shows the Quasimodo resistance level at 114.33 held beautifully on Tuesday. The 114 handle was taken out and, as we write, price is seen testing support at 113.74.
Our suggestions: On account of the above, our desk remains firmly biased to the downside right now. However, it is proving difficult to pin down an entry point to sell! Beyond the current H4 support, we have the H4 mid-level support at 113.50, and just beneath this is the aforementioned daily trendline support – there’s just no room to initiate any type of short right now!
So, with that, our desk is going to humbly stand down and see how things progress today, before making any further decisions in this market.
Data points to consider: Fed Chair Yellen testifies at 3pm GMT+1.
Levels to watch/live orders:
- Buys: Flat (stop loss: N/A).
- Sells: Flat (stop loss: N/A).
USD/CAD:
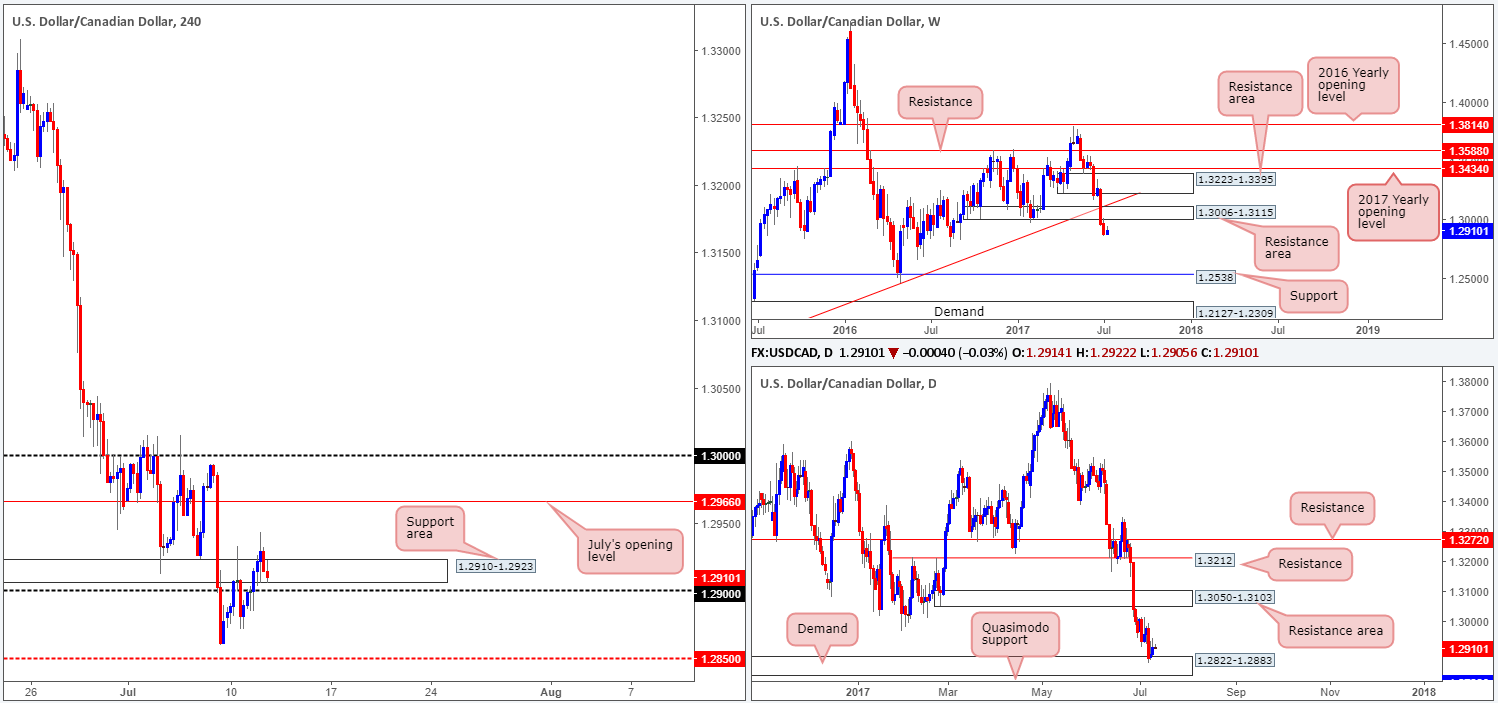
Despite the recent break below the weekly support area at 1.3006-1.3115 (now a resistance area), daily buyers are doing a sound job of holding this market above demand at 1.2822-1.2883. In addition to this, we’ve also seen H4 bulls punch above the 1.2910-1.2923 resistance area, which, as you can see, is now being retested as a support right now.
Trading long from 1.2910-1.2923 is, of course, an option today given the daily chart’s current structure, but it is not a high-probability move, in our humble opinion. Not only is the market entrenched within a rather steep downtrend at the moment, the weekly timeframe shows space to trade all the way down to support coming in at 1.2538.
Our suggestions: For us personally, we will pass on buying from 1.2910-1.2923 today. If you still believe that this area could hold, we would strongly advise waiting for H4 price to print a bull candle. This way, at least you know there’s interest from the bulls, before committing. The first take-profit area from here would likely be July’s opening level at 1.2966, followed by the large psychological band 1.30.
Data points to consider: Fed Chair Yellen testifies at 3pm. Canadian monetary policy report and overnight rate decision at 3pm, Crude oil inventories at 3.30pm along with a BoC press conference at 4.15pm GMT+1.
Levels to watch/live orders:
- Buys: Flat (Stop loss: N/A).
- Sells: Flat (Stop loss: N/A).
USD/CHF:
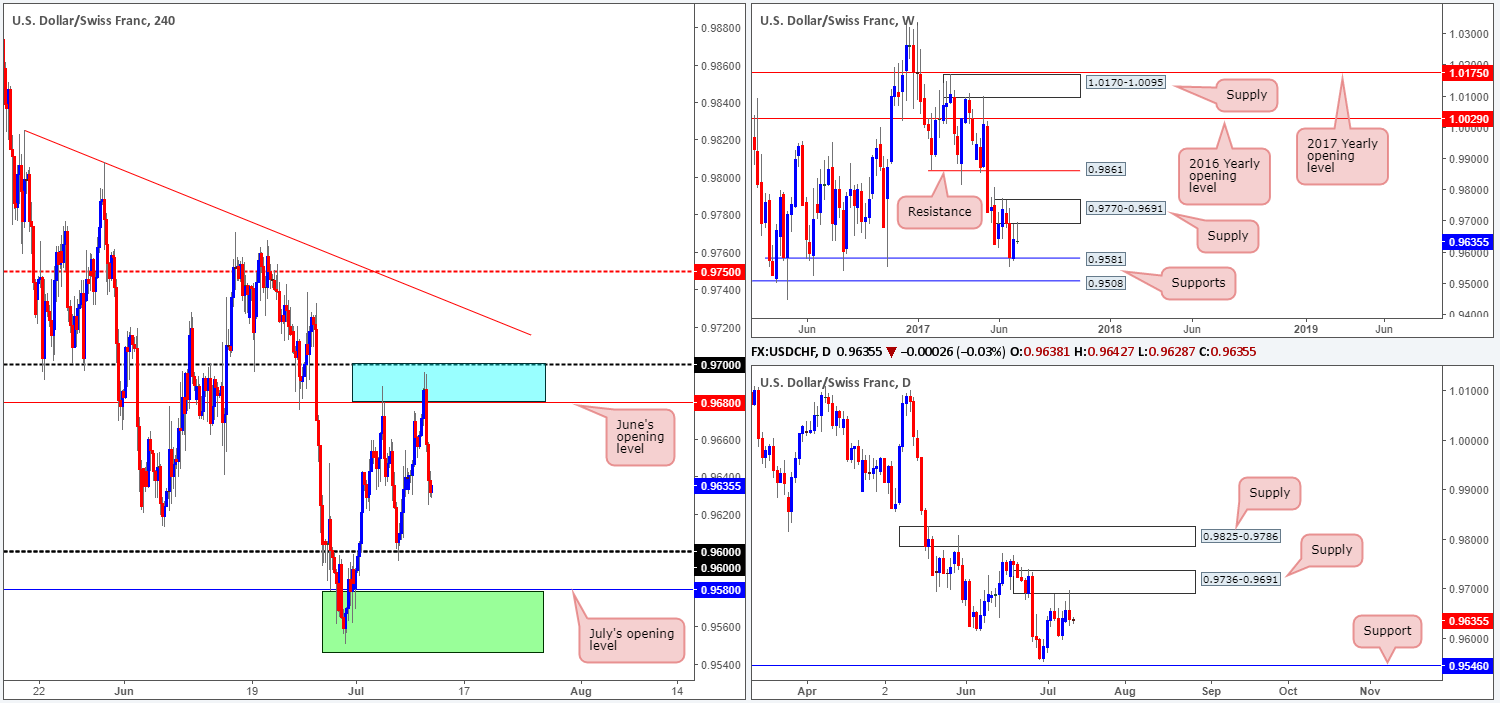
During the early hours of yesterday’s US segment, the pair aggressively faded from 0.97/0.9680 (round number/June’s opening level – blue zone). Through the simple lens of a technical trader, this move should not really have come as much of a surprise. Weekly price recently came into contact with supply at 0.9770-0.9691, and daily price also connected with a smaller supply seen at 0.9736-0.9691, which is located around the lower edge of the said weekly supply.
As we write, we do not see much in the way of support stopping price from reaching the 0.96 handle today, and possibly July’s opening level at 0.9580 (sits just within a green area comprised of daily support at 0.9546 and weekly support at 0.9581).
Our suggestions: Unless H4 price retests the aforementioned blue zone today; we would advise steering clear of shorts. Should the bears continue to drive lower on the other hand, we would, once again, be interested buyers at the green area mentioned above.
However, to initiate a trade at either of the above noted zones, we would require H4 candle confirmation, preferably in the shape of a full, or near-full-bodied candle. This is just a way to confirm that there are other speculators interested in the same zone as we are!
Data points to consider: Fed Chair Yellen testifies at 3pm GMT+1.
Levels to watch/live orders:
- Buys: 0.9564/0.9581 ([waiting for a H4 bull candle – preferably a full, or near full-bodied candle – to form is advised] stop loss: ideally beyond the candle’s tail).
- Sells: 0.97/0.9680 ([waiting for a H4 bear candle – preferably a full, or near full-bodied candle – to form is advised] stop loss: ideally beyond the candle’s wick).
DOW 30:
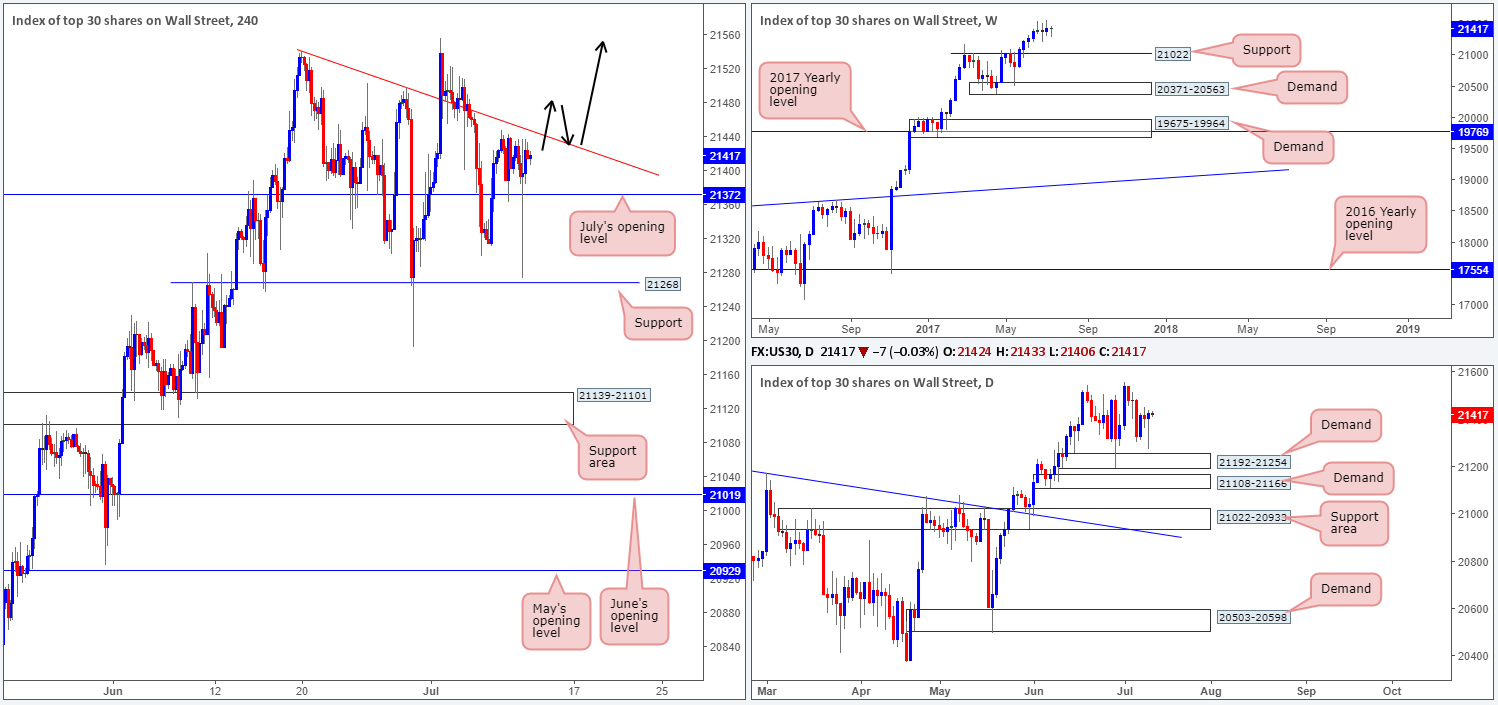
Apart from the somewhat aggressive H4 tail seen yesterday at 21273, the overall structure remains unchanged. What is interesting, however, is yesterday’s action chalked up a strong-looking buying tail i.e. a bullish pin-bar candle.
As mentioned in yesterday’s report, despite the H4 candles grinding lower at the moment, the US equity market remains trading with a strong upside bias. On the weekly timeframe, there’s little stopping the unit from pushing higher. Should the index pullback, nonetheless, the support level at 21022 will likely offer a floor to trade from considering that it had a relatively sound history as a resistance.
Ultimately, we’re looking for July’s opening level at 21372 to continue providing support, and eventually force the candles above the nearby H4 trendline resistance extended from the high 21541. This, for us, would be a cue to begin looking to buy this market.
Our suggestions: Following a decisive close above the current H4 trendline resistance, the desk will be watching for the piece to retest this line as support and print a reasonably sized H4 bull candle, preferably a full, or near full-bodied candle, before looking to pull the trigger (as per the black arrows).
Data points to consider: Fed Chair Yellen testifies at 3pm GMT+1.
Levels to watch/live orders:
- Buys: Watch for H4 price to close above the current trendline resistance and then look to trade any retest seen thereafter ([waiting for a H4 bull candle – preferably a full, or near full-bodied candle – to form following the retest is advised] stop loss: ideally beyond the candle’s tail).
- Sells: Flat (stop loss: N/A).
GOLD:
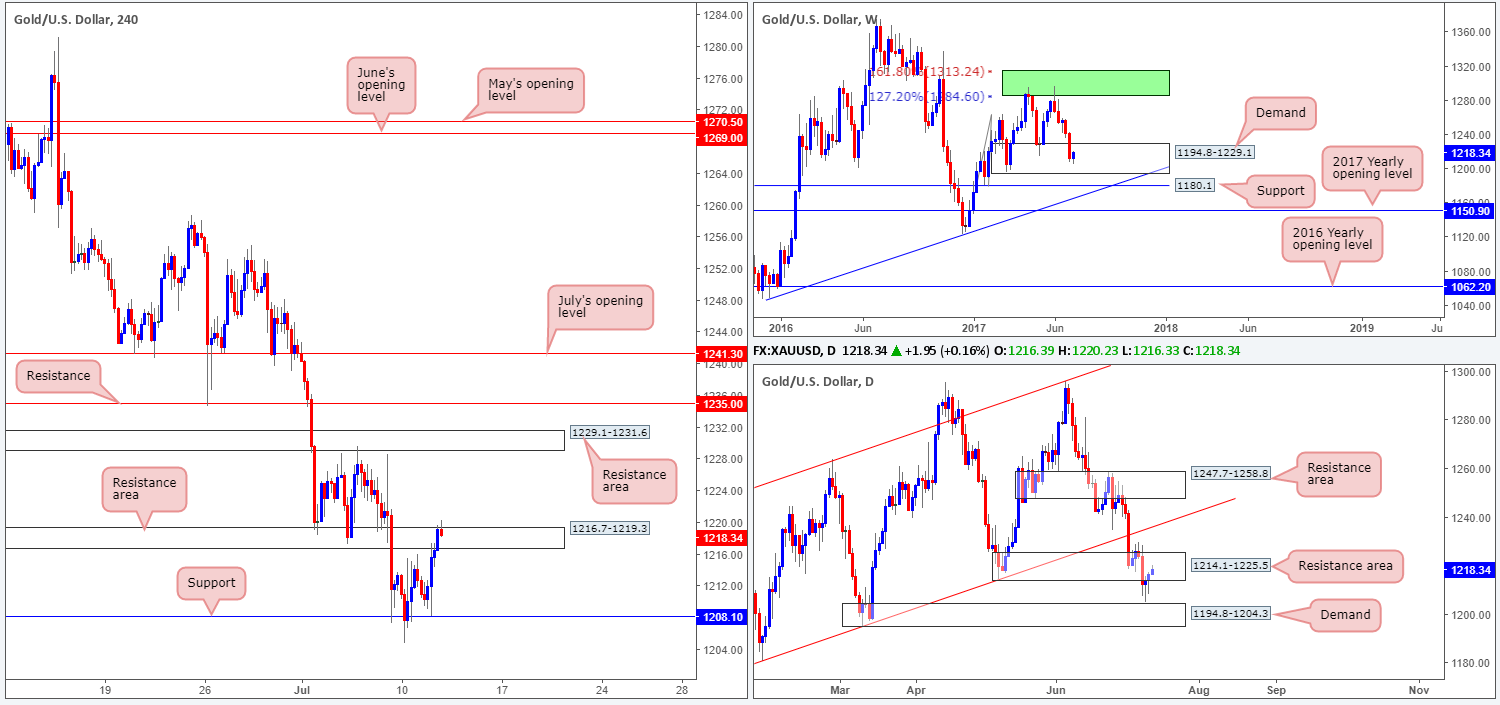
Across the board, we saw the US dollar trade lower yesterday and this, as is usually the case, sent the price of gold higher. Technically speaking, we’re not surprised to see the yellow metal gravitate higher since weekly price remains trading within the walls of a demand area coming in at 1194.8-1229.1. However, on the daily chart, weekly bulls do have some opposition, as the unit is seen touching base with a resistance area at 1214.1-1225.5.
As we highlighted in Tuesday’s analysis, before our team becomes buyers in this market we would require a decisive H4 close above the H4 resistance area at 1216.7-1219.3. That way, we can be somewhat confident that the current daily resistance area is weakened and the H4 candles will likely reach the H4 resistance area at 1229.1-1231.6, followed closely by H4 resistance at 1235.0.
Our suggestions: Following a H4 close above 1216.7-1219.3, we’d also require price to retest this area as support and possibly print a H4 bull candle in the shape of a full, or near-full-bodied candle. This, to us, would be enough evidence to suggest that the bulls have the upper hand here.
Levels to watch/live orders:
- Buys: Watch for H4 price to close above 1216.7-1219.3 and then look to trade any retest of this area seen thereafter ([waiting for a H4 bull candle – preferably a full, or near full-bodied candle – to form following the retest is advised] stop loss: ideally beyond the candle’s tail).
- Sells: Flat (stop loss: N/A).


