A note on lower timeframe confirming price action…
Waiting for lower timeframe confirmation is our main tool to confirm strength within higher timeframe zones, and has really been the key to our trading success. It takes a little time to understand the subtle nuances, however, as each trade is never the same, but once you master the rhythm so to speak, you will be saved from countless unnecessary losing trades. The following is a list of what we look for:
- A break/retest of supply or demand dependent on which way you’re trading.
- A trendline break/retest.
- Buying/selling tails/wicks – essentially we look for a cluster of very obvious spikes off of lower timeframe support and resistance levels within the higher timeframe zone.
- Candlestick patterns. We tend to only stick with pin bars and engulfing bars as these have proven to be the most effective.
For us, lower timeframe confirmation starts on the M15 and finishes up on the H1, since most of our higher timeframe areas begin with the H4. Stops usually placed 5-10 pips beyond your confirming structures.
EUR/USD:
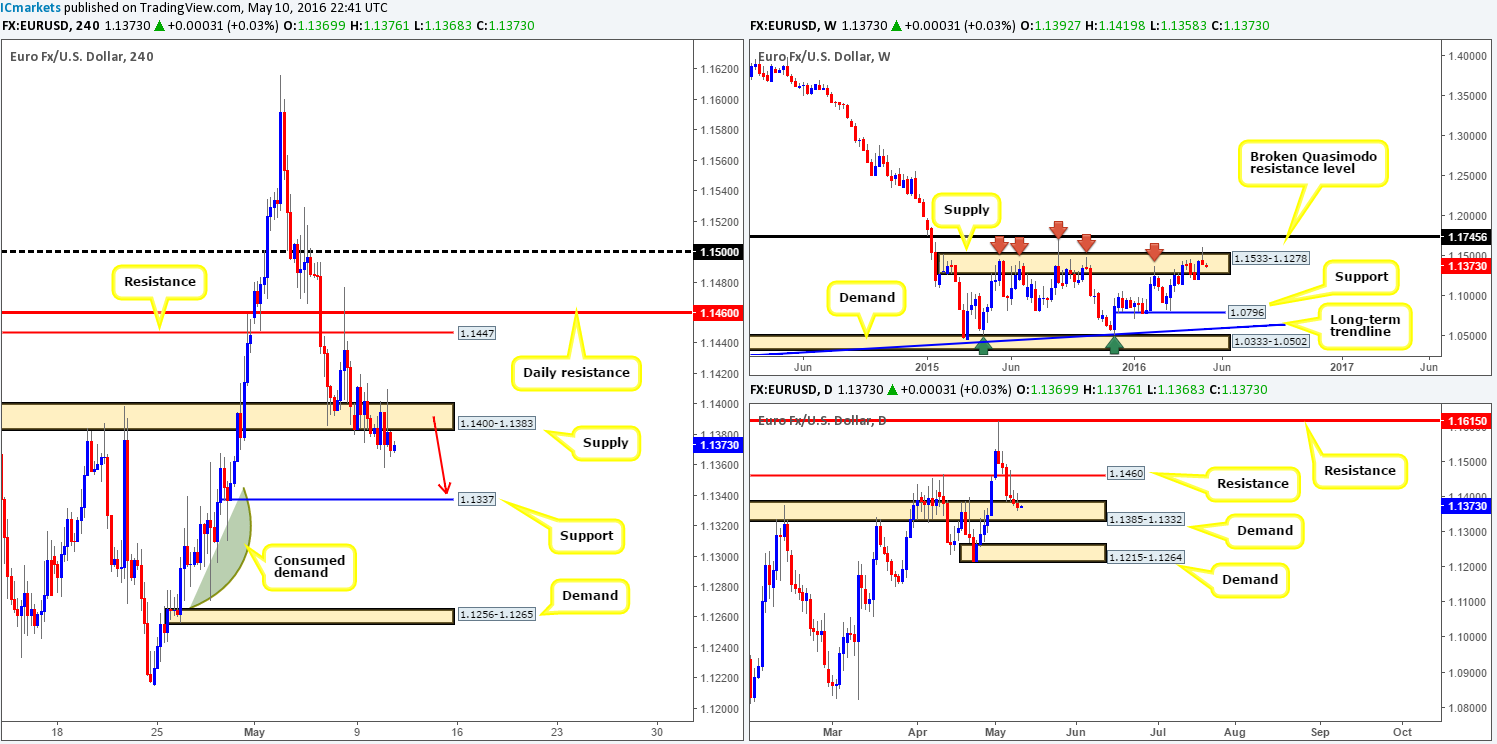
Coming in from the top this morning, the weekly chart continues to reflect a more bearish stance in this market. Price recently formed a beautiful-looking bearish selling wick within a major area of weekly supply seen at 1.1533-1.1278, which, as you can see, has managed to hold this unit lower since May 2015. On the flip side, the daily chart remains trading within demand penciled in at 1.1385-1.1332. Despite this clear area demand, however, the EUR, likely pressured from weekly sellers, continues to post losses – yesterday being its sixth daily loss!
Given a very light docket yesterday, we can see that the H4 spent the day consolidating in a relatively tight range of fifty pips (high/low) around H4 supply carved from 1.1400-1.1383. This – coupled with the higher-timeframe picture (see above), we’re still siding with the sellers’ camp on this one! A short trade from the current H4 supply is still (with lower timeframe confirmation – see the top of this report for ideas) a possibility in our opinion, since the next downside target falls in at 1.1337 – a small line of H4 demand. Beyond this barrier, we have our eye on the small H4 demand chalked up at 1.1256-1.1265 (conveniently sits within daily demand at 1.1215-1.1264 – the next area of value beyond the current daily demand), as in between here resembles what we believe to be demand consumption (green arc).
Levels to watch/live orders:
- Buys: Flat (Stop loss: N/A).
- Sells: 1.1400-1.1383 [Tentative – confirmation required] (Stop loss: dependent on where one confirms this area).
GBP/USD:
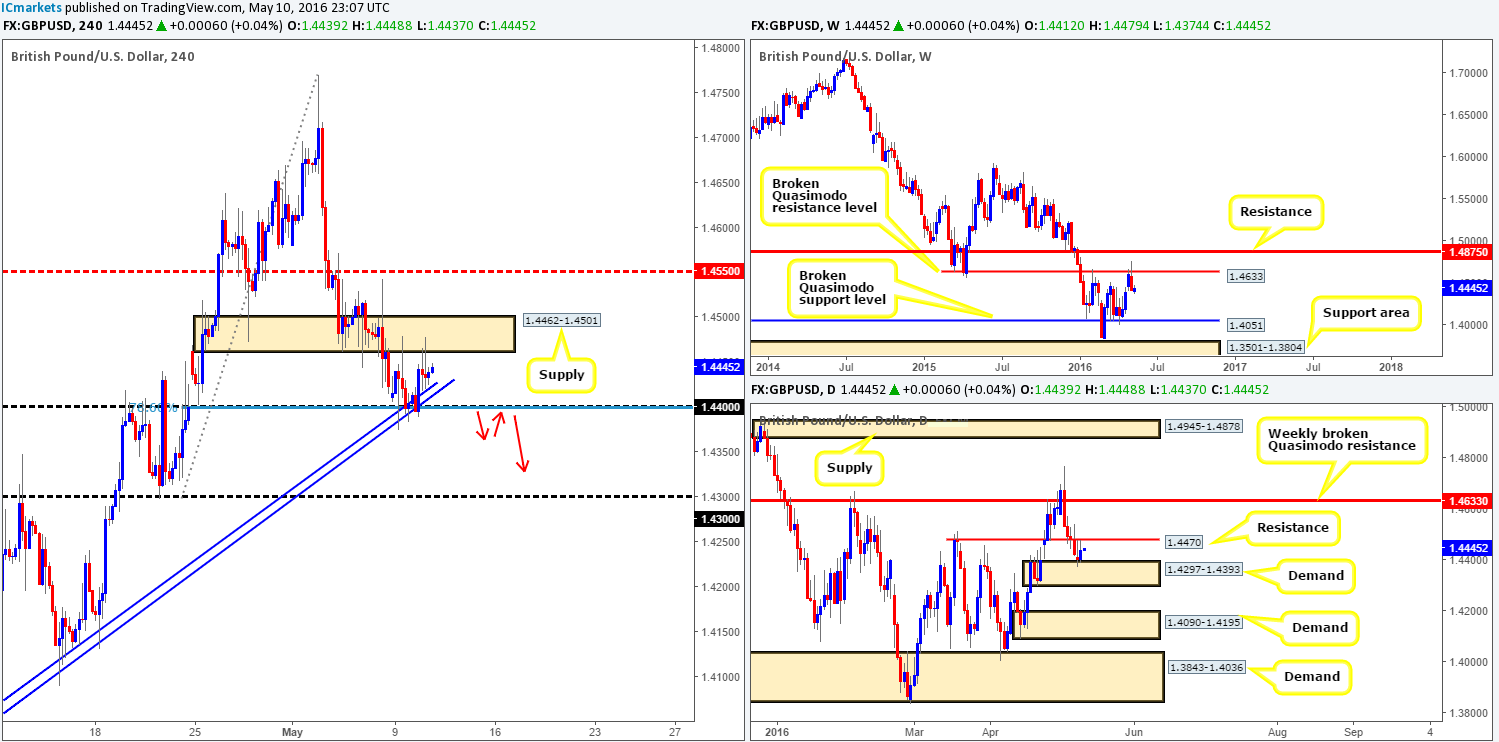
Although Cable continues to find support at the 1.4400 handle, offers around H4 supply drawn from 1.4462-1.4501 are still proving to be problematic, and for good reason! Despite the confluence seen around 1.4400 (clear H4 trendline convergence from lows of 1.4005 and 78.6% H4 Fibonacci support at 1.4399), we feel it’s no match for daily resistance at 1.4470 (housed within the current H4 supply) alongside pressure possibly coming in from the weekly timeframe after last week’s bearish engulfing candle from a broken weekly Quasimodo resistance line at 1.4633.
Therefore, our team is still in favor of further downside in this market. With that being the case, if, as we mentioned in yesterday’s report, the pound closes below 1.4400 and retests the underside of this barrier as resistance, selling this market down to the 1.4300 hurdle could be something to consider. Granted, by doing so you’d effectively be shorting into daily demand, but let’s not forget that supporting this trade is both the daily and weekly resistances, as well as the large weekly bearish engulfing candle (see above). To be on the safe side though, we would recommend only pulling the trigger here should one be able to spot a nice-looking lower timeframe sell setup (for confirmation techniques, please see the top of this report) following the retest of 1.4400, since fakeouts are common around fixed psychological numbers such as these!
Levels to watch/live orders:
- Buys: Flat (Stop loss: N/A).
- Sells: Watch for price to close below 1.4400 and look to trade any retest seen thereafter (lower timeframe confirmation required).
AUD/USD:
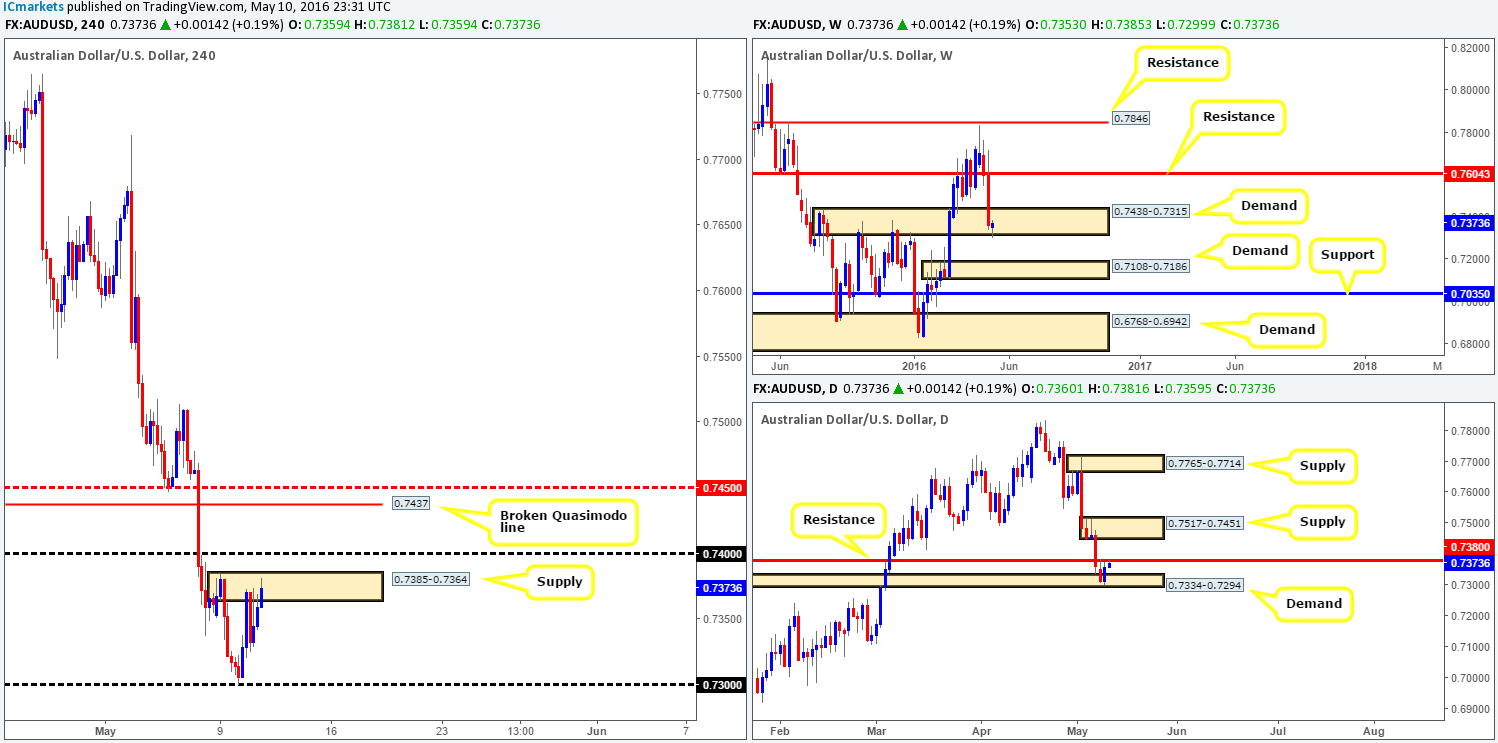
Upon reaching the psychological threshold 0.7300 on Tuesday, a steady wave of bids piled into the AUD. This resulted in price driving into the jaws of a H4 supply zone fixed at 0.7385-0.7364. Well done to any of our readers who managed to lock down a long position from 0.7300 yesterday as this was a noted move to watch for in our previous report (see link below).
Going forward, however, we see trouble ahead for the bulls! The current H4 supply coupled with daily resistance at 0.7380 could potentially halt further buying. Now, we could be wrong here as let’s be mindful to the fact that weekly action is currently trading from a demand base drawn at 0.7438-0.7315 at the moment. This, in our view, leaves traders in a precarious position: buy into H4/daily resistance or sell into weekly demand?!?!
As you can see, there is not much in the way of a clear tradable setup on the Aussie at present. As such we’ll patiently await further developments from the sidelines for now.
Levels to watch/live orders:
- Buys: Flat (Stop loss: N/A).
- Sells: Flat (Stop loss: N/A).
USD/JPY:
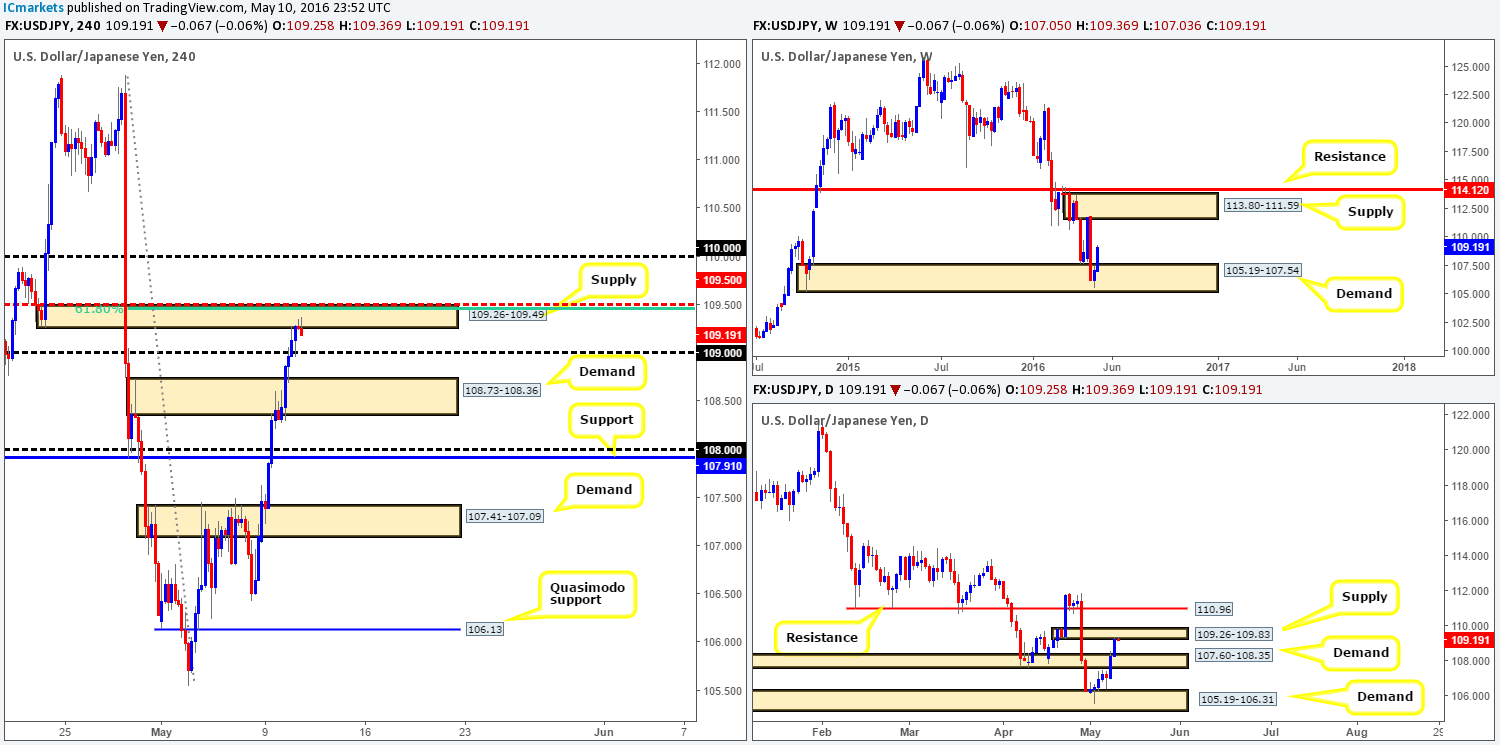
The bullish pulse clearly continues to beat in the USD/JPY market! Price remained relatively well-bid throughout the course of yesterday’s sessions, taking out both H4 supply at 108.73-108.36 (now acting demand) and the 109.00 handle, before peaking for the day around H4 supply at 109.26-109.49. In view of this supply also converging with a mid-way H4 resistance at 109.50 and a 61.8% Fibonacci resistance at 109.46, as well as price now seen flirting with the underside of daily supply at 109.26-109.83, where do we go from here? We agree that this is a very tempting location to be looking for shorts. Nevertheless, when we throw the weekly picture into the mix, directional bias changes somewhat. A very strong-looking weekly demand at 105.19-107.54 is now in play, and, in our technical opinion, is the reason for this recent surge in buying. In addition to this, we see room for the weekly advance to continue all the way back up to weekly supply drawn from 113.80-111.59.
On account of the above points, the most we see price bouncing from the current H4 supply is down to 109.00, or, at a push, the H4 demand given at 109.26-109.49. Breaking beyond these areas is doubtful in our estimation. If you’re considering a trade from the current H4 supply, we would not advise entering at market. Waiting for the lower timeframes to prove selling interest exists is a much safer route to take in our view (for confirmation techniques, please see the top of this report).
Levels to watch/live orders:
- Buys: Flat (Stop loss: N/A).
- Sells: 109.26-109.49 [Tentative – confirmation required] (Stop loss: dependent on where one confirms this area).
USD/CAD:
With Oil bouncing from H4 demand at 42.48-43.07 yesterday, the USD/CAD, as you can see, remained bearish below the large psychological resistance 1.3000 forcing price to end the day just ahead of the 1.2900 handle. Now, 1.2900 is an interesting level since it also represents a broken daily Quasimodo level! If this number is tested sometime today, there is a strong possibility that it will hold firm. In support of this, we can also see that there’s room on the weekly chart to push as high as 1.3381 – a weekly resistance, whilst down on the daily chart, upside potential can be seen as high as daily supply coming in at 1.3218-1.3086.
Therefore, keeping today’s report short and sweet, our prime focus will on the 1.2900 barrier for possible longs into this market. Due to this being a fixed level, however, lower timeframe confirmation will be required before we pull the trigger to avoid any whipsaws that may be seen through this line. Confirmation could be either an engulf of supply and subsequent retest, a break/retest of a trendline or simply a collection of buying tails around a lower-timeframe support hurdle.

Levels to watch/live orders:
- Buys: 1.2900 region [Tentative – confirmation required] (Stop loss: dependent on where one confirms this area).
- Sells: Flat (Stop loss: N/A).
USD/CHF:
For those who read our previous report on the Swissy (see link below) you may recall that we mentioned longs could be a possibility from the 1.2900 region on the condition that the H4 supply seen marked with a red arrow at 0.9735-0.9718 was spiked beforehand. This played out perfectly (check H1 for a closer look) with a beautiful rebound seen from 0.9700 shortly after, pushing price to highs of 0.9762 on the day. Unfortunately, we missed this move, well done to any of our readers who managed to jump aboard this one!
In that daily action is now kissing the underside of daily supply drawn from 0.9787-0.9755, it is possible we may see some selling pressure come into this market. However, given that the weekly timeframe continues to reflect a bullish stance in this market from support at 0.9508, we feel price will likely stretch to at least the H4 supply seen above at 0.9796-0.9781. What is more, there’s little active H4 supply seen to the left of current price right now (supply consumption wicks [1-2] 0.9753/0.9766) until the aforementioned H4 supply (positioned within the extremes of the daily supply mentioned above at 0.9787-0.9755) which, dependent on how the lower timeframe action responds, could be an area to consider shorting.
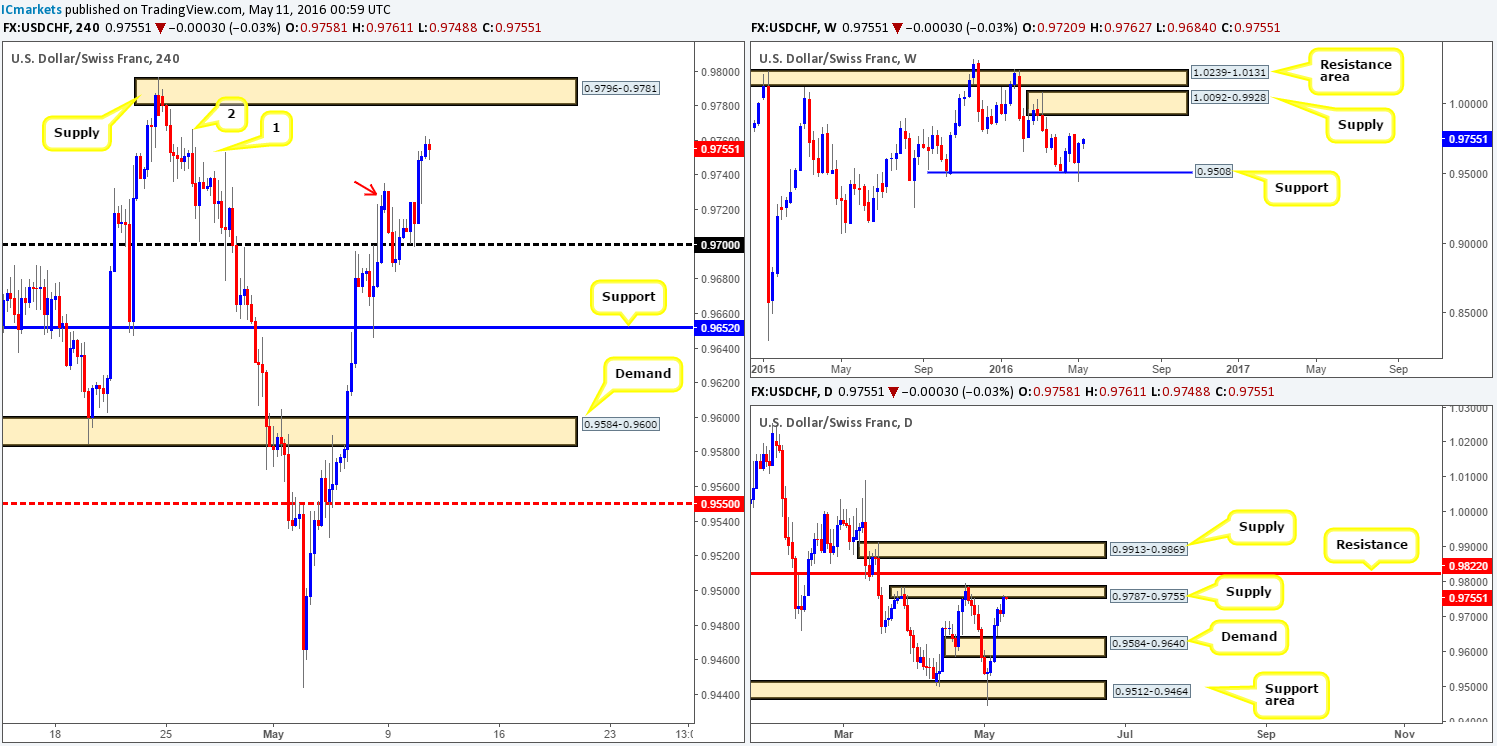
Levels to watch/live orders:
- Buys: Flat (Stop loss: N/A).
- Sells: H4 supply at 0.9796-0.9781 could be an area to consider shorting dependent on how the lower timeframes respond.
DOW 30:
(Trade update: Long from 17576 had the remaining 30% of its position closed out at 17909)
In previous writings, we mentioned that we took a long from 17576 on Friday. 70% of our position was cashed in just before the week’s close and the remaining 30% has now been liquidated at 17909 around H4 resistance coming in at 17920 with very nice risk/reward locked in! Well done to any of our readers who joined us!
On the subject of this H4 resistance, notice how it beautifully fuses with a H4 channel resistance taken from the high 18167. This – coupled with daily resistance lurking just below at 17894 could see price bounce lower today. The only grumble we would have selling from here is the fact that weekly action has just rallied from weekly support chalked up at 17606. Therefore, waiting for lower timeframe confirmation is a MUST for us! Confirmation could be either an engulf of demand and subsequent retest, a break/retest of a trendline or simply a collection of selling wicks around a lower-timeframe resistance hurdle. In the event that we manage to pin down a setup, the first take-profit target would be around H4 support at 17789.
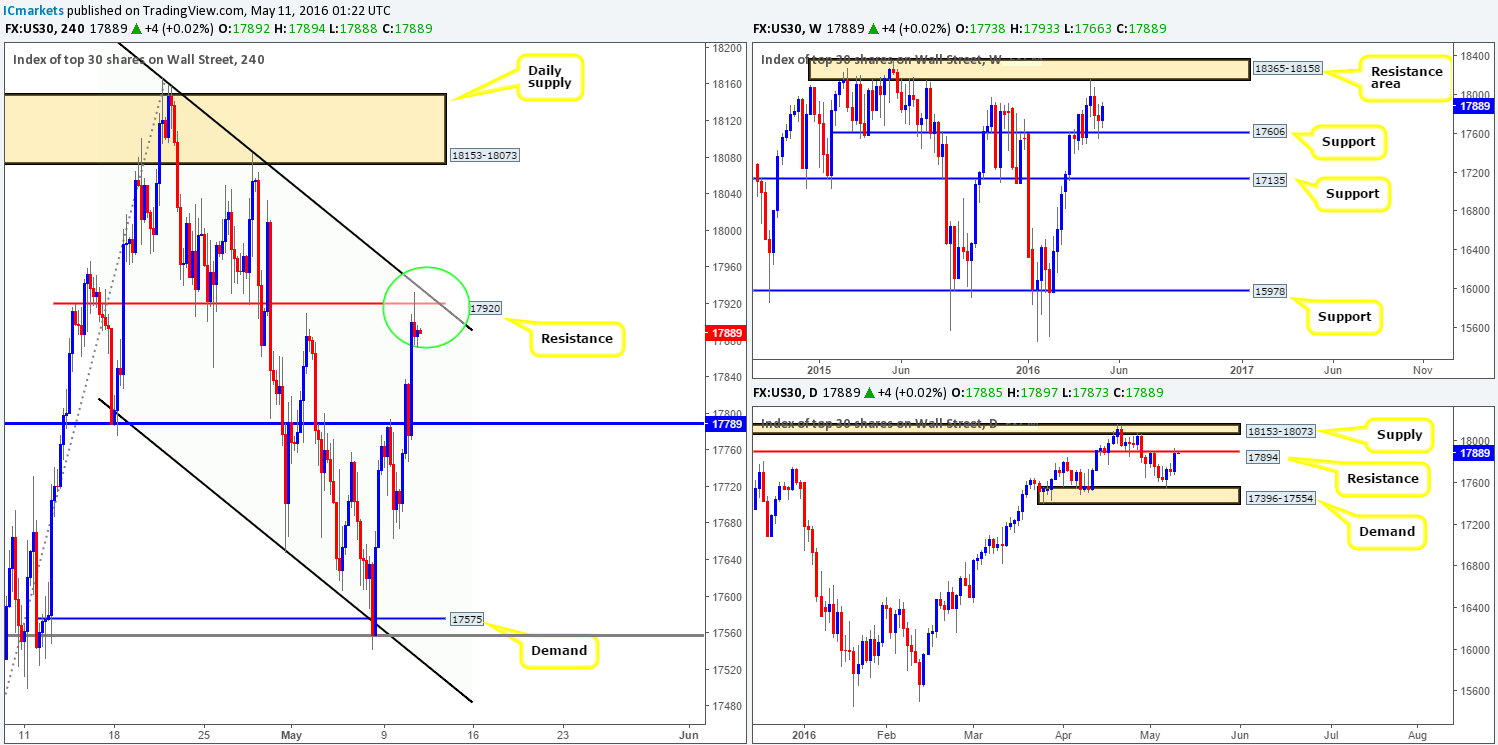
Levels to watch/live orders:
- Buys: Flat (Stop loss: N/A).
- Sells: 17920 region [Tentative – confirmation required] (Stop loss: dependent on where one confirms this area).
GOLD:
Going into yesterday’s U.S. open, the yellow metal found renewed strength from around H4 demand seen at 1252.9-1256.8, aided by the USDX topping out around the 94.331 region. This, as you can see, has placed Gold around H4 resistance coming in at 1269.6. Shorting from this line or the H4 supply seen above at 1273.4-1271.1 could be something to consider today due to weekly action selling-off from weekly supply at 1307.4-1280.0. However, do take note that daily movement is holding firm from daily demand at 1270.8-1257.5. As such, before contemplating a sell from either of the above said H4 areas, we would require lower timeframe price action to confirm that selling interest resides here (for confirmation techniques, please see the top of this report).
In the event that the metal continues to be bought, nevertheless, a close above the near-term H4 supply would be interesting since there’s little H4 resistance in view until H4 supply seen at 1295.4-1291.9. In spite of this, buying above this zone would place you face-to-face with weekly sellers, so trade cautiously if you plan on entering long from this region!
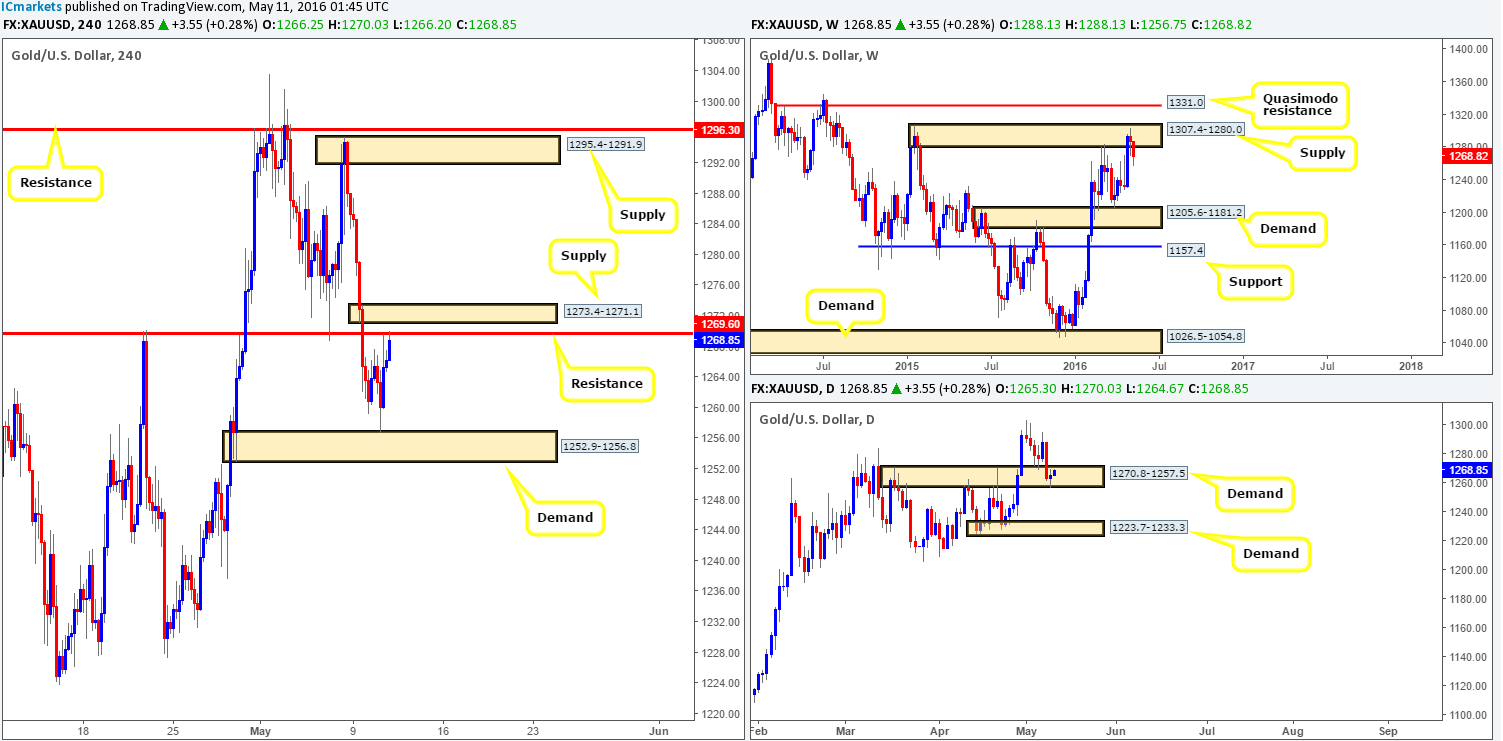
Levels to watch/live orders:
- Buys: Flat (Stop loss: N/A).
- Sells: 1269.6 region [Tentative – confirmation required] (Stop loss: dependent on where one confirms this area). 1273.4-1271.1 [Tentative – confirmation required] (Stop loss: dependent on where one confirms this area).


