Waiting for lower timeframe confirmation is our main tool to confirm strength within higher timeframe zones, and has really been the key to our trading success. It takes a little time to understand the subtle nuances, however, as each trade is never the same, but once you master the rhythm so to speak, you will be saved from countless unnecessary losing trades. The following is a list of what we look for:
- A break/retest of supply or demand dependent on which way you’re trading.
- A trendline break/retest.
- Buying/selling tails/wicks – essentially we look for a cluster of very obvious spikes off of lower timeframe support and resistance levels within the higher timeframe zone.
- Candlestick patterns. We tend to stick with pin bars and engulfing bars as these have proven to be the most effective.
We typically search for lower-timeframe confirmation between the M15 and H1 timeframes, since most of our higher-timeframe areas begin with the H4. Stops are usually placed 1-3 pips beyond confirming structures.
EUR/USD:
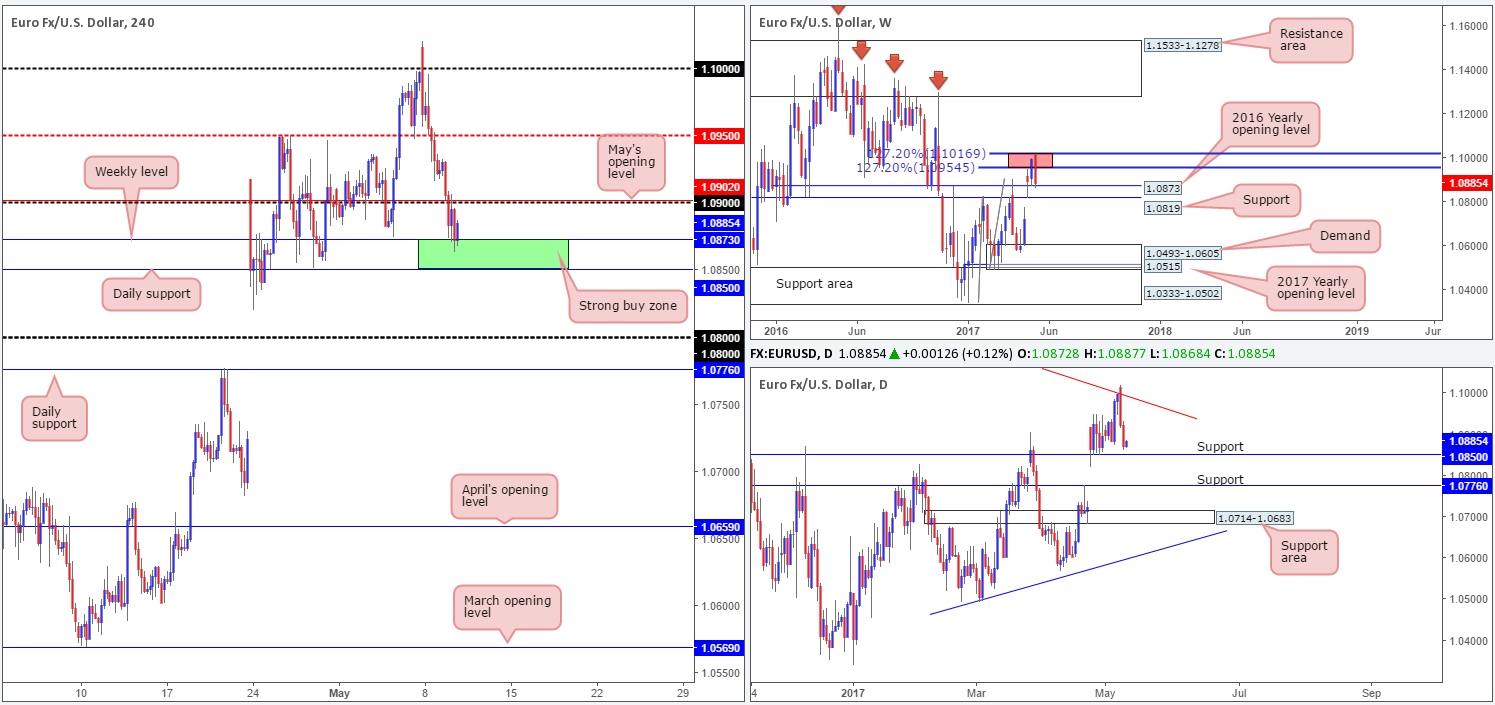
Recent action shows that the single currency extended Monday’s bounce from the 1.10 region, breaking through May’s opening level at 1.0902/psychological handle 1.09. Consequent to this, the pair now finds itself at a rather critical crossroads: the weekly support level (2016 yearly opening line) at 1.0873 and the daily support band coming in at 1.0850 (green zone).
However, entering long here is a little unsettling given the nearby 1.09 base lurking just above.
Our suggestions: On account of this, our team has decided that in order to become buyers in this market we would need to witness a reasonably sized H4 bullish rotation candle form within the noted green zone (preferably a full-bodied candle). A strong rotation – coupled with the aforementioned higher-timeframe support structures would, in our opinion, be enough evidence to suggest the bulls are back in the game and are likely going to push above the 1.09 neighborhood.
Data points to consider: ECB President Draghi speaks at 1pm GMT+1.
 Levels to watch/live orders:
- Buys: 1.0850/1.0873 ([waiting for a reasonably sized H4 bull candle [preferably a full-bodied candle] to form before pulling the trigger is advised] stop loss: ideally beyond the candle’s tail).
- Sells: Flat (stop loss: N/A).
GBP/USD:
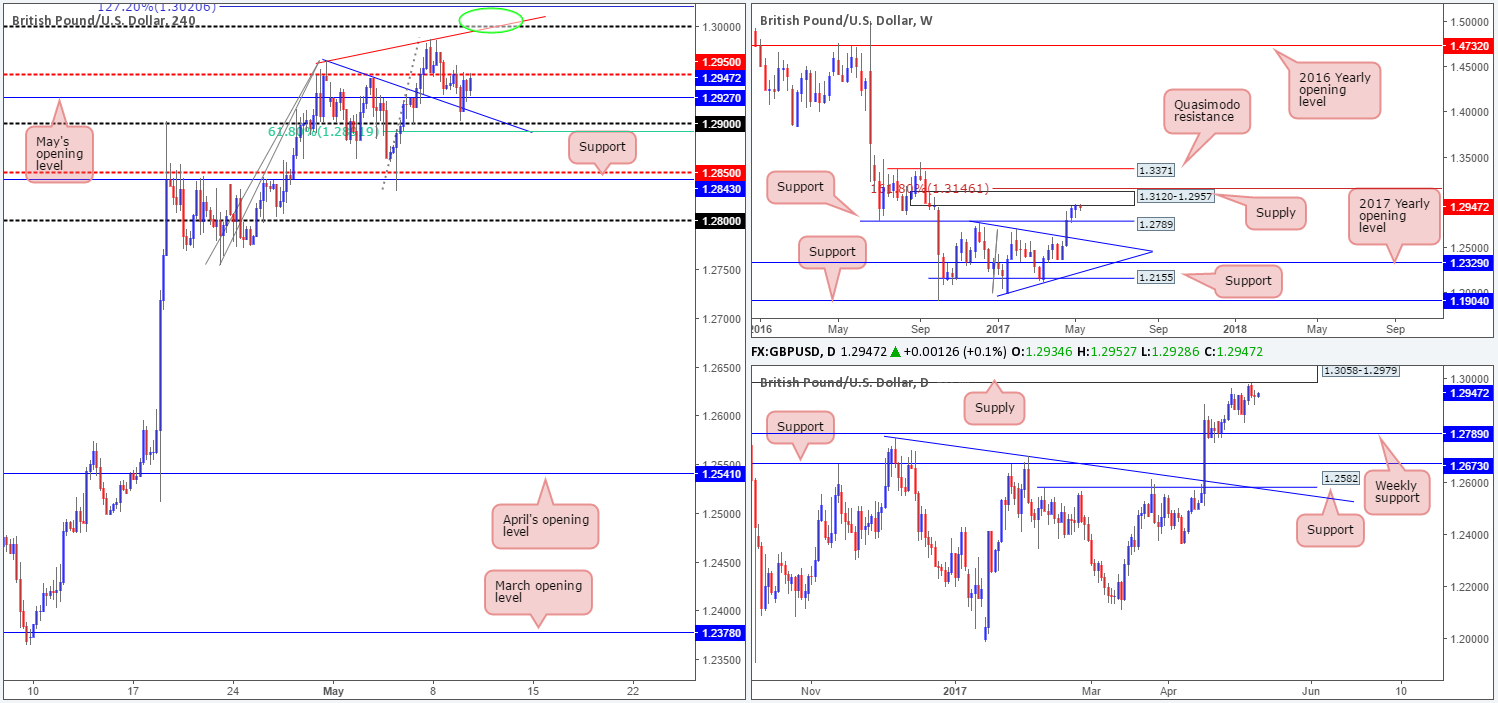
GBP/USD prices are little changed this morning, despite an earnest attempt seen from the bears to push this market lower. As we write, the bulls look poised to break back above the H4 mid-level resistance barrier coming in at 1.2950. This is not really something our team anticipated given that both weekly and daily action are currently seen trading around the underside of supplies at the moment (1.3120-1.2957/1.3058-1.2979).
A decisive push above the 1.2950 neighborhood today, however, would bring the large psychological boundary 1.30 into view. This number is not only positioned within the walls of both the noted higher-timeframe supplies, it also boasts H4 trendline resistance extended from the high 1.2965, and a nearby 127.2% H4 Fib’ ext. at 1.3020 taken from the low 1.2754.
Our suggestions: 1.30, in our estimation, offers a respectable level to short from. Should H4 price shake hands with this number today, we would, dependent on the time of day, short from here with stops placed at 1.3023 (a few pips beyond the above said 127.2% H4 Fib’ ext. level).
Data points to consider: No high-impact news seen on the docket today.
Levels to watch/live orders:
- Buys: Flat (stop loss: N/A).
- Sells: 1.30 (stop loss: 1.3023).
AUD/USD:
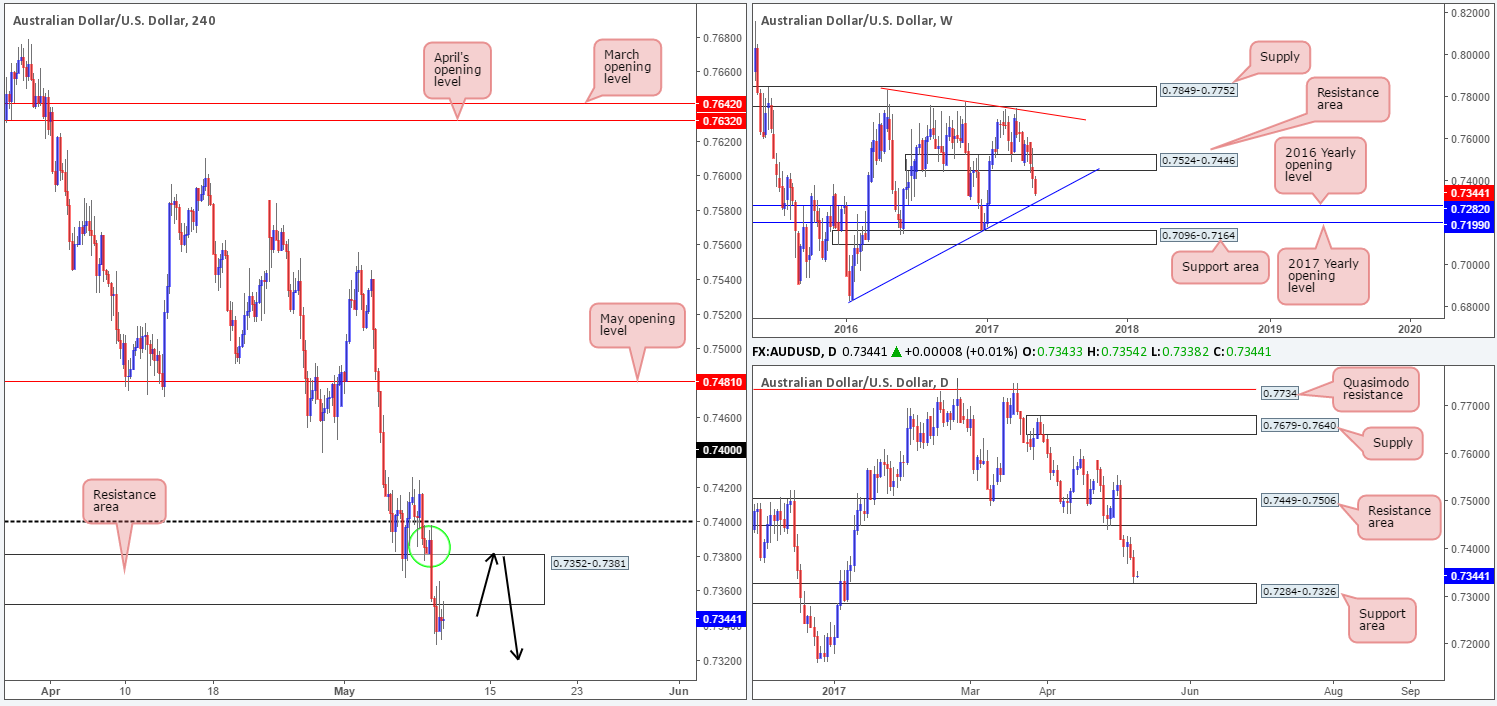
The commodity currency came under fresh selling pressure in early trading yesterday, following a lower-than-expected Aussie retail sales report. The move forced the unit to break below the H4 demand base at 0.7352-0.7381, which, as you can see, is now an acting resistance area. The next support target on the hit list can be seen around the 0.73 handle.
Over on the bigger picture, we can see that weekly price is edging closer to the trendline support extended from the low 0.6827/2016 yearly opening level at 0.7282. Down on the daily chart, nevertheless, price is seen within striking distance of a support area drawn from 0.7284-0.7326.
Our suggestions: With no active demand in play right now, our team is drawn to shorts. The area that’s really taken our fancy is the H4 supply zone seen planted just below the 0.74 handle circled in green at 0.7398/0.7382, which happens to offer fantastic risk/reward down to 0.73.
To avoid the possibility of getting stopped out on a fakeout around the 0.74 handle, we’d strongly recommend waiting for a reasonably sized H4 bearish candle to form, preferably a full-bodied candle, before committing.
Data points to consider: Chinese inflation data at 2.30am GMT+1.
Levels to watch/live orders:
- Buys: Flat (stop loss: N/A).
- Sells: 0.7398/0.7382 ([waiting for a reasonably sized H4 bear candle [preferably a full-bodied candle] to form before pulling the trigger is advised] stop loss: ideally beyond the candle’s wick).
USD/JPY:
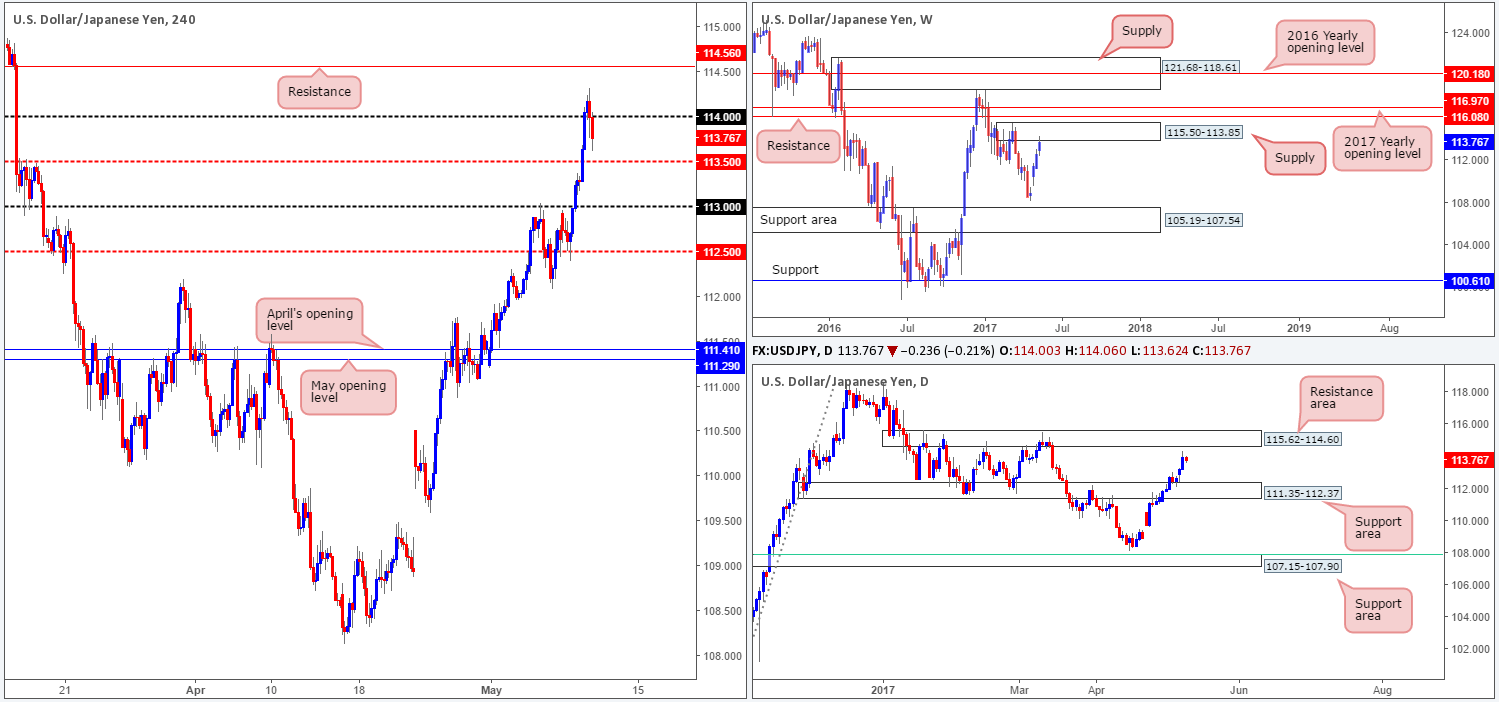
In recent trading, the USD/JPY continued to advance north and pushed through offers around the 114 handle. As you can see though, the bulls struggled to maintain composure above 114 and is now seen hovering above the H4 mid-level support at 113.50.
This weakness, at least from a technical standpoint, can likely be attributed to the weekly supply recently brought into the picture at 115.50-113.85. However, do bear in mind that down on the daily chart, there’s room seen to advance north up to a resistance area coming in at 115.62-114.60.
Our suggestions: It’s a bit of a tricky market to read this morning. On the one hand, weekly bears could continue to push lower, but on the other hand, there’s potential for further buying according to daily structure. Therefore, our team has come to the conclusion that remaining flat may be the better path to take today.
Data points to consider: No high-impact news seen on the docket today.
Levels to watch/live orders:
- Buys: Flat (stop loss: N/A).
- Sells: Flat (stop loss: N/A).
USD/CAD:
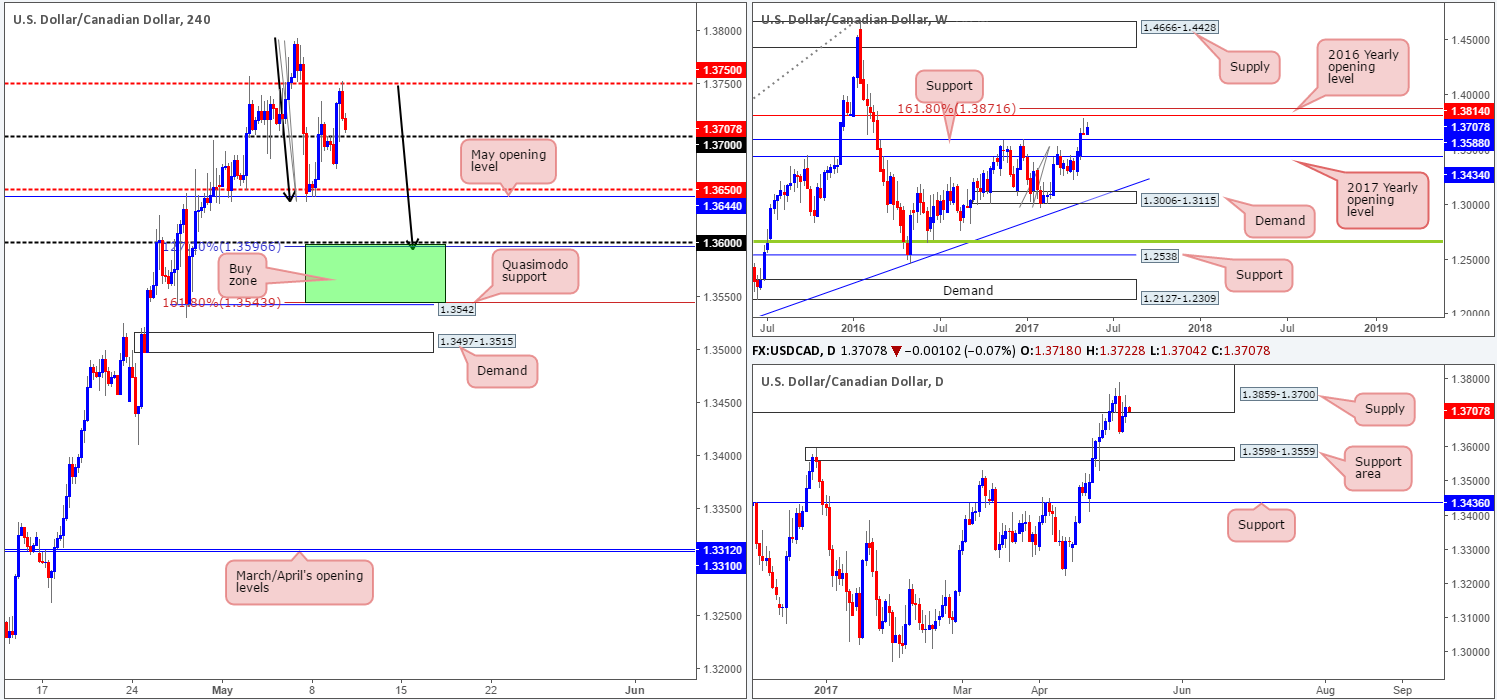
Beginning with the weekly timeframe this morning, the pair remains trading mid-range between the 2016 yearly opening level at 1.3814/161.8% Fib’ extension at 1.3871 taken from the low 1.2968, and weekly support from 1.3588. Slipping down to the daily candles, price continues to tease supply coming in at 1.3859-1.3700.
As highlighted in Tuesday’s report, there’s a possible H4 AB=CD structure drawn from the high 1.3793 (black arrows) currently forming. Although the 1:1 pattern terminates just below the 1.36 handle, a bullish rotation from here is still highly likely. Note the daily support area at 1.3598-1.3559 and the weekly support level at 1.3588!
Our suggestions: Long opportunities between the 127.2/161.8% H4 AB=CD Fib’ extensions at 1.3542/1.36 are still a possibility. In an ideal world, however, we’d want to see a reasonably sized H4 full-bodied bull candle form within this green zone. The reason we require additional confirmation here is to avoid the possibility of getting stopped out on any fakeout seen to the H4 demand planted below at 1.3497-1.3515.
Data points to consider: No high-impact news seen on the docket today.
Levels to watch/live orders:
- Buys: 1.3542/1.36 ([waiting for a reasonably sized H4 bull candle [preferably a full-bodied candle] to form before pulling the trigger is advised] stop loss: ideally beyond the candle’s tail).
- Sells: Flat (stop loss: N/A).
USD/CHF:
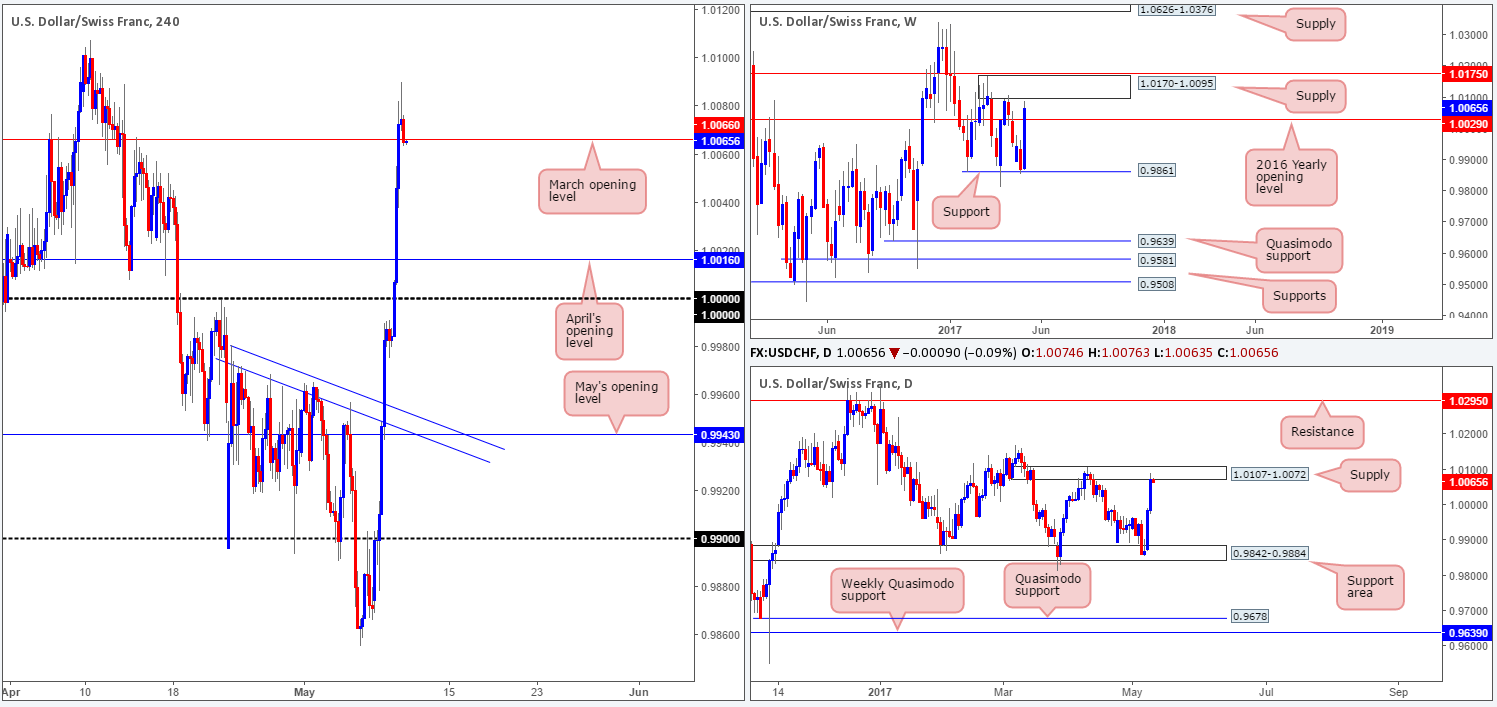
Dollar bulls, once again, went on the offensive yesterday, running through multiple H4 tech resistances along the way! With the pair now seen trading below March’s opening level at 1.0066, where does one go from here? Well, we can see that weekly price came within reaching distance of supply drawn from 1.0170-1.0095. Also of note is the fact that the daily candles recently connected with a supply zone coming in at 1.0107-1.0072, which is actually seen glued to the underside of the said weekly supply.
In view of the higher-timeframe structures, our team favors the downside at the moment.
Our suggestions: Drill down to the lower timeframes and watch for signs of bearish strength around March’s opening line at 1.0066. This could be either an engulf of demand followed up with a retest as supply, a trendline break/retest or simply a collection of lower-timeframe selling wicks. We typically search for lower-timeframe confirmation between the M15 and H1 timeframes, since most of our higher-timeframe areas begin with the H4. Stops are usually placed 1-3 pips beyond confirming structures.
Data points to consider: No high-impact news seen on the docket today.
Levels to watch/live orders:
- Buys: Flat (stop loss: N/A).
- Sells: 1.0066 region ([waiting for a lower-timeframe sell signal to form before pulling the trigger is advised] stop loss: dependent on where one confirms this area).
DOW 30:
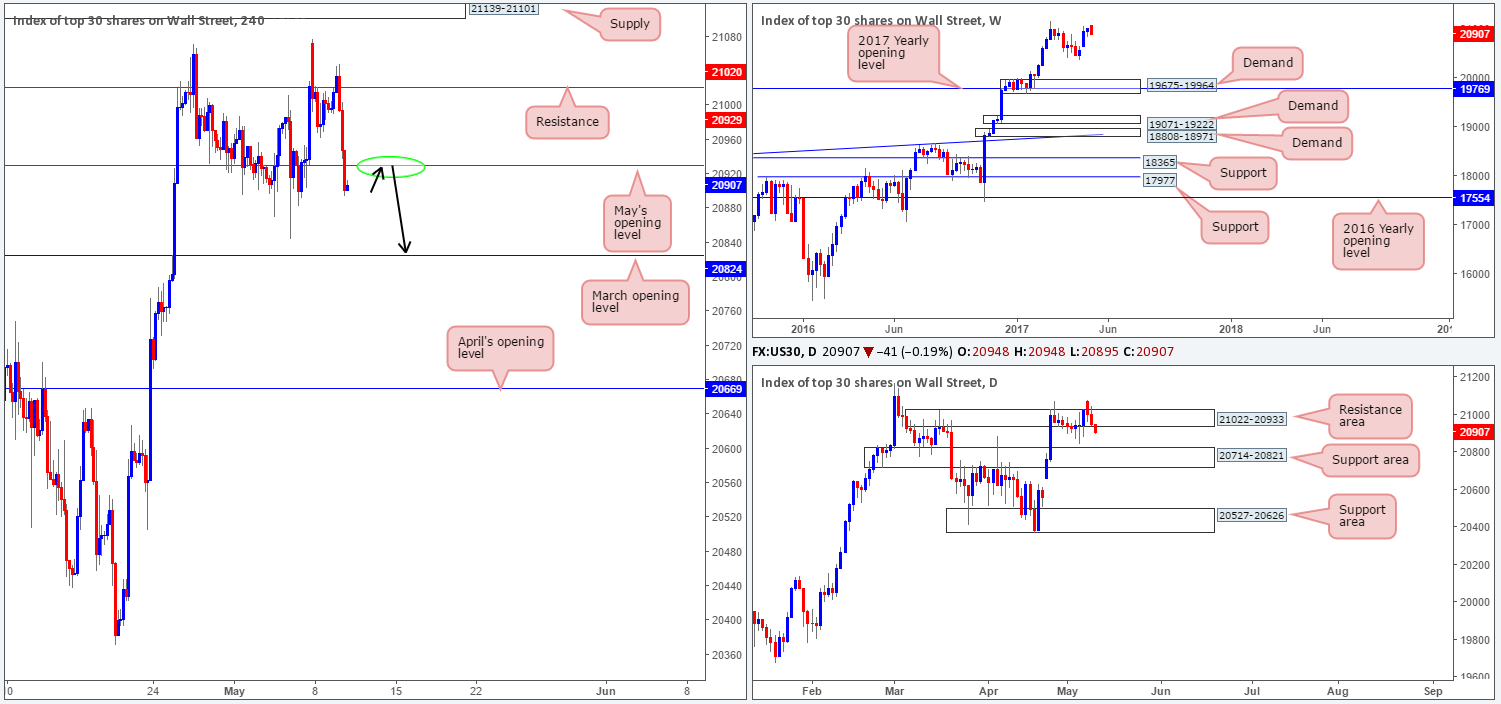
Going into the early hours of yesterday’s US segment, US equities tumbled lower. In recent hours, May’s opening level at 20929 was taken out; potentially opening the floor to a move down to March’s opening base line at 20824. According to Bloomberg, the recent decline was due to a North Korean envoy saying the country will proceed with a sixth nuclear test.
Technically, the daily candles are free to continue dropping lower, at least until we reach the support area coming in at 20714-20821, and weekly price remains trading nearby record highs at 21170.
Our suggestions: Given the above information, we’re going to be looking for a reasonably sized H4 bear candle to form off May’s opening level today. In the event that this comes to fruition, we’ll look to short and target March’s opening level.
Data points to consider: No high-impact news seen on the docket today.
Levels to watch/live orders:
- Buys: Flat (stop loss: N/A).
- Sells: 20929 region ([waiting for a reasonably sized H4 bear candle [preferably a full-bodied candle] to form before pulling the trigger is advised] stop loss: ideally beyond the candle’s wick).
GOLD:
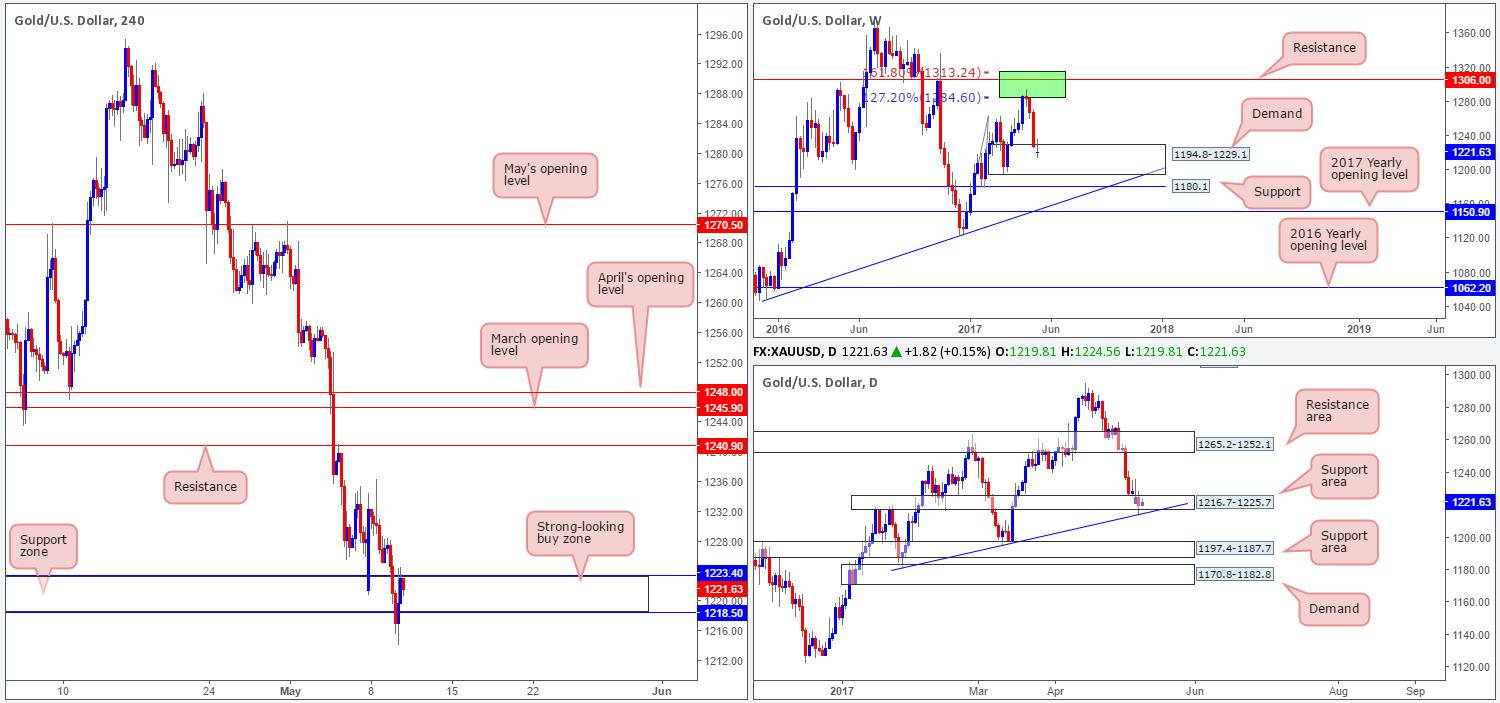
In view of the weekly picture this morning, the buyers and sellers remain battling for position within the walls of demand coming in at 1194.8-1229.1. Along the same lines, daily price recently whipsawed through the lower edge of a support area and tagged in a trendline support etched from the low 1180.4. Therefore, higher-timeframe structure continues to favor the bulls at this point.
Over on the H4 chart, the support zone at 1218.5-1223.4 (seen lodged within the limits of the said weekly and daily structures) remains intact after suffering a rather brutal whipsaw yesterday. Ultimately, we still have interest in buying from this zone, but only on the grounds that a reasonably sized H4 bull candle present itself here – a full-bodied candle would be perfect. As for take-profit targets, the H4 resistance at 1240.9 still looks reasonable for partial profits.
Levels to watch/live orders:
- Buys: 1218.5/1223.4 ([waiting for a reasonably sized H4 bull candle to form before pulling the trigger is advised] stop loss: ideally beyond the candle’s tail).
- Sells: Flat (stop loss: N/A).


