EUR/USD:
Weekly view – From the weekly timeframe, we can see that price is now crossing swords with the weekly supply area coming in at 1.1532-1.1278 again. This supply zone is a very significant hurdle in our opinion since if there is a sustained break above this area, our long-term bias on this pair will very likely shift north.
Daily view: Following Monday’s rebound from the daily swap area marked in yellow at 1.1051-1.1000; price went on to print an indecision candle during yesterday’s session. A small advance from this point today will likely see the Euro connect with a nearby daily Quasimodo cluster zone coming in at 1.1390/1.1421 (located relatively deep within the aforementioned weekly supply area).
4hr view: The 4hr timeframe shows that price faked above the round number 1.1300 into an area of 4hr supply at 1.1397-1.1365 during the early hours of the European open. The sell off from here continued into London and saw price drop to a low of 1.1212, which, as you can see, provided enough support for active buyers to enter the market going into the U.S session.
With the weekly timeframe showing price trading at supply, and the daily timeframe loitering only a few pips below a daily Quasimodo cluster zone (see above), buying this market, unless for a very small intraday trade, is out of the question for us.
As for selling, we will not be interested in shorting this market until price at least enters into the yellow zone (1.1411/1.1378) – an even better area, however, would be the 4hr Quasimodo resistance base seen just above it in green at 1.1443-1.1411. The reason for selecting the aforementioned 4hr areas is simply because these zones are located not only around the aforementioned daily Quasimodo cluster area, but are also sitting deep within the aforementioned weekly supply zone – a fantastic area to be looking for confirmed shorts into the market!

Levels to watch/live orders:
- Buys: Flat (Stop loss: N/A).
- Sells: 1.1443/1.1378 [Tentative – confirmation required] (Stop loss: 1.1449).
GBP/USD:
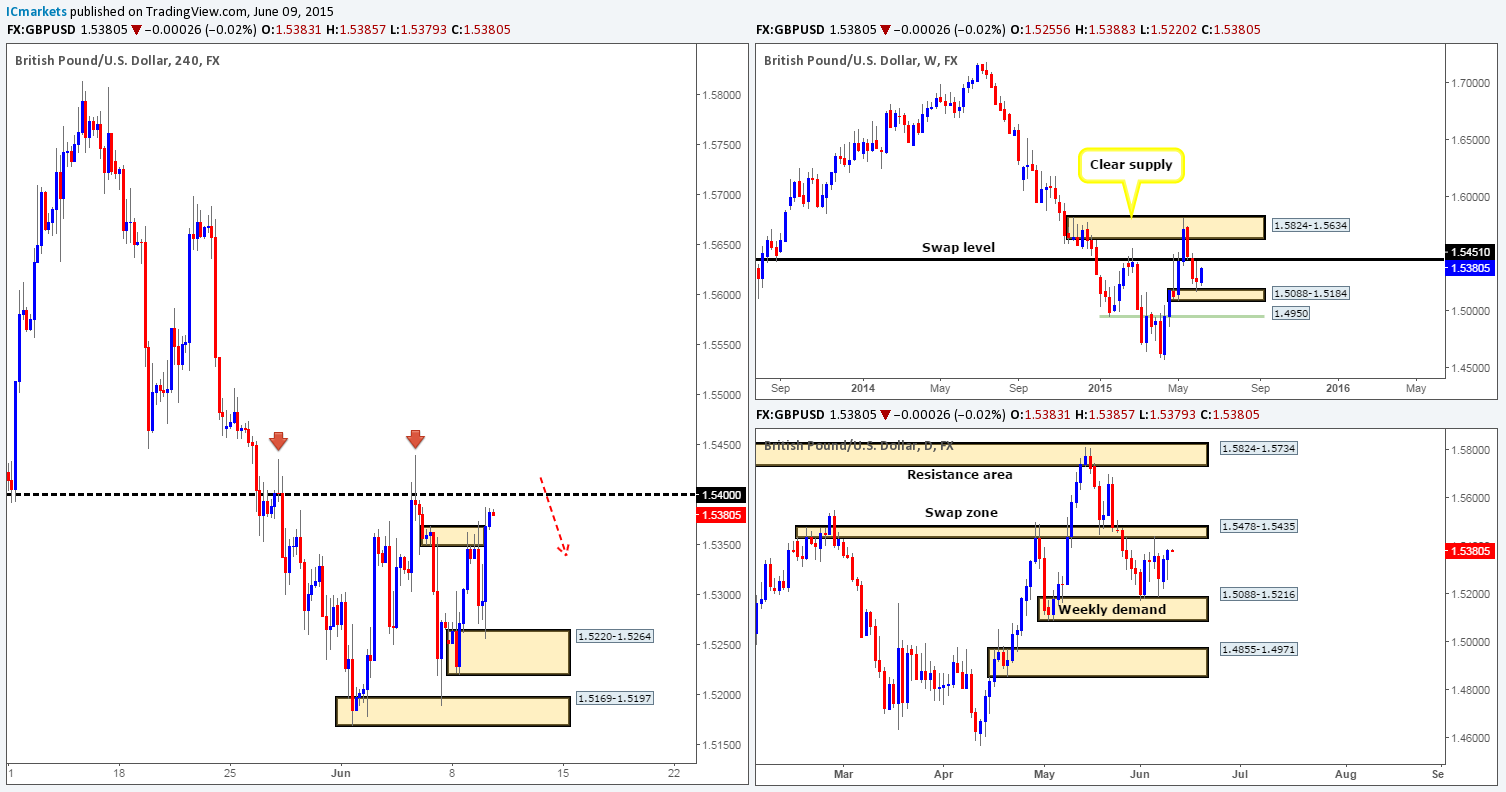
Weekly view – The weekly timeframe shows that buyers continue to show interest from a small weekly demand area at 1.5088-1.5184. In the event that this buying continues, price will likely shake hands with the weekly swap level seen at 1.5451 sometime soon.
Daily view: From this angle, we can now see that price is trading around fifty pips or so below a proven daily swap zone coming in at 1.5478-1.5435.
4hr view: During yesterday’s sessions, price did in fact sell off from the small 4hr supply area at 1.5368-1.5349. This consequently forced the market to test a 4hr demand area at 1.5220-1.5264, which, as you can see, was clearly enough to support a counter-attack.
With all of the above taken into consideration, the GBP will likely continue to drive north today and connect with the 1.5400 barrier, which is an area we feel a reaction will be seen. Check out the two red arrows on this chart. The way 1.5400 held the market lower here was very impressive! With that being said, take a look across to the daily chart; see how the wicks that projected above 1.5400 collided beautifully with the daily swap zone at 1.5478-1.5435. This is something we all need to be prepared for again here guys if we look to short 1.5400. It’s a perfect fakeout scenario!
For us to consider shorting 1.5400, we would want to see a bearish selling tail form around 1.5400, essentially another fakeout up to the aforementioned daily swap zone.
Levels to watch/ live orders:
- Buys: Flat (Stop loss: N/A).
- Sells: 1.5400 [Fakeout will need to be seen first] (Stop loss: depends on how deep the fakeout is).
AUD/USD:
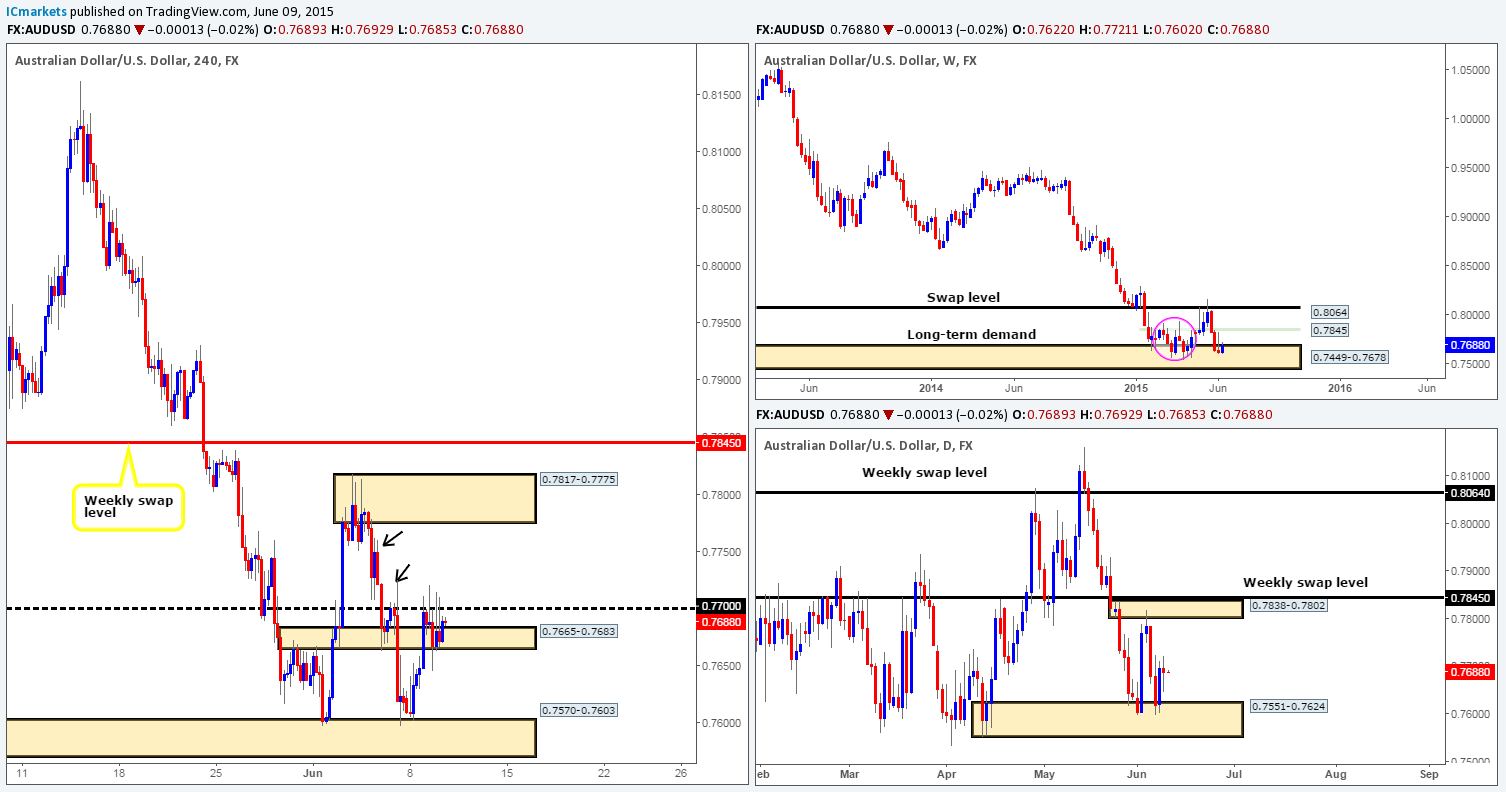
Weekly view – Following the push seen into the weekly demand area at 0.7449-0.7678, last week’s trading action shows that price printed an inverted weekly pin-bar candle. To some traders this may be a sign that the market wants higher prices – a reversal signal, and they could very well be right considering where the candle pattern formed. Nevertheless, Judging by the sloppy reaction seen (pink circle – 02/02/15-06/04/15) at this zone a few months earlier, things could potentially get messy here before we see any decisive move take place. From a long-term perspective, the trend direction on this pair is still very much south in our opinion, and will remain this way until we see a convincing break above 0.8064.
Daily view: From this angle, we can see that the buyers remain in a relatively strong position above the daily demand area seen at 0.7551-0.7624 (located within the aforementioned weekly demand area). On the condition that this buying continues, we might, just might, see price challenge the small daily supply area at 0.7838-0.7802 (positioned just below a minor weekly swap level at 0.7845) sometime this week.
4hr view: For those who follow our reports on a regular basis, you may recall that we were filled long at 0.76230 on Monday, which as you can see, is still sitting nicely in the green.
From a technical standpoint, there has not been much change since yesterday as the buyers and sellers continued to battle for position between 0.7700 and a 4hr swap area at 0.7665-0.7683. Ultimately, we would like to see price push above 0.7700 later on today, since from above 0.7700 our second and final take-profit target – the 4hr supply area at 0.7817-0.7775 (located within the aforementioned daily supply area) would more than likely be hit. Equally important, however, is that a break above 0.7700 potentially opens up the door to a second buying opportunity. If 0.7700 is retested as support and shows some form of lower timeframe confirming price action at this number, we’d happily take another long entry here and use the same take-profit target as what we have on our current long. Why we believe the path north is clear above 0.7700 up to the 4hr supply area at 0.7817-0.7775 simply comes from the two supply consumption wicks seen marked with black arrows at 0.7725 and 0.7760.
Levels to watch/ live orders:
- Buys: 0.76230 [Live] (Stop loss: Breakeven).
- Sells: Flat (Stop loss: N/A).
USD/JPY:
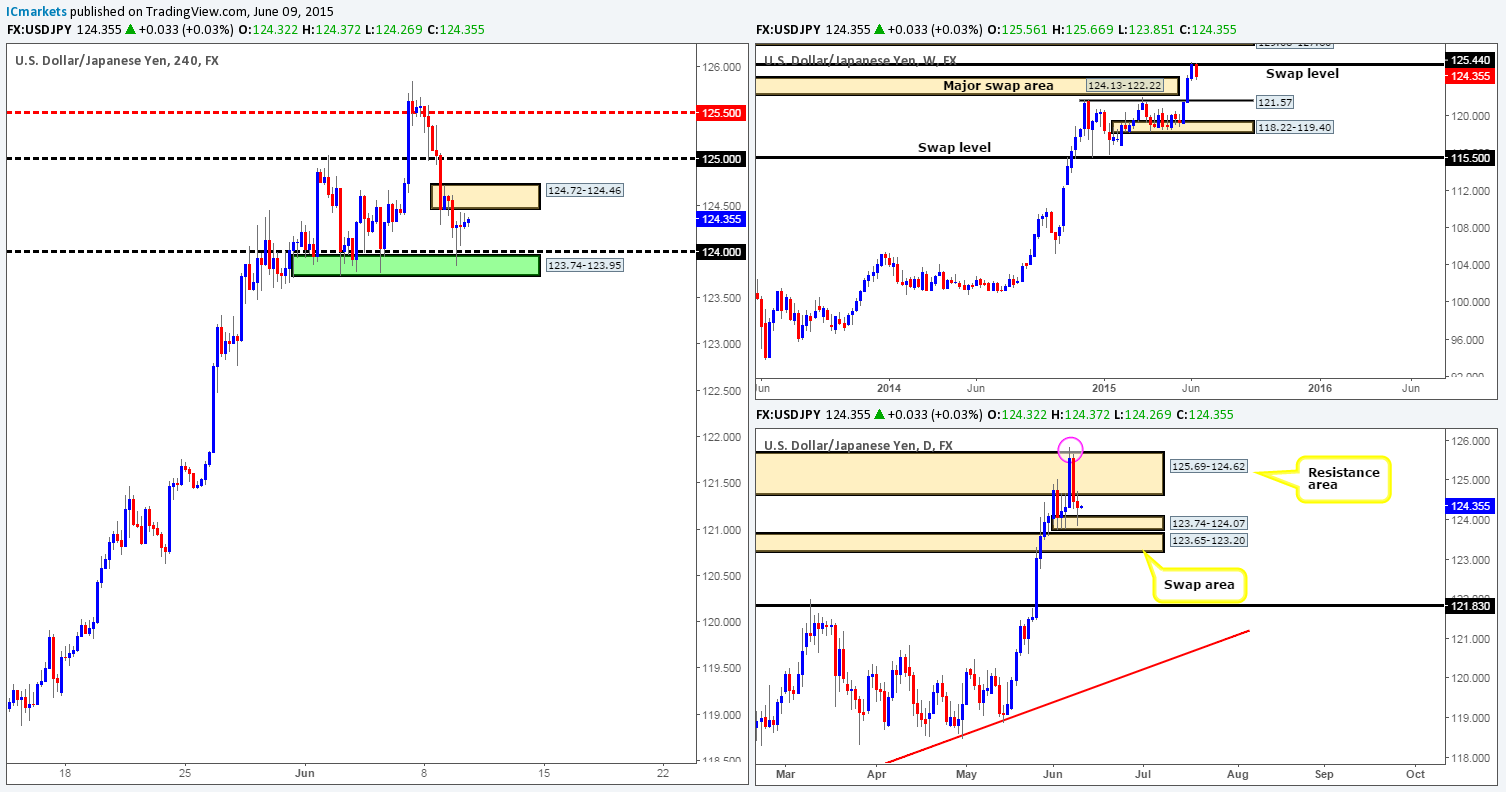
Weekly view – The weekly timeframe shows that price has rallied for three consecutive weeks, which took out a weekly supply area at 124.13-122.22, and connected nicely with a weekly swap level seen at 125.44. Essentially, the long-term uptrend on this pair is still very much intact, and will remain that way in our opinion until the weekly swap level 115.50 is consumed.
Daily view: From this viewpoint, we recently witnessed price crossing swords with a daily demand seen at 123.74-124.07, which has held nicely so far.
4hr view: For those who read our reports on a regular basis, you may recall that we set a pending buy order (123.94) just within a 4hr buy area marked in green at 123.74-123.95 that has now been filled.
With the recent break above the daily resistance area (see daily chart) at 125.69-124.62 (pink circle), and the recently broken weekly supply area (see weekly chart) at 124.13-122.22 now potentially providing demand to the market, we are quite confident price is eventually going to continue heading higher in the long run.
Currently, our team is watching the 4hr supply zone seen at 124.72-124.46. We would like to see the buyers break above this barrier and connect with 125.00, which is where we intend to take partial profits and possibly move our stop to breakeven. If all goes according to plan, we essentially have no final target in place yet for this long trade. The idea is effectively to try and let this trade run, in the hope of joining the long-term weekly trend and trailing our stop accordingly. It will be interesting to see how this plays out.
Levels to watch/ live orders:
- Buys: 123.94 [Live] (Stop loss: 123.44).
- Sells: Flat (Stop loss: N/A).
USD/CAD:
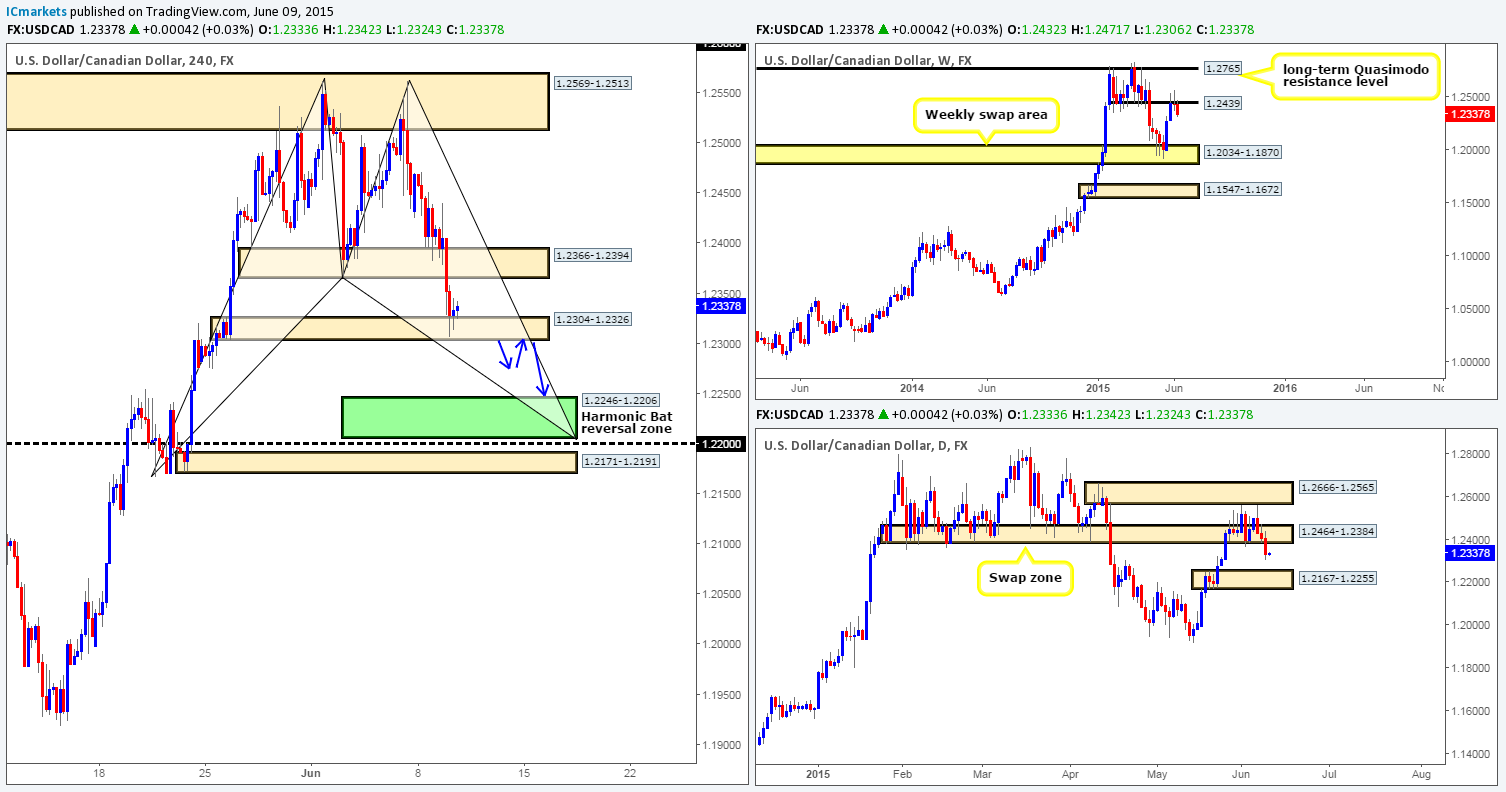
Weekly view – After a little tug-of-war around the weekly swap level 1.2439, the sellers, at this point in time, appear to be taking control. Overall though, our long-term bias on this pair is long. It will only be once we see a break below the aforementioned weekly swap area would our present bias likely shift.
Daily view: From this angle, it is clear to see that price has broken below the daily swap zone seen at 1.2464-1.2384. As a result, we believe the path south is now likely clear for further downside towards the daily demand area coming in at 1.2167-1.2255.
4hr view: From this timeframe, we can see that the USD/CAD collapsed around the London open, consequently consuming the 4hr buy zone at 1.2366-1.2394, and colliding with a 4hr demand area at 1.2304-1.2326, which as you can see is holding at the moment. Considering the market’s overall position on the higher timeframes at present (see above), however, we hold very little faith in this current 4hr demand zone. In fact the most we see price rallying from here is up to around 1.2362 mark. With that being said, assuming we’re correct in our analysis, and price pushes below the 4hr demand area, our attention will then shift towards the 4hr Harmonic Bat reversal zone seen in green at 1.2246-1.2206 (located deep within the aforementioned daily demand area).
Of course, while we’re waiting for price to reach the aforementioned 4hr Harmonic barrier, one could, assuming a break lower does take place, look to sell on any retest that is seen (see blue arrows). With the right entry and stop here (will likely be found on the lower timeframes), this could potentially yield a clear eighty pip return.
Levels to watch/ live orders:
- Buys: Flat (Stop loss: N/A).
- Sells: Flat (Stop loss: N/A).
USD/CHF:
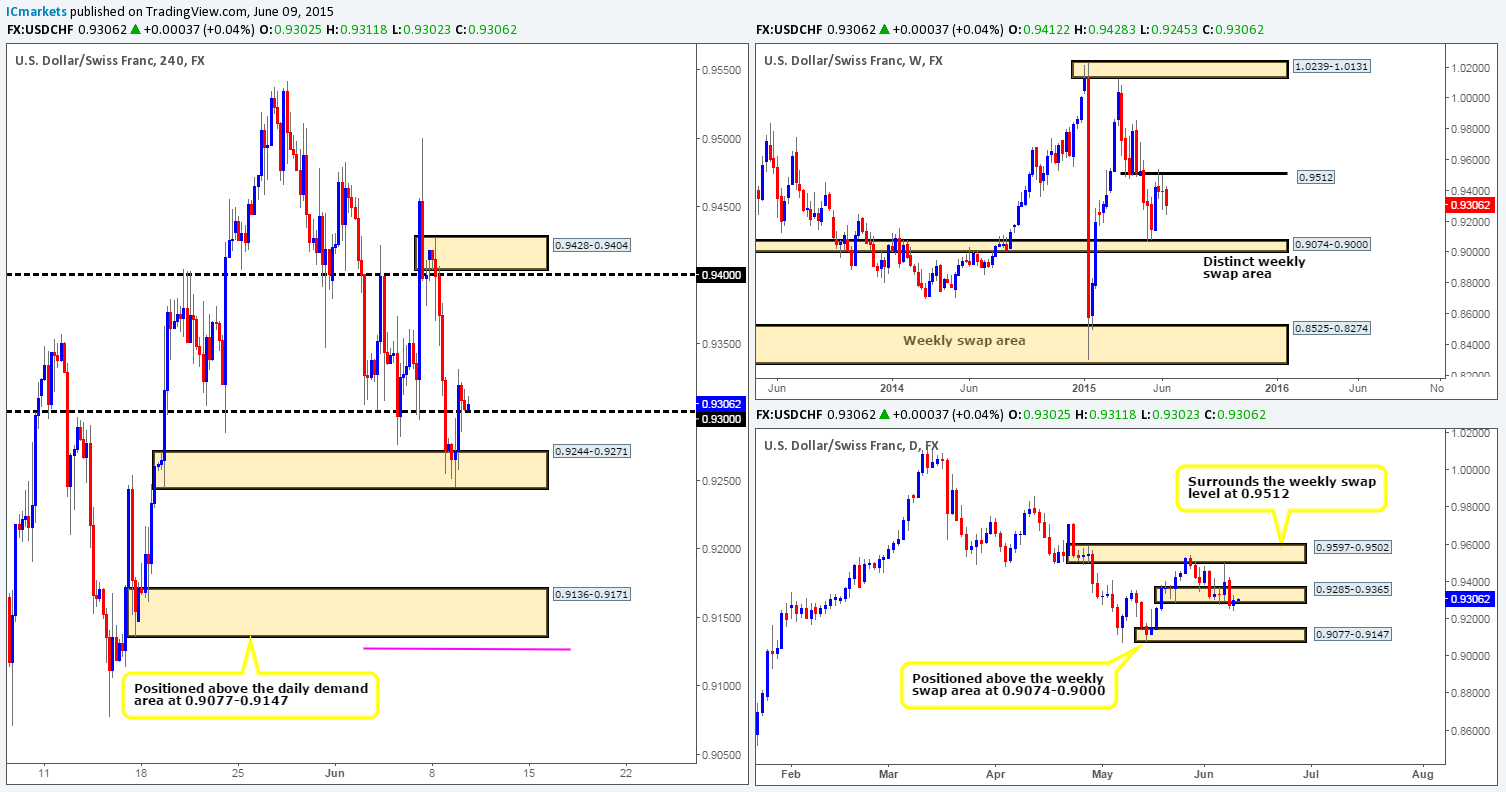
Weekly view – Last week’s trading shows that the USD/CHF pair managed to hold out below the weekly swap level at 0.9512, which as you can probably see formed a weekly indecision candle in the process. So far this week, however, the sellers appear to have regained control of this market. If this continues, its likely price will connect with the weekly swap area seen at 0.9074-0.9000.
Daily view: Following Monday’s push below the daily demand area at 0.9285-0.9365, we can see that price is currently retesting this zone as supply.
4hr view: After price collided with the 4hr demand area at 0.9244-0.9271, buying interest eventually came into the market; completely obliterating 0.9300 which as you can see is now being retested as support. Should this number hold going into the more liquid sessions today, we could potentially see this market rally up to 0.9400. However, in buying from this round-number barrier, you would in all likelihood be going up against not only supply from the daily timeframe, but also weekly sellers from the weekly swap level (see above). Therefore, as far as we can see, unless traders are willing to risk buying from 0.9300, there is no immediate opportunity to trade this pair.
Given the points made above, our team has come to a general consensus that remaining on the sidelines is by far the best position for us to take today
Levels to watch/ live orders:
- Buys: Flat (Stop loss: N/A).
- Sells: Flat (Stop loss: N/A).
US 30:
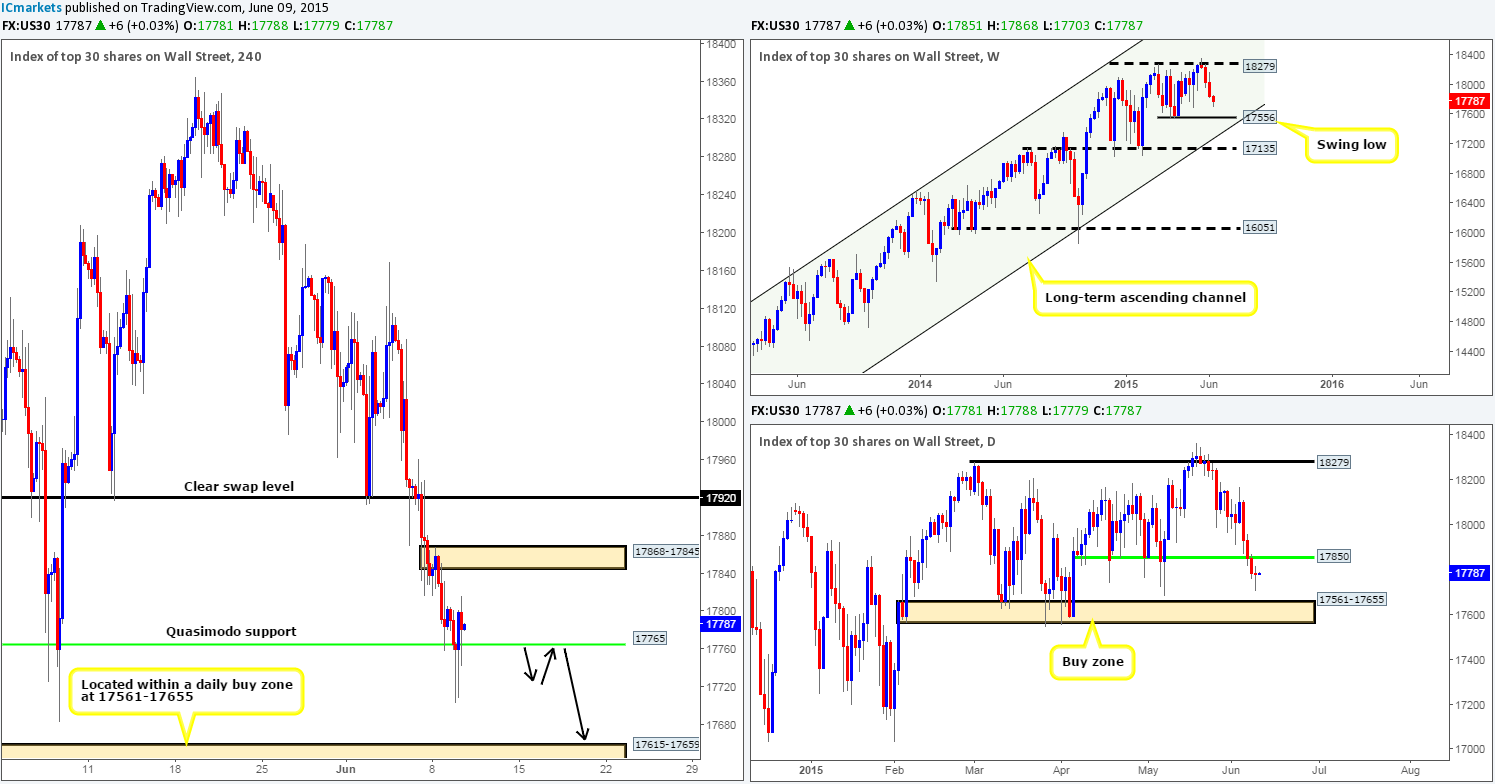
Weekly view – The weekly timeframe shows little sign of buying interest at the moment, as the sellers continue pounding this index south. Should the sellers maintain this position throughout the week, then we believe there is a good chance that price will connect with the weekly swing low coming in at 17556. Despite the recent decline in value, however, the uptrend on this index is still very strong, and will remain this way until see a convincing push below 16051.
Daily view: Following Monday’s close below daily support at 17850, price formed a somewhat indecisive candle going into yesterday’s close 17781. Should the sellers remain strong below the recently broken daily support barrier, its likely further downside will be seen towards a clear daily buy zone at 17561-17655 sometime soon.
4hr view: During yesterday’s sessions, we can see two vicious spikes penetrated through the 4hr Quasimodo support level at 17765. Other than this though, from a technical standpoint there has been little change seen on this index. As such most of today’s analysis will be very similar to yesterdays.
Taking into account where the market is trading on the higher timeframe picture at the moment (see above), we do not intend to take any further action on this instrument until a CONVINCING close below the aforementioned 4hr Quasimodo base is seen, as the pathway south should then be ‘support free’ so to speak down to a 4hr demand area coming in at 17615-17659 (located relatively deep within the aforementioned daily buy zone). Most of you who follow our analysis on a regular basis will already know that we’re not breakout traders, we prefer to wait for price to retest the broken area before making our decision, and this is exactly what we intend to do (see black arrows) should a break below 17765 take place today.
Levels to watch/ live orders:
- Buys: Flat (Stop loss: N/A).
- Sells: Flat (Stop loss: N/A).
XAU/USD (Gold)
Weekly view – For the past three weeks the gold market sold off, which as you can see, eventually clashed with a weekly demand area coming in at 1142.5-1167.3. From a long-term perspective, however, gold is still trending south in our opinion. For this bias to be invalidated, a push above the weekly trendline extended from the high 1488.0 would need to be seen.
Daily view: The daily timeframe on the other hand, reveals that price spiked below a proven daily buy zone at 1170.3-1184.0 on Friday that has so far held firm. On the condition that further buying comes into the market from here, it is likely a rally will ensue up to test the small daily supply area at 1196.2-1188.9.
4hr view: From the 4hr scale, we can see that once London opened its doors for business, the gold market rallied, consequently taking out a small 4hr supply area seen at 1178.4-1177.0. As far as we can see, this move has now opened the gates for price to challenge the next 4hr supply area seen above at 1187.0-1184.3.
With price sitting nicely around both weekly and daily demand zones (see above) at the moment, the focal point today will be the 4hr demand area seen below at 1169.4-1172.1. With that, our plan of action in the upcoming sessions is simple. If price hits this 4hr demand area before hitting the next area of supply above at 1187.0-1184.3 – our target (as per the blue arrows), then we’ll take a long position from around 1172.6 with a stop set just below at 1168.7. The risk/reward on this trade is around 2:5/3:0, which, as we’re sure you’ll agree is very attractive and well worth the risk.

Levels to watch/ live orders:
- Buys: 1172.6 (Stop loss: 1168.7).
- Sells: Flat (Stop loss: N/A).


