A note on lower timeframe confirming price action…
Waiting for lower timeframe confirmation is our main tool to confirm strength within higher timeframe zones, and has really been the key to our trading success. It takes a little time to understand the subtle nuances, however, as each trade is never the same, but once you master the rhythm so to speak, you will be saved from countless unnecessary losing trades. The following is a list of what we look for:
- A break/retest of supply or demand dependent on which way you’re trading.
- A trendline break/retest.
- Buying/selling tails/wicks – essentially we look for a cluster of very obvious spikes off of lower timeframe support and resistance levels within the higher timeframe zone.
- Candlestick patterns. We tend to stick with pin bars and engulfing bars as these have proven to be the most effective.
We search for lower timeframe confirmation between the M15 and H1 timeframes, since most of our higher-timeframe areas begin with the H4. Stops are usually placed 5-10 pips beyond confirming structures.
EUR/USD:
The shared currency began the week gapping over 80 pips lower, following news out over the weekend that the FBI concluded (and cleared) the investigation regarding Hilary Clinton’s email server. As can be seen from the H4 chart, the opening candle dented demand coming in at 1.1049-1.1060 and managed to rotate price and pierce through the 1.11 handle. Soon after, the pair topped out just ahead of July’s monthly open level 1.1112, before continuing to decline in value, which eventually printed a close beyond the aforementioned H4 demand (now acting supply).
Despite the close lower, the unit quickly caught a bid around a nearby H4 demand base seen at 1.1021-1.1034. Although this area may not be much to look at, it is quite a significant space. Not only is it underpinned by a daily demand at 1.1039-1.0998, it was also formed following the break of a mid-range H4 Quasimodo level seen marked with a black arrow at 1.1026.
Our suggestions: Technically speaking, we have no interest trading between the current H4 supply at 1.1049-1.1060 and H4 demand at 1.1021-1.1034.
Be that as it may, in the event of a close lower here, downside is rather limited on the H4 (albeit supported by price recently tagging the underside of a weekly supply seen at 1.1327-1.1139) as the key figure 1.10 lurks directly below. A close higher on the other hand, would likely place the 1.11 handle back on the hit list. Supported by the above said daily demand, a close higher followed by a retest and H4 bullish rejection is, at least according to our desk, sufficient enough to condone an intraday long position here, targeting 1.11.
Data points to consider: The main highlight today is, of course, the US elections. The event will highly likely stimulate market volatility, so any trades taken should be monitored closely!

Levels to watch/live orders:
- Buys: Watch for a close above the H4 supply at 1.1049-1.1060 and then look to trade any retest seen thereafter (H4 bullish close following the retest is required prior to entry – stop loss: ideally beyond the trigger candle).
- Sells: Flat (stop loss: N/A).
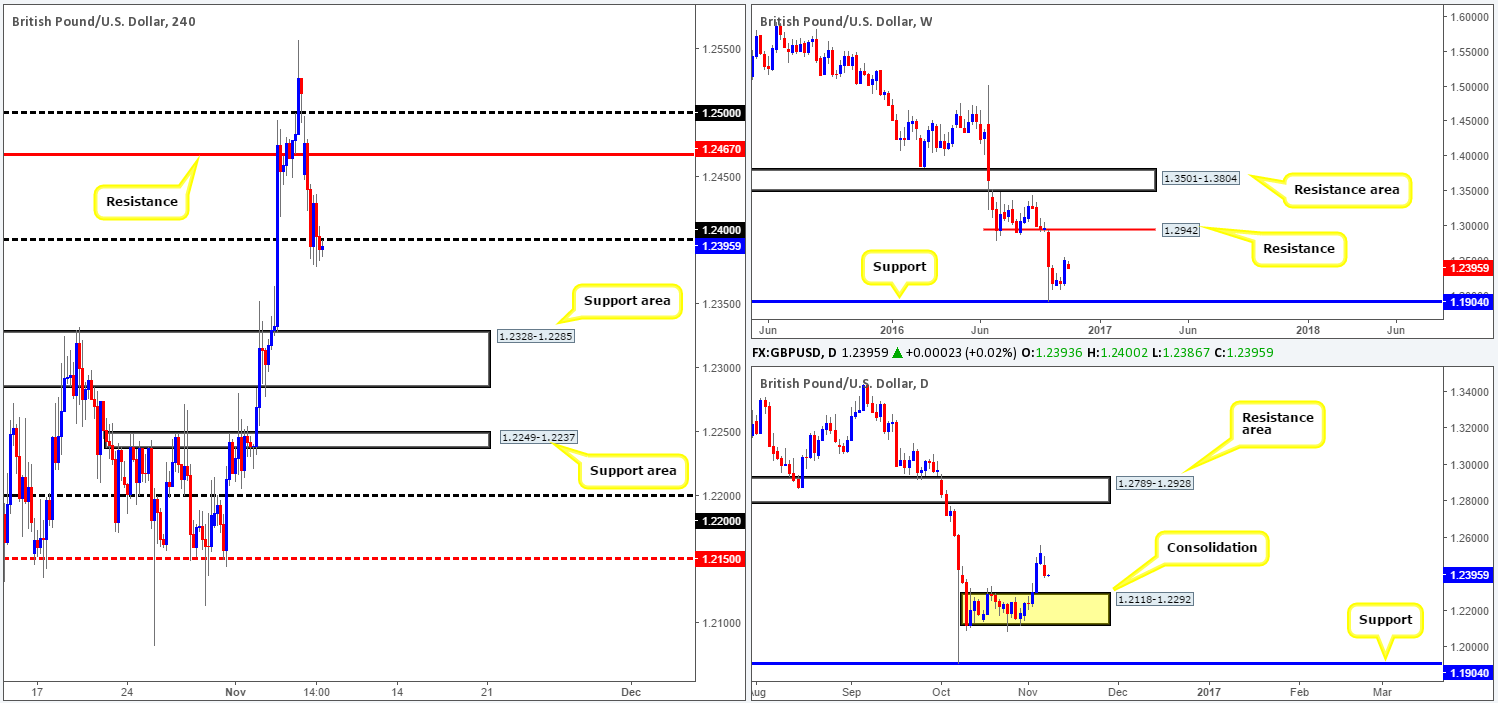
GBP/USD:
News over the weekend reported that the FBI cleared Hillary Clinton’s email case, which, as you can see, consequently sent the GBP over 60 pips lower at the beginning of the week. While the H4 bulls attempted to retaliate, downside pressure was just too strong, ending the day consolidating around the 1.24 handle. To our way of seeing things, bids around 1.24 appear vulnerable since price is seen retesting the underside of this number as we write. From a higher-timeframe structural standpoint, there’s little standing in the way of a move lower until we reach the top edge of the daily range fixed at 1.2292, which effectively represents the lower extreme of the H4 support area seen at 1.2328-1.2285 (an ideal take-profit zone for any shorts in this market).
Our suggestions: In light of the points made above, we’re going to be keeping a close eye on the 1.24 barrier today. Before considering a short from here, nevertheless, a lower timeframe sell signal (M15-H1 is where we generally watch for lower timeframe entries) is needed in the form of either a close below demand followed by a retest as supply, a trendline break/retest or simply a collection of well-defined selling wicks around the 1.24 line. Stops are usually placed 5-10 pips beyond confirming structures.
Data points to consider: Although the main focus is on the US elections today, do keep in mind that we also have UK factory production data set to hit the wire at 9.30am GMT.
Levels to watch/live orders:
- Buys: Flat (stop loss: N/A).
- Sells: 1.24 ([lower timeframe confirmation required prior to entry] stop loss: dependent on where one confirms this area).
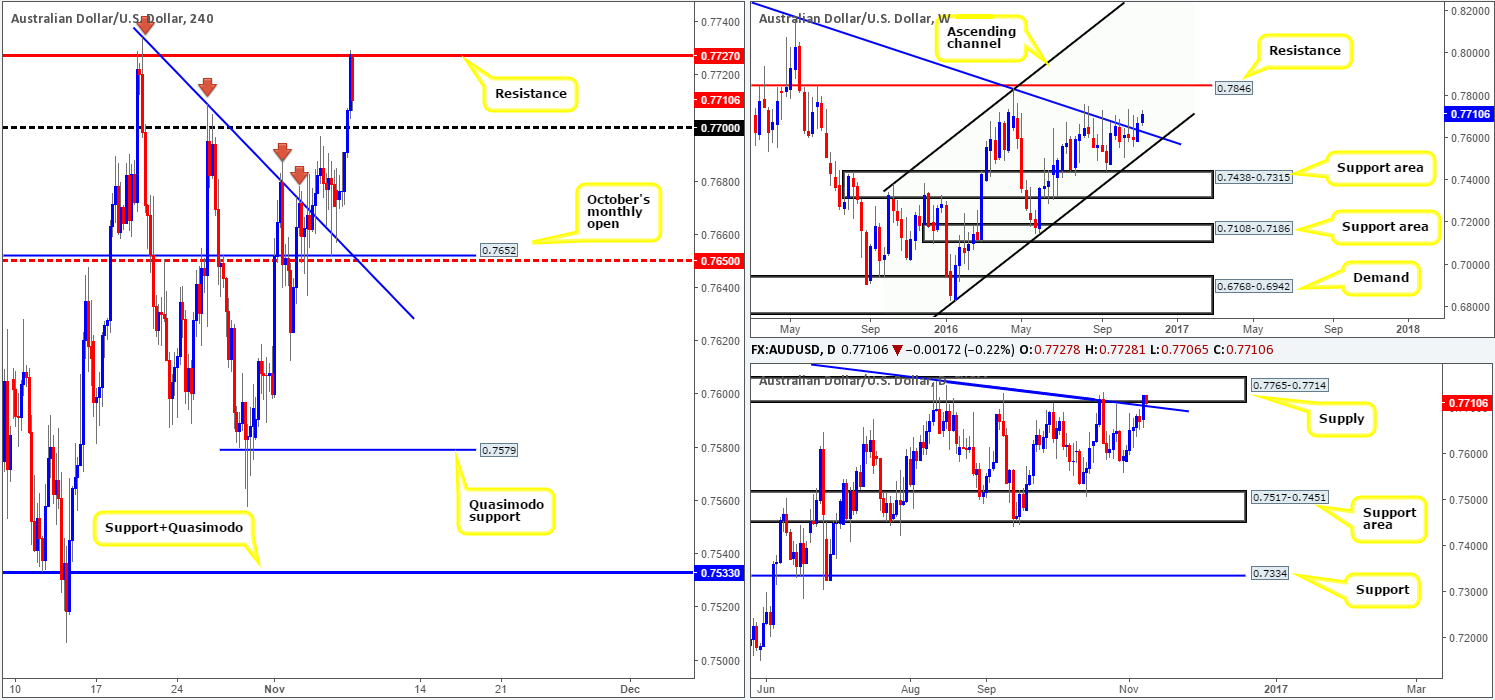
AUD/USD:
Improved market sentiment saw the commodity currency turn higher going into the early hours of yesterday’s US segment. The move, as you can see, swallowed the 0.77 handle and ended the day touching gloves with a H4 resistance coming in at 0.7727. In that price has responded bearishly to this barrier in recent hours, let’s see how the land lies on the higher-timeframe picture.
Weekly action, as we already highlighted in Monday’s report, changed course last week and closed above a trendline resistance taken from the high 0.8295 (now acting support), potentially opening the gates for a challenge of the resistance level chalked up at 0.7846. Although the weekly chart portends further buying may be on the cards this week, along with yesterday’s daily close above the daily trendline resistance drawn from the high 0.7835, we still have to take into account that upside remains capped by a daily supply zone formed at 0.7765-0.7714.
Our suggestions: With the H4 candles on course to retest the 0.77 handle today, we feel this line will hold as support given its connection with the recently broken daily trendline, now an acting support. Still, we would not advise placing a pending order here as let’s not forget that daily supply mentioned above at 0.7765-0.7714 remains in play. The best, and in our opinion, most logical way to approach the 0.77 number, would be to wait for the buyers to show intent here. What we mean by this is either a reasonably sized H4 bullish close, or a lower timeframe buy signal (M15-H1 is where we generally watch for lower timeframe entries). Either a close above supply followed by a retest as demand, a trendline break/retest or simply a collection of well-defined buying tails around the 0.77 line would be acceptable. Stops are usually placed 5-10 pips beyond confirming structures.
Data points to consider: The main highlight today is the US elections. The event will highly likely stimulate market volatility, so any trades taken should be monitored closely!
Levels to watch/live orders:
- Buys: 0.77 region ([lower timeframe confirmation required prior to entry] stop loss: dependent on where one confirms this area).
- Sells: Flat (stop loss: N/A).
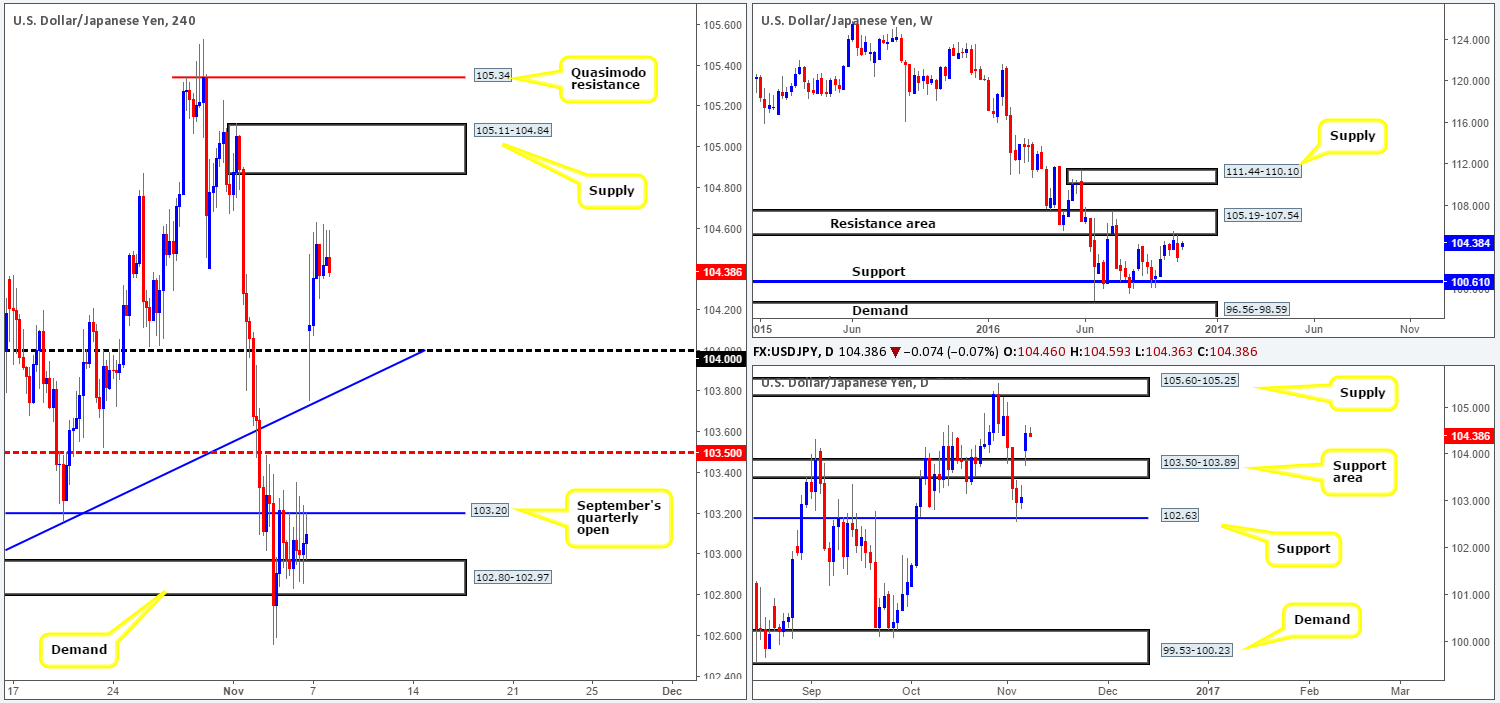
USD/JPY:
The recent statement regarding the FBI ending its investigation into Hilary Clinton’s email server bolstered the US dollar yesterday, opening the week with a weighty gap of 100 pips! So far, the gap has yet to be filled as the overall tone of this market remains to the upside above the 104 handle.
Over in the bigger picture, the week’s opening gap saw price end Monday’s session closing above a daily resistance area at 103.50-103.89 (now acting support). This has potentially cleared the runway north for a run at the daily supply coming in at 105.60-105.25, which conveniently sits within the lower edge of a weekly resistance area drawn from 105.19-107.54.
While the majority of the market might be focusing on the H4 supply area taken at 105.11-104.84, due to its strong momentum south, we have our eye on the H4 Quasimodo seen directly above it at 105.34. The reason as to why is simple. The H4 supply has absolutely no connection to the higher-timeframe structures discussed above in bold. The H4 Quasimodo on the other hand, inhabits the lower edges of the above said higher-timeframe areas.
Our suggestions: From a technical standpoint, our desk favors the current H4 Quasimodo resistance level for shorts. We would, given that today is US Election Day, advise caution setting pending orders in the markets. Instead, wait for at least a reasonably sized H4 bearish close to take shape, before looking to risk capital.
Levels to watch/live orders:
- Buys: Flat (stop loss: N/A).
- Sells: 105.34 ([reasonably sized H4 bearish close required prior to entry] stop loss: ideally beyond the trigger candle).
USD/CAD:
In spite of the USD/CAD gapping significantly lower on Sunday due to the weekend’s news regarding Clinton’s email story, the currency pair remains capped between the H4 levels 1.3423/1.3360: a range that’s been in play since 27/10. With this being the case, much of the following report will echo thoughts put forward in Monday’s analysis.
As weekly action remained relatively unchanged going into last week’s closing point, and daily resistance at 1.3414 is still active (along with its converging AB=CD completion point around the 1.3384ish range and a channel resistance taken from the high 1.3241), we still, from a technical standpoint, believe a close below the current H4 range is more probable.
Our suggestions: Ideally, a close beyond the current H4 consolidation would be fantastic, as not only would this likely confirm downside strength from the above said higher-timeframe structures, it would also set the stage for a possible downside move towards the 1.33 handle, since there’s little active demand seen to the left of current price.
Data points to consider: The main highlight today is the US elections which is likely to cause a stir in this market, so remain vigilant!

Levels to watch/live orders:
- Buys: Flat (stop loss: N/A).
- Sells: Watch for a close below the H4 lows 1.3360 and then look to trade any retest seen thereafter (H4 bearish close following the retest is required prior to entry – stop loss: ideally beyond the trigger candle).
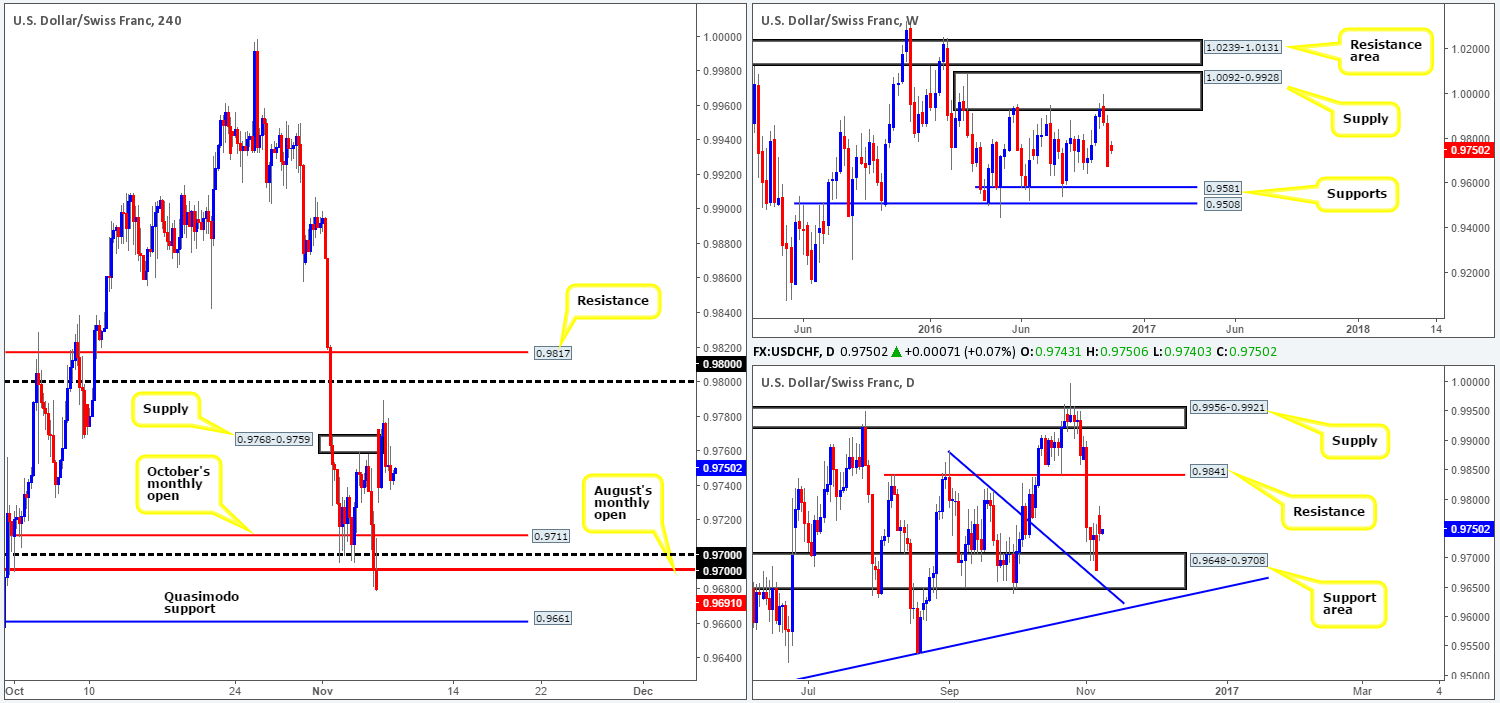
USD/CHF:
Sunday’s tumultuous weekly opening of around 100 pips saw price action score a daily high of 0.9789 going into the London open. Leaving the psychological handle 0.98 unchallenged as well as likely clearing out sellers from the minor H4 supply area at 0.9768-0.9759, price sold off clocking a low of 0.9737 by the day’s end. In view of this recent movement, the H4 candles appear unrestricted in both directions. The 0.98 handle and nearby H4 resistance at 0.9817 is our next expected upside target, while to the downside we’re eyeing October’s monthly open level at 0.9711, followed closely by the 0.97 handle and August’s monthly open level at 0.9691 (both housed within the daily support area seen at 0.9648-0.9708).
Our suggestions: On account of the above points, as well as weekly action seen loitering mid-range between supply at 1.0092-0.9928 and support drawn from 0.9581, the best we feel we can do here is keep tabs on both the 0.98 region for shorts and the 0.97 barrier for longs. Of course, 0.97 is slightly more favored by our team due to its relationship with the aforementioned daily support area.
Data points to consider: The main event today is the US elections. Early vote counts will highly likely stimulate market volatility, so any trades taken should be closely monitored!
Levels to watch/live orders:
- Buys: 0.97 region ([reasonably sized H4 bullish close required prior to entry] stop loss: ideally beyond the trigger candle).
- Sells: 0.98 region ([reasonably sized H4 bearish close required prior to entry] stop loss: ideally beyond the trigger candle).
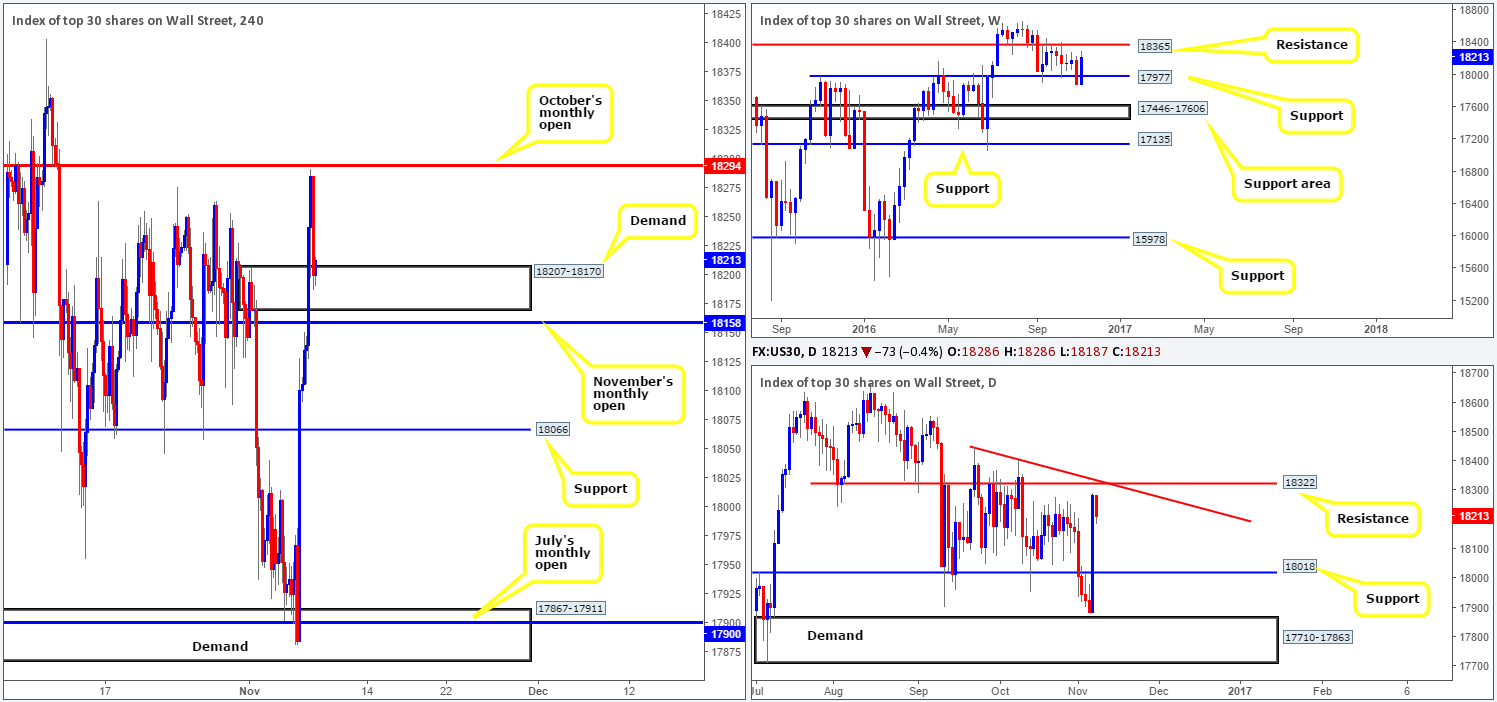
DOW 30:
Equities received a boost yesterday, as Clinton was cleared by the FBI into her alleged use of an unauthorized email server. The 400-point rally completely erased all of last week’s losses, breaking through several key technical resistances along the way. As is evident from the H4 chart, the unit topped out just ahead of October’s monthly open level at 18294, and is now seen retesting a recently broken H4 supply at 18207-18170 as demand.
This begs the question, is the current H4 demand base a suitable area in which to look to trade long from today? It’s a difficult read, we have to be honest. Technically speaking, however, we do not favor a buy from here on account of the following points:
- November’s monthly open level at 18158 lurks just below, suggesting a fakeout may be on the cards.
- Daily price topped out just ahead of a daily resistance seen at 18322, which happens to converge with a daily trendline resistance extended from the high 18450.
- And finally, it’s Election Day! Early vote counts will very likely cause unexpected moves in this market today, and is, in our humble opinion, not ideal trading conditions for technical setups.
Our suggestions: Our desk has opted for the safe route today by remaining on the sidelines.
Levels to watch/live orders:
- Buys: Flat (stop loss: N/A).
- Sells: Flat (stop loss: N/A).
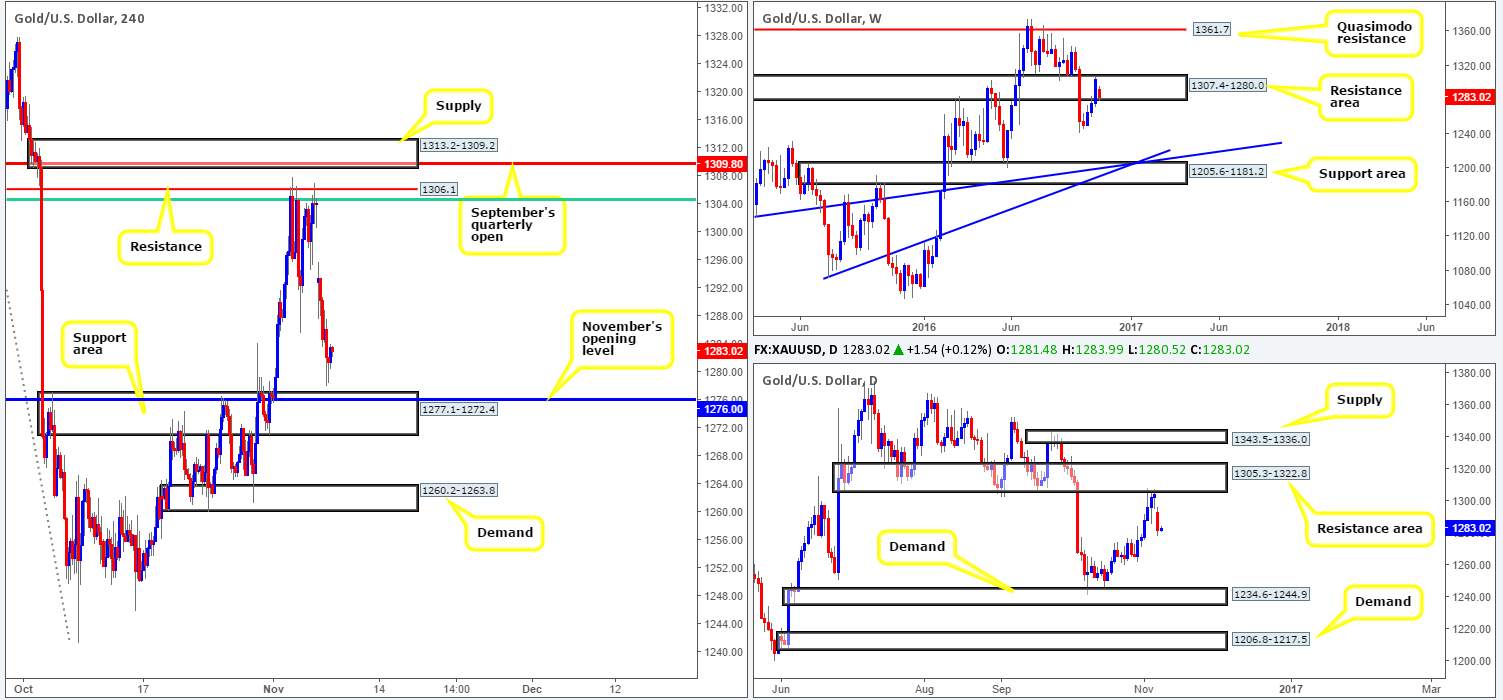
GOLD:
The yellow metal opened aggressively lower on Sunday, erasing over $11 in one fell swoop. This came after the FBI cleared Hillary Clinton over the alleged use of an unauthorized email server. In addition to this rather abrupt beginning, bullion maintained bearish sentiment going into Monday’s session as a wave of risk-on buying was seen across riskier asset classes such as the DOW, and the Aussie dollar.
At the time of writing, the H4 candles are attempting to put in a bottom just ahead of a H4 support area at 1277.1-1272.4 that houses November’s opening level 1276.0. Despite this confluence, a trade long from here is tricky due to weekly price currently occupying a resistance area drawn from 1307.4-1280.0, which effectively could push the daily candles back down to demand seen at 1234.6-1244.9.
Our suggestions: In light of how sensitive this market is likely to be today given the US Election Day, we really feel placing this market on the back burner would be the safer bet.
Levels to watch/live orders:
- Buys: Flat (stop loss: N/A).
- Sells: Flat (stop loss: N/A).


