Waiting for lower timeframe confirmation is our main tool to confirm strength within higher timeframe zones, and has really been the key to our trading success. It takes a little time to understand the subtle nuances, however, as each trade is never the same, but once you master the rhythm so to speak, you will be saved from countless unnecessary losing trades. The following is a list of what we look for:
- A break/retest of supply or demand dependent on which way you’re trading.
- A trendline break/retest.
- Buying/selling tails/wicks – essentially we look for a cluster of very obvious spikes off of lower timeframe support and resistance levels within the higher timeframe zone.
- Candlestick patterns. We tend to stick with pin bars and engulfing bars as these have proven to be the most effective.
We typically search for lower-timeframe confirmation between the M15 and H1 timeframes, since most of our higher-timeframe areas begin with the H4. Stops are usually placed 1-3 pips beyond confirming structures.
EUR/USD:
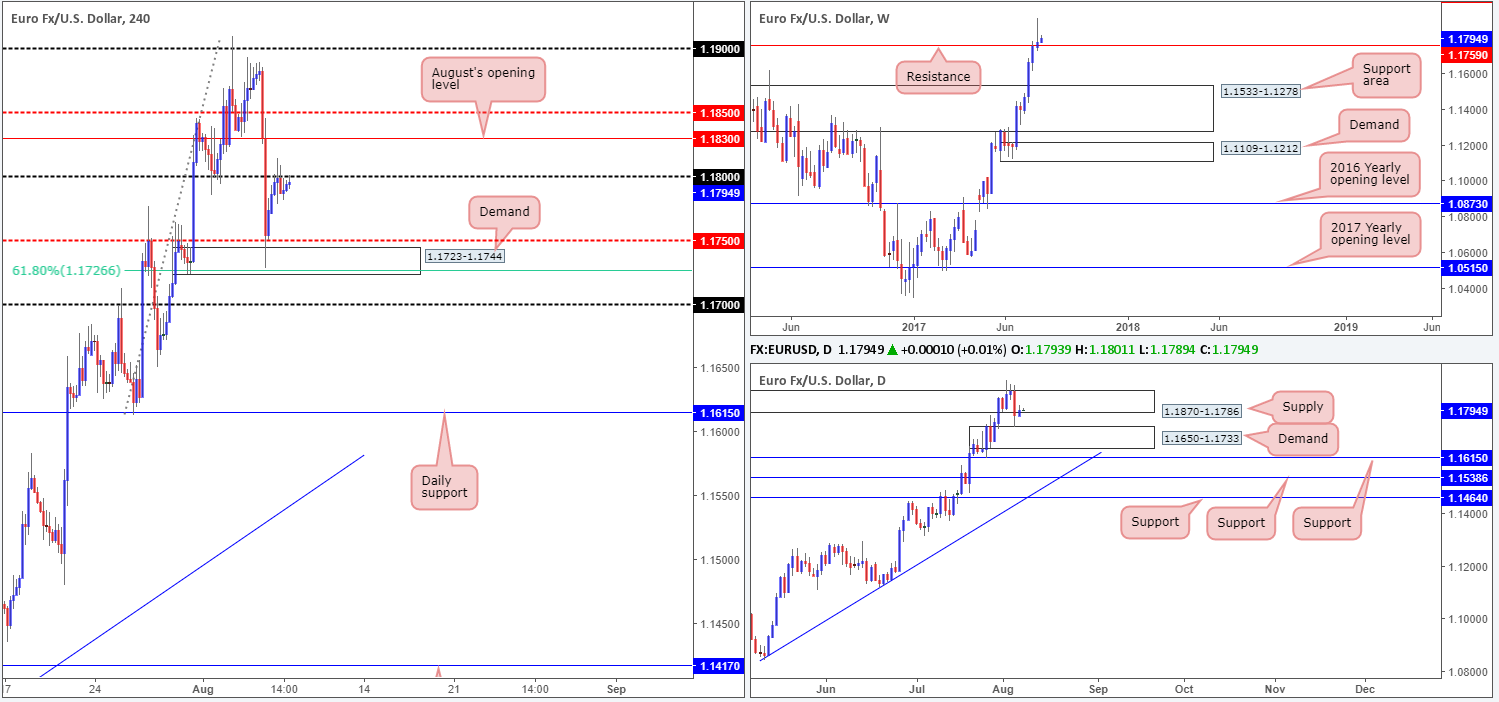
Recent action shows that the EUR/USD extended Monday’s bounce from the H4 demand at 1.1723-1.1744 up to the 1.18 psychological band. As you can see, the bulls failed to sustain gains beyond this number, despite an earnest attempt seen going into the London open. Should the buyers succeed in bidding price higher today, they’ll be faced with August’s opening level marked at 1.1830, shadowed closely by the H4 mid-level number 1.1850.
Over on the weekly timeframe, we’ve yet to see any noteworthy response to last week’s eye-catching selling wick that printed just above a resistance level coming in at 1.1759. The latest seen from the daily timeframe, however, reveals that price is now shaking hands with supply at 1.1870-1.1786, after bouncing from demand printed at 1.1650-1.1733.
Our suggestions: Given the lack of bearish intent seen so far at 1.18, as well as the noted daily supply suffering multiple upside breaks last week and weekly price trading above resistance, our desk feels it is not really a sellers’ market right now, despite the weekly selling wick in view.
Regrettably, buying is also challenging at this time. Though we believe that 1.18 and the daily supply are fragile, it would be unwise for us to buy based on this theory. Waiting for the daily supply to be consumed before becoming a buyer is, in our opinion, the better path to take.
Data points to consider: No high-impacting news events scheduled on the docket today.
Levels to watch/live orders:
- Buys: Flat (stop loss: N/A).
- Sells: Flat (stop loss: N/A).
GBP/USD:
The latest coming out of the GBP/USD market shows H4 price to be crossing swords with an interesting buy zone marked in green at 1.30/1.3019. As we noted in Monday’s report, this area is comprised of July’s opening level at 1.3003, the large psychological boundary at 1.30, an AB=CD (black arrows) 161.8% Fib ext. at 1.3019, a 78.6% Fib retracement at 1.3004 which, collectively, is encased within a daily support area seen at 1.3058-1.2979.
Unfortunately, upon connecting with the said H4 buy zone, a H4 indecision candle printed forcing us to pass on the trade. As we explained yesterday, we were ideally looking for a full, or near-full bullish rotation candle before pulling the trigger.
Our suggestions: Technically speaking, the H4 candles will likely head for the nearby mid-level resistance at 1.3050 today. Thereafter, it will be difficult to judge direction since let’s not forget that weekly price is currently trading from supply at 1.3120-1.2957.
Therefore, for those of you who ought the noted H4 buy zone, 1.3050 should be a level of interest. A break above could signal further buying up to 1.31, whereas a rejection could lead to H4 price challenging the 1.30 neighborhood and perhaps lower.
Data points to consider: No high-impacting news events scheduled on the docket today.

Levels to watch/live orders:
- Buys: Longs above 1.3050 are attractive.
- Sells: Flat (stop loss: N/A).
AUD/USD:
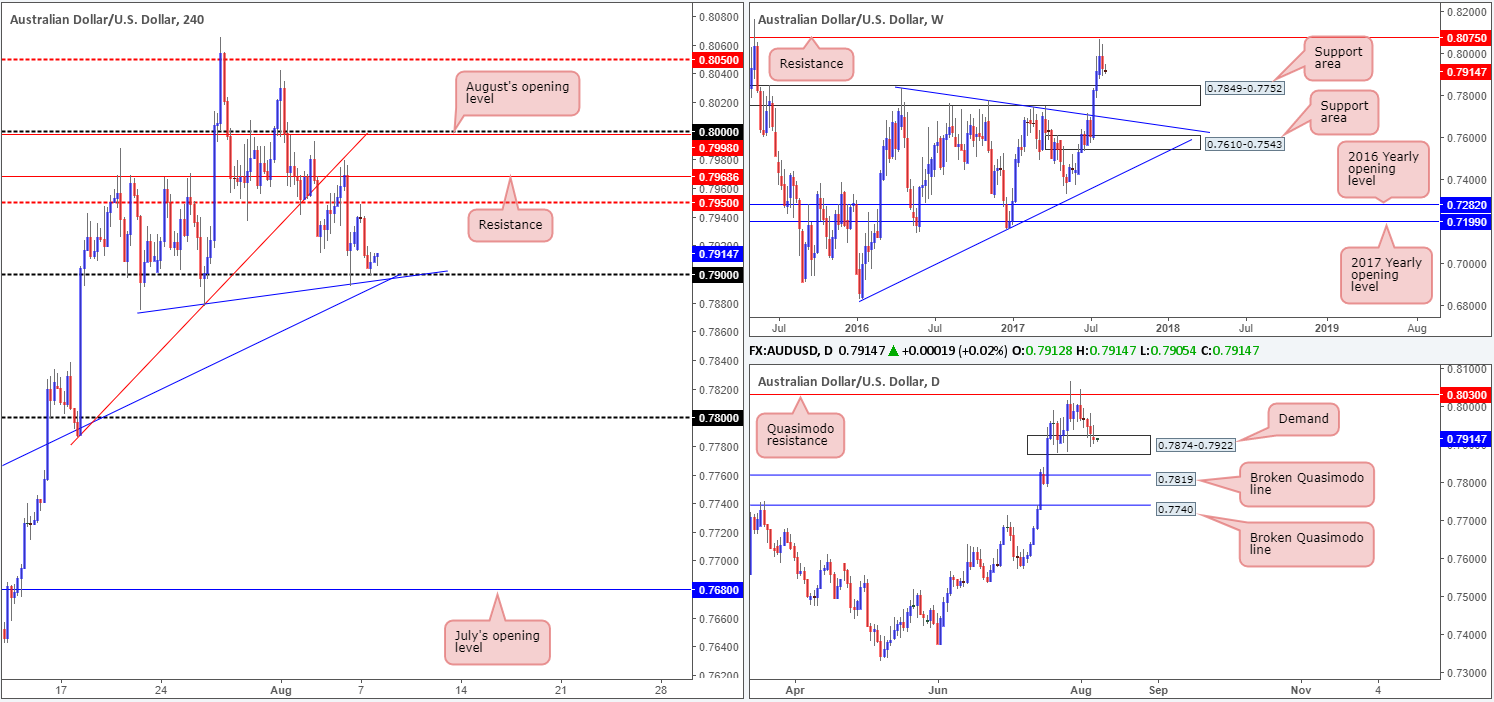
Kicking this morning’s report off with a look at the weekly timeframe, we can see that since price came within a cat’s whisker of connecting with resistance at 0.8075, the bears have made a notable stand. By the looks of things, further selling could be seen down to a support area coming in at 0.7849-0.7752. While this may be the case, down on the daily timeframe there is a slightly different picture being painted, as the unit is currently seen testing a demand base coming in at 0.7874-0.7922.Although there’s been little bullish intent registered from here as of yet, we cannot rule out the possibility of an upside move being seen back up to the Quasimodo resistance level planted at 0.8030.
A closer look at price action on the H4 chart shines the spotlight on the 0.79 handle once again. This level has managed to withstand several bearish attacks, and now currently fuses with two trendline supports (0.7874/0.7635).
Our suggestions: A long at current price remains precarious. While this may seem bizarre given that there’s a daily demand present and a reasonably attractive psychological support on the H4 timeframe, we have to keep in mind that weekly price is threatening to punch lower as well as a lack of enthusiasm being seen from the buyers on the daily timeframe at the moment. As a result, we’ve decided to remain flat for the time being.
Data points to consider: RBA Assist Gov. Kent speaks at 11.35pm GMT+1. Chinese trade balance – tentative schedule.
Levels to watch/live orders:
- Buys: Flat (stop loss: N/A).
- Sells: Flat (stop loss: N/A).
USD/JPY:
During the course of Monday’s sessions, the H4 candles spent the majority of the day clinging to the underside of June’s opening level at 110.83. As such, much of the following report will echo similar thoughts put forward in yesterday’s analysis…
Since weekly price shook hands with supply at 115.50-113.85 five weeks ago, the market has been trading in the red. From our perspective, it looks as though price will continue to press lower until we reach a small demand base seen at 108.13-108.95. In conjunction with the weekly timeframe, the daily candles are currently seen kissing resistance penciled in at 110.76. This level, as you can see, has a strong history and therefore could hold the unit lower and clear the pathway south down to a Quasimodo support at 109.11 (converges closely with a trendline support taken from the low 108.13).
While June’s opening level has managed to hold price action lower, the 111 handle seen directly above which houses a nice-looking H4 Fibonacci resistance cluster (50.0%/61.8%/78.6%) taken from the highs 112.19/111.71/111.28, is interesting.
Our suggestions: Put simply, we’re looking for H4 price to tap 111 today and close back below June’s opening level to short. The first take-profit target can be seen at the H4 mid-level support drawn from 110.50, which dependent on the size of the rejection candle from 111 (stops to be positioned above this candle), should give at least one times the risk down to 110.50, allowing you to move stops to breakeven and take partial profits.
Data points to consider: No high-impacting news events scheduled on the docket today.

Levels to watch/live orders:
- Buys: Flat (stop loss: N/A).
- Sells: 111 region ([wait for price to tap 111 and print a H4 close back below 110.83 before considering a short] stop loss: ideally beyond the candle’s wick).
USD/CAD:
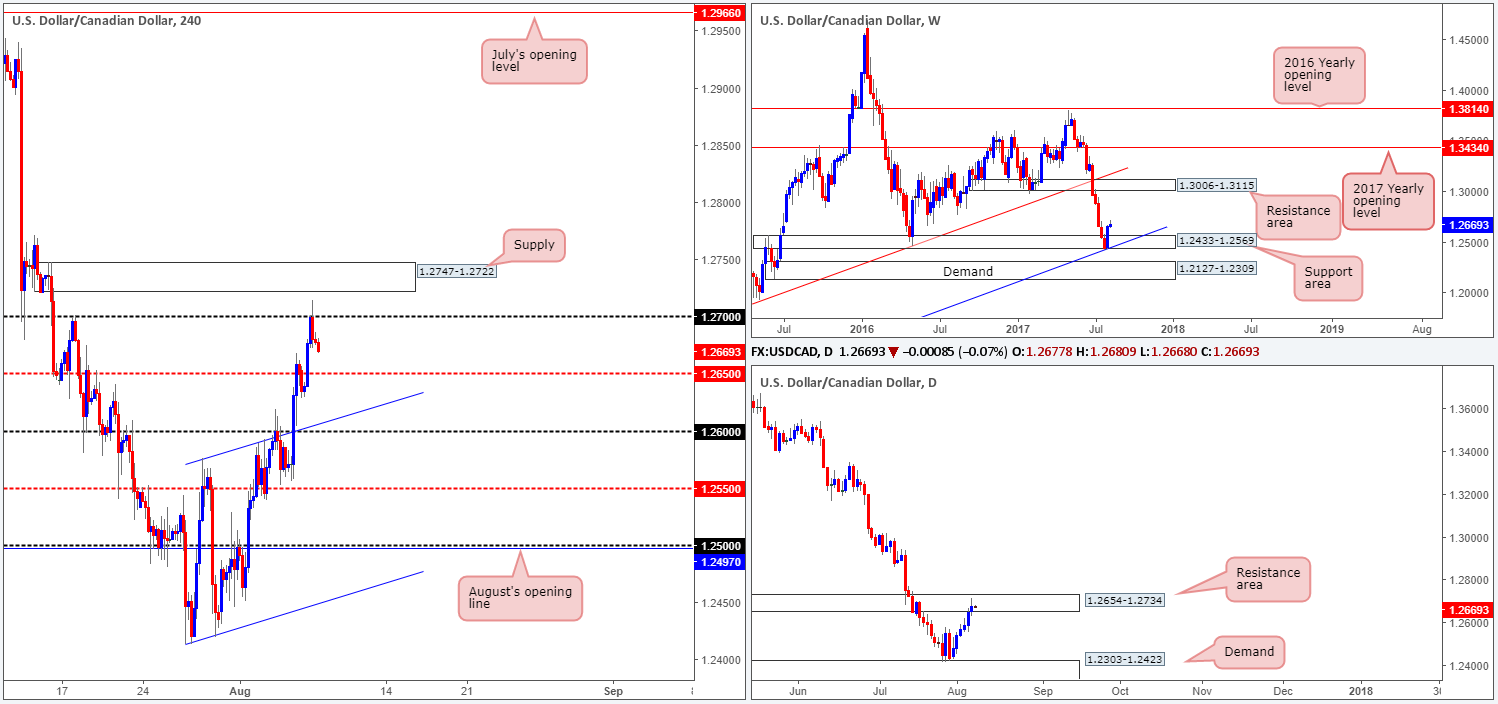
Undeterred by the fact that daily price is currently trading from a resistance area seen at 1.2654-1.2734, the USD/CAD pushed higher on Monday, registering its sixth consecutive bullish candle! The strength behind this move, at least from a technical standpoint, is largely due to weekly price recently staging a stronger-than-expected bounce from the support area seen at 1.2433-1.2569.
The 1.27 handle seen drawn on the H4 timeframe suffered a minor breach going into yesterday’s US open, missing the nearby H4 supply at 1.2747-1.2722 by only a few pips. As you can see, however, 1.27 managed to hold ground and remain intact going into the closing bell.
Our suggestions: To become buyers in this market, we would still prefer to see a clear break (close) above the current daily resistance area. Despite what the weekly timeframe suggests, buying into daily structure is a risk we’re just not willing to take here.
Along similar lines, selling at current price is also not recommended. Not only do we have the nearby H4 mid-level support at 1.2650 to contend with, but we also have to compete with potential weekly buyers.
Technical elements are just too mixed at the moment, thus leaving us with little choice but to remain flat for now.
Data points to consider: No high-impacting news events scheduled on the docket today.
Levels to watch/live orders:
- Buys: Flat (stop loss: N/A).
- Sells: Flat (stop loss: N/A).
USD/CHF:
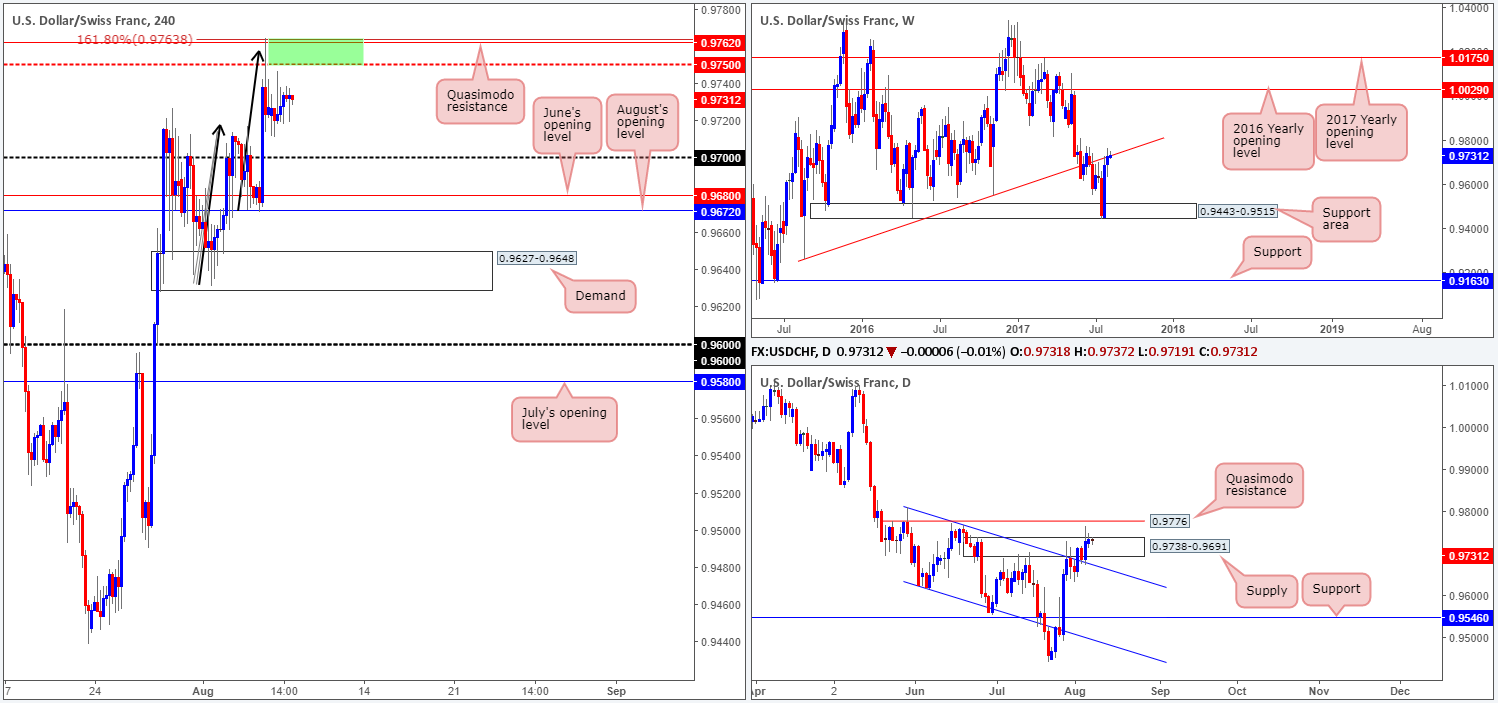
USD/CHF prices are little changed this morning. The H4 candles spent the majority of Monday’s segment consolidating inside a 35-pip range between the mid-level resistance at 0.9750 and the 0.97 handle. As we mentioned in yesterday’s report, the after-effects of Friday’s upbeat US job’s report brought the pair to highs of 0.9763. Traders may have also noticed that the move connected with a H4 Quasimodo resistance level at 0.9762 and also a H4 AB=CD (black arrows) 161.8% Fib ext. at 0.9763.
The 0.9763/0.9750 region marked in green remains an area of interest to our desk for potential shorts this morning. This is largely due to the major weekly trendline resistance extended from the low 0.9257 seen in play at the moment. Our only concern is Friday’s move above (whipsaw) daily supply at 0.9738-0.9691, which could lead to further buying up to a nearby daily Quasimodo resistance at 0.9776.
Our suggestions: The weekly trendline resistance, coupled with the noted H4 resistances in play, may force the US dollar to retest the 0.97 handle, and quite possibly June/August’s opening levels at 0.9680/0.9672. We would be comfortable shorting this market if the unit retests the 0.9763/0.9750 region. Still, to be on the safe side, waiting for a H4 bearish candle to form from this area, preferably in the shape of a full, or near-full-bodied candle, is advised before pulling the trigger, since let’s keep in mind that the daily Quasimodo resistance is positioned only 14 pips above the H4 sell green sell zone, hence a fakeout is possible.
Data points to consider: No high-impacting news events scheduled on the docket today.
Levels to watch/live orders:
- Buys: Flat (stop loss: N/A).
- Sells: 0.9763/0.9750 ([waiting for a H4 bearish candle to form, preferably either a full, or near-full-bodied candle, is advised] stop loss: ideally beyond the candle’s wick).
DOW 30:
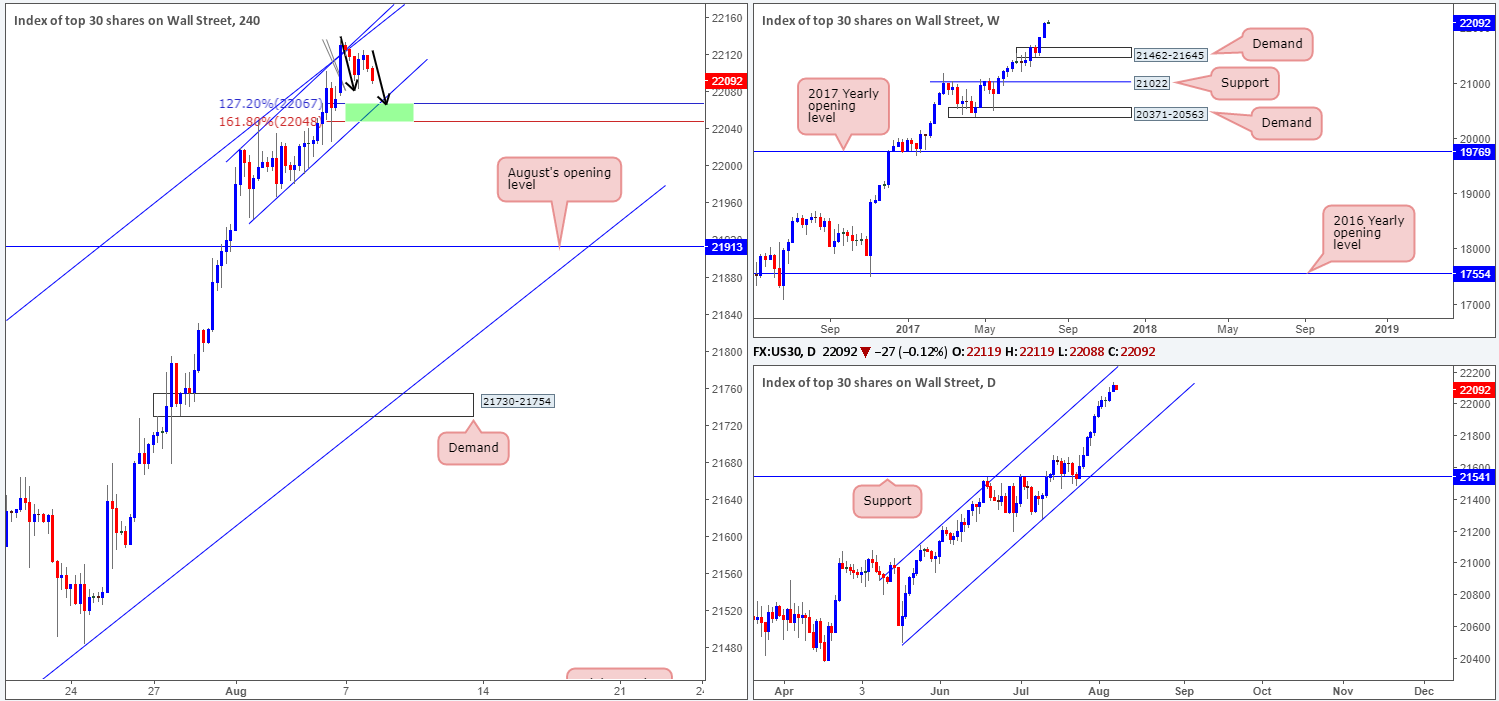
Of late, we’ve seen the US equity market ease off from two H4 converging ascending channel resistances. As highlighted in Monday’s report, the first, the bigger of the two channels, can be extended from low/high 21273/21556. The second, the smaller version, can be drawn from low/high 21942/22019.
So, despite the index printing ten consecutive bull candles over the last two weeks, we may see the unit challenge the smaller neighboring channel support line today, which happens to converge with the potential AB=CD (black arrows) 127.2/161.8% Fib extensions marked in green at 22048/22067.
Our suggestions: With this market currently entrenched within an incredibly strong uptrend which shows little sign of decelerating, a buy from 22048/22067 is of interest to our desk this morning.
To avoid any fakeout through the buy zone, however, we would strongly recommend waiting for H4 price to chalk up a bullish candle in the shape of a full, or near-full-bodied candle. This, of course, will not guarantee a winning trade, but what it will do is show buyer intent from a high-probability buy zone.
Data points to consider: No high-impacting news events scheduled on the docket today.
Levels to watch/live orders:
- Buys: 22048/22067 ([waiting for a H4 bullish candle to form, preferably either a full, or near-full-bodied candle, is advised] stop loss: ideally beyond the candle’s tail).
- Sells: Flat (stop loss: N/A).
GOLD:
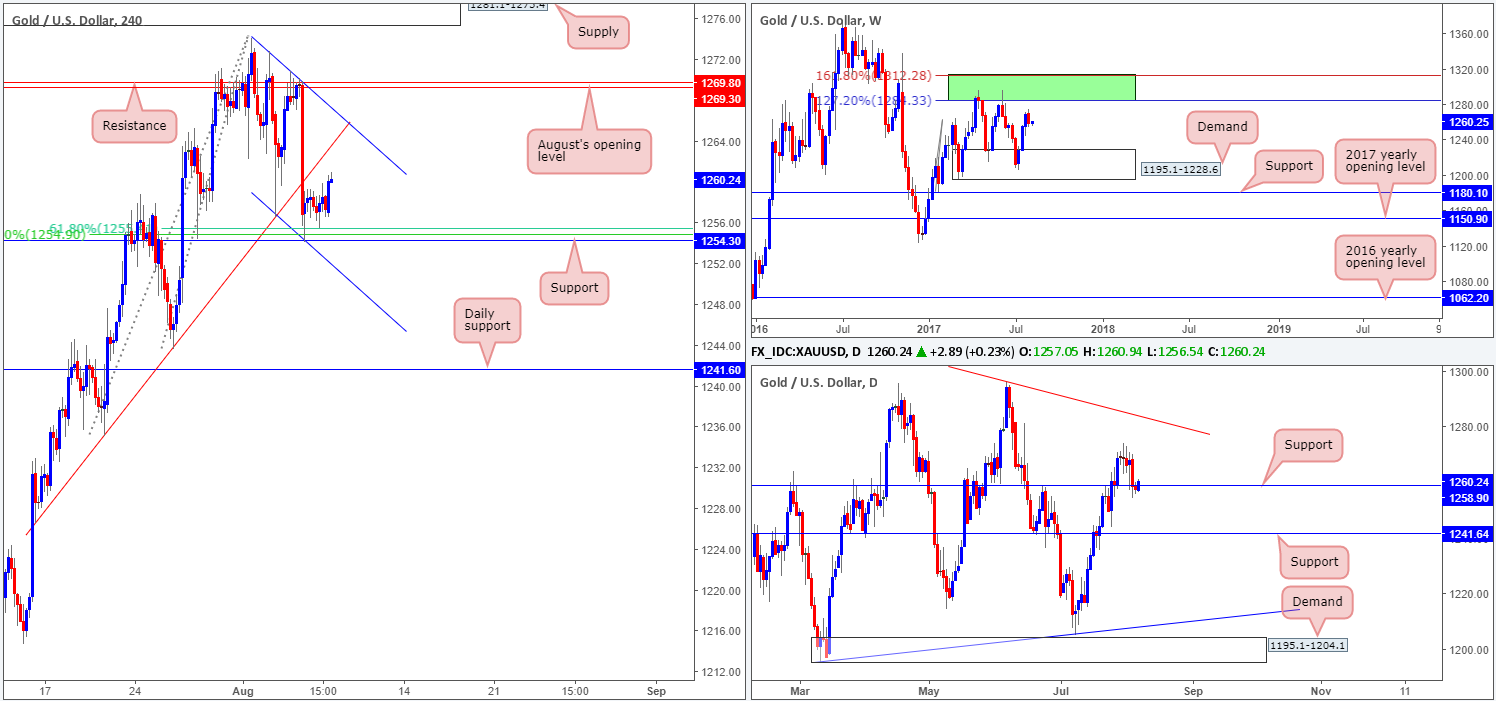
The gold market was a relatively dull place to be on Monday. H4 price managed to remain afloat above the support level marked at 1254.3, which unties with a 61.8% Fib support at 1255.3 drawn from the low 1243.6, a 50.0% support value at 1254.9 extended from the low 1235.1 and a channel support taken from the low 1256.5. In recent hours the metal has extended north and now looks poised to challenge the neighboring channel resistance brought down from the high 1274.1.
A look at the daily chart shows price to be interacting with support at 1258.9. This – coupled with weekly price showing room for the metal to extend up to the green weekly resistance zone comprised of two Fibonacci extensions 161.8/127.2% at 1312.2/1284.3 taken from the low 1188.1, we believe the bulls will highly likely reach the aforementioned H4 channel resistance today.
Our suggestions: Unless a retest at the noted H4 support is seen, it is quite a difficult pair to buy at current price. Therefore, this is what we’re ultimately looking for in this market today.
Levels to watch/live orders:
- Buys: 1254.3 region ([waiting for a H4 bullish candle to form, preferably either a full, or near-full-bodied candle, is advised] stop loss: ideally beyond the candle’s tail).
- Sells: Flat (stop loss: N/A).