Waiting for lower timeframe confirmation is our main tool to confirm strength within higher timeframe zones, and has really been the key to our trading success. It takes a little time to understand the subtle nuances, however, as each trade is never the same, but once you master the rhythm so to speak, you will be saved from countless unnecessary losing trades. The following is a list of what we look for:
- A break/retest of supply or demand dependent on which way you’re trading.
- A trendline break/retest.
- Buying/selling tails/wicks – essentially we look for a cluster of very obvious spikes off of lower timeframe support and resistance levels within the higher timeframe zone.
We typically search for lower-timeframe confirmation between the M15 and H1 timeframes, since most of our higher-timeframe areas begin with the H4. Stops are usually placed 1-3 pips beyond confirming structures.
EUR/USD:
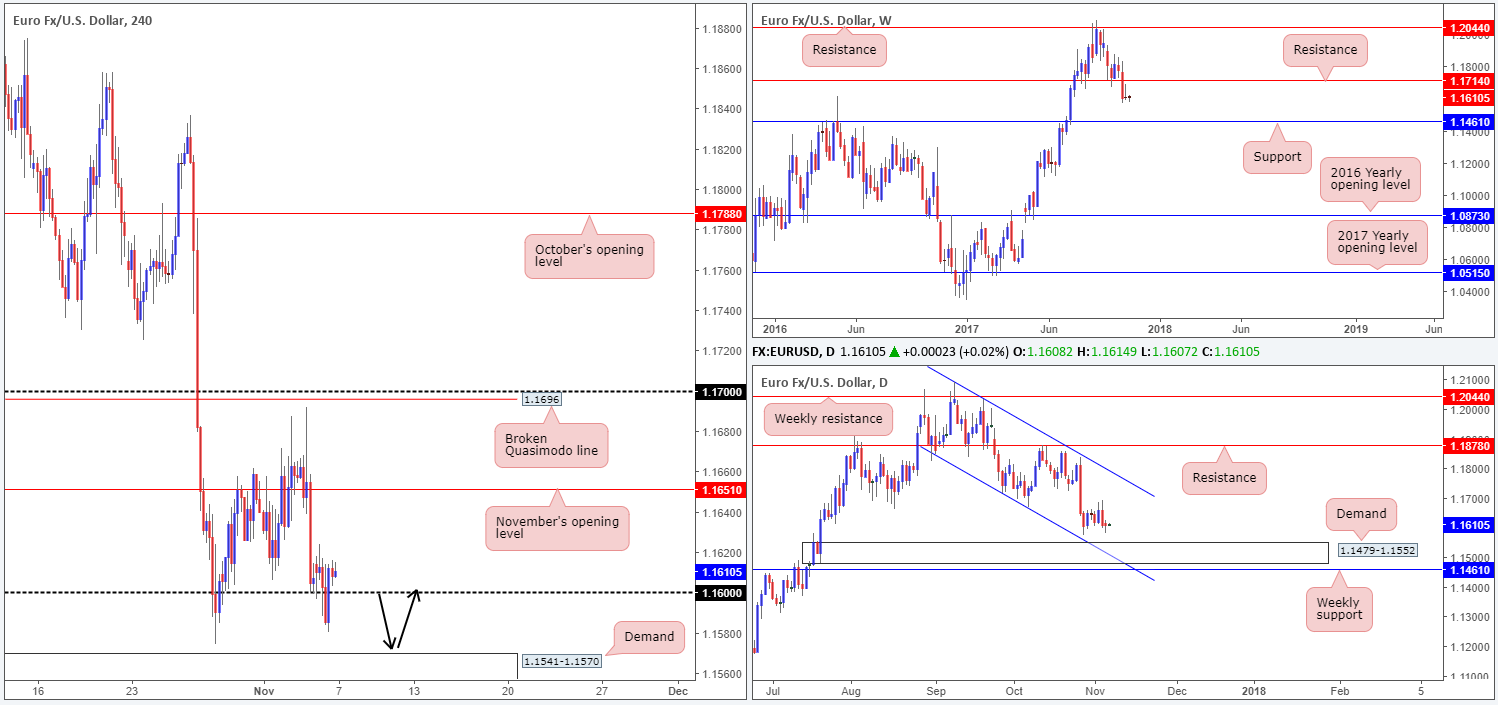
Despite the H4 candles seen whipsawing through the 1.16 handle on Monday, the EUR/USD is effectively unchanged this morning. Considering this, much of the following report will echo similar thoughts put forward during yesterday’s analysis.
Now that weekly support at 1.1714 has been consumed (now acting resistance), weekly price, as far as we can see, shows room to punch as far south as the weekly support level coming in at 1.1416: a barrier that boasts an exceedingly robust history. Turning our attention to the daily candles, price remains basing just ahead of a strong-looking demand area at 1.1479-1.1552, which happens to unite with a channel support etched from the low 1.1717 and is also sited just above the aforementioned weekly support.
Suggestions: Although H4 price is seen trading back above 1.16 this morning, we still feel that further buying from here is unlikely given where price is located on the bigger picture. Does that mean a sell on the break of 1.16 is what we should be looking at? Not necessarily. Beneath 1.16 sits a H4 demand at 1.1541-1.1570 that is positioned around the top edge of the noted daily demand.
Our idea going into today’s segment, therefore, is to watch for price to tackle the aforesaid H4 demand base. This area is, in our humble view, good enough for an intraday move back up to at least 1.16. However, should you take this trade, do remain aware that the risk/reward from the H4 demand to 1.16 is around 1R (that is assuming you place stops below the current H4 demand).
Data points to consider: ECB President Draghi speech at 9am; FOMC member Quarles speaks at 5.35pm; Fed Chair Yellen speaks at 7.30pm GMT.
Levels to watch/live orders:
- Buys: around H4 demand at 1.1541-1.1570 (stop loss: 1.1540).
- Sells: Flat (stop loss: N/A).
GBP/USD:
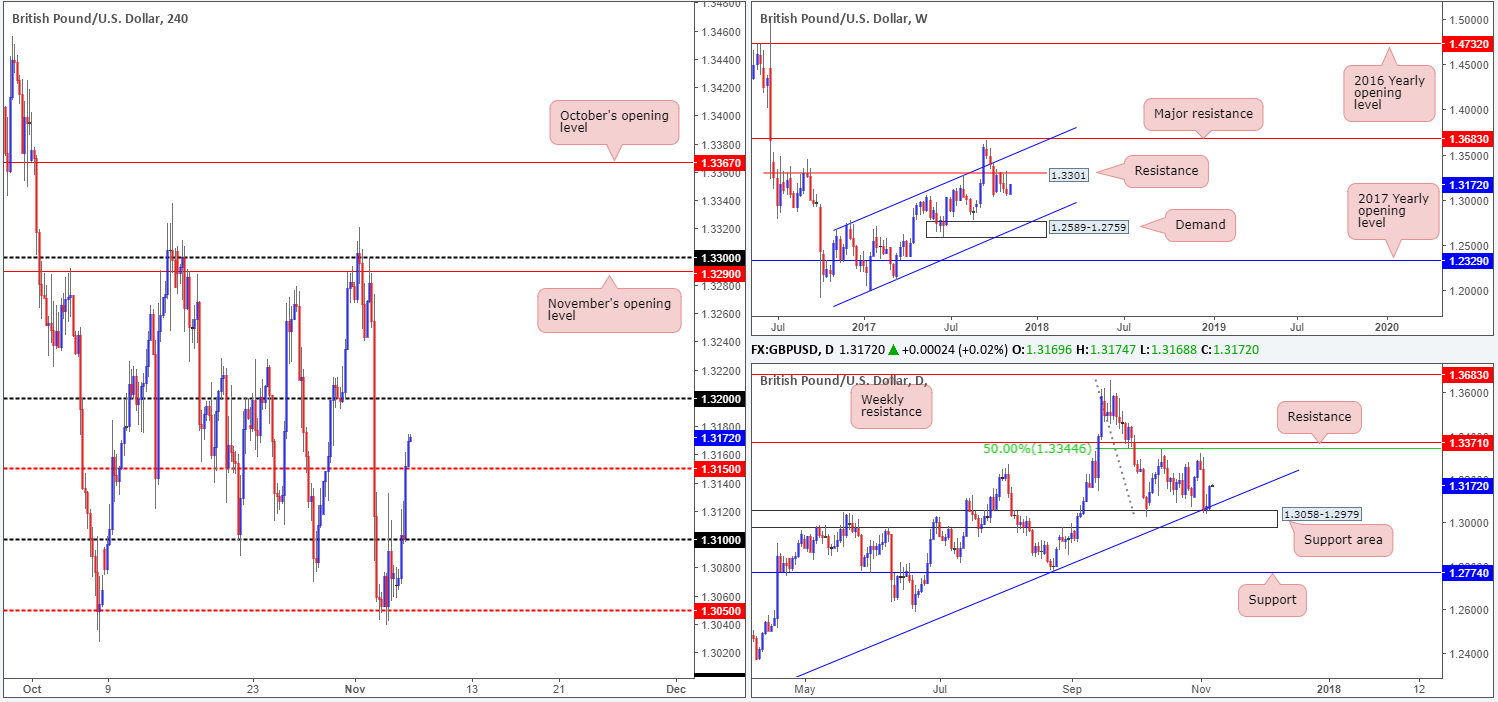
GBP bulls went on the offensive during Monday’s segment, crunching through the 1.31 handle and eventually the H4 mid-level resistance 1.3150. Despite the lack of fundamental drivers behind this recent upside move, the daily support area at 1.3058-1.2979 (fuses nicely with a trendline support etched from the low 1.2108) clearly provided the market with a much-needed floor. However, this move does come at a time when weekly price is showing bearish intent beneath weekly resistance plotted at 1.3301.
Suggestions: While daily price printed a healthy near-full-bodied bullish candle on Monday, upside is somewhat tarnished by the position of price on the weekly timeframe, and is therefore a risky long, in our opinion. In addition to this, we still do not see any technical confluence to pull the trigger on the H4 timeframe. As such, remaining on the sidelines might be the better option today.
Data points to consider: FOMC member Quarles speaks at 5.35pm; Fed Chair Yellen speaks at 7.30pm GMT.
Levels to watch/live orders:
- Buys: Flat (stop loss: N/A).
- Sells: Flat (stop loss: N/A).
AUD/USD:
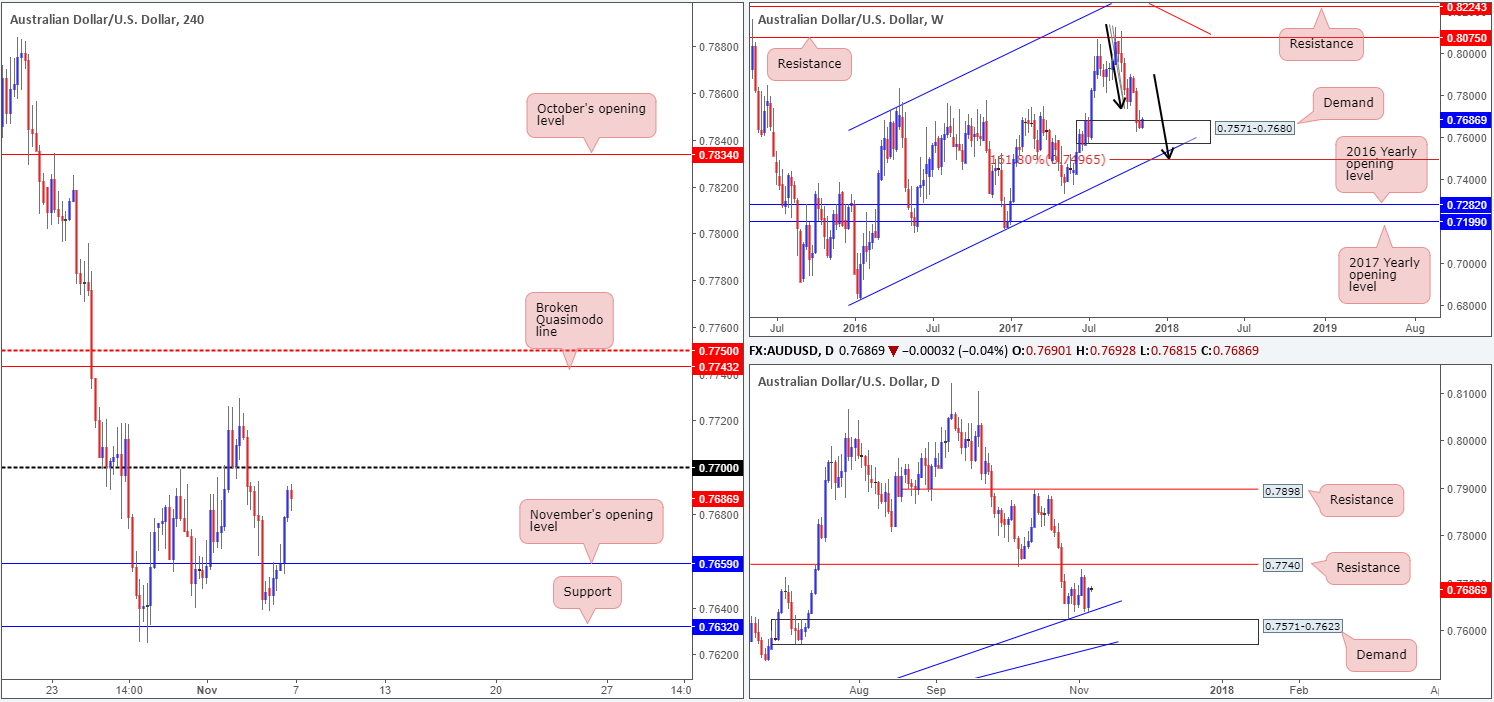
In recent trading, the AUD/USD rallied north and ended Monday’s session within striking distance of the 0.77 handle. The pair’s recent upsurge seems to be a product of broad-based selling pressure witnessed on the greenback.
So, is 0.77 a worthy barrier to consider shorting from today? This would be an incredibly risky sell, in our view. Our reasoning lies within the higher-timeframe structure. Buyers and sellers on the weekly timeframe are seen battling for position within the walls of a demand area coming in at 0.7571-0.7680. In conjunction with the weekly timeframe, there’s a daily demand area plotted at 0.7571-0.7623 (seen housed within the lower limits of the current weekly demand) that converges with a daily trendline support drawn from the low 0.7328.
Suggestions: With higher-timeframe bulls likely to come into the picture, we will be looking for longs ABOVE 0.77 today. A decisive H4 close beyond 0.77, followed up with a retest as support and a lower-timeframe buy signal (see the top of this report) would, in our book, be enough to warrant an intraday long position, targeting the H4 mid-level resistance 0.7750 (do note that daily resistance is plotted just beneath this level at 0.7740, hence why a long above 0.77 is considered intraday).
Data points to consider: RBA rate statement and cash rate decision at 3.30am; FOMC member Quarles speaks at 5.35pm; Fed Chair Yellen speaks at 7.30pm GMT.
Levels to watch/live orders:
- Buys: Watch for H4 price to engulf 0.77 and then look to trade any retest of this level seen thereafter ([waiting for a lower-timeframe buy signal to form following the retest is advised] stop loss: dependent on where one confirms this level).
- Sells: Flat (stop loss: N/A).
USD/JPY:
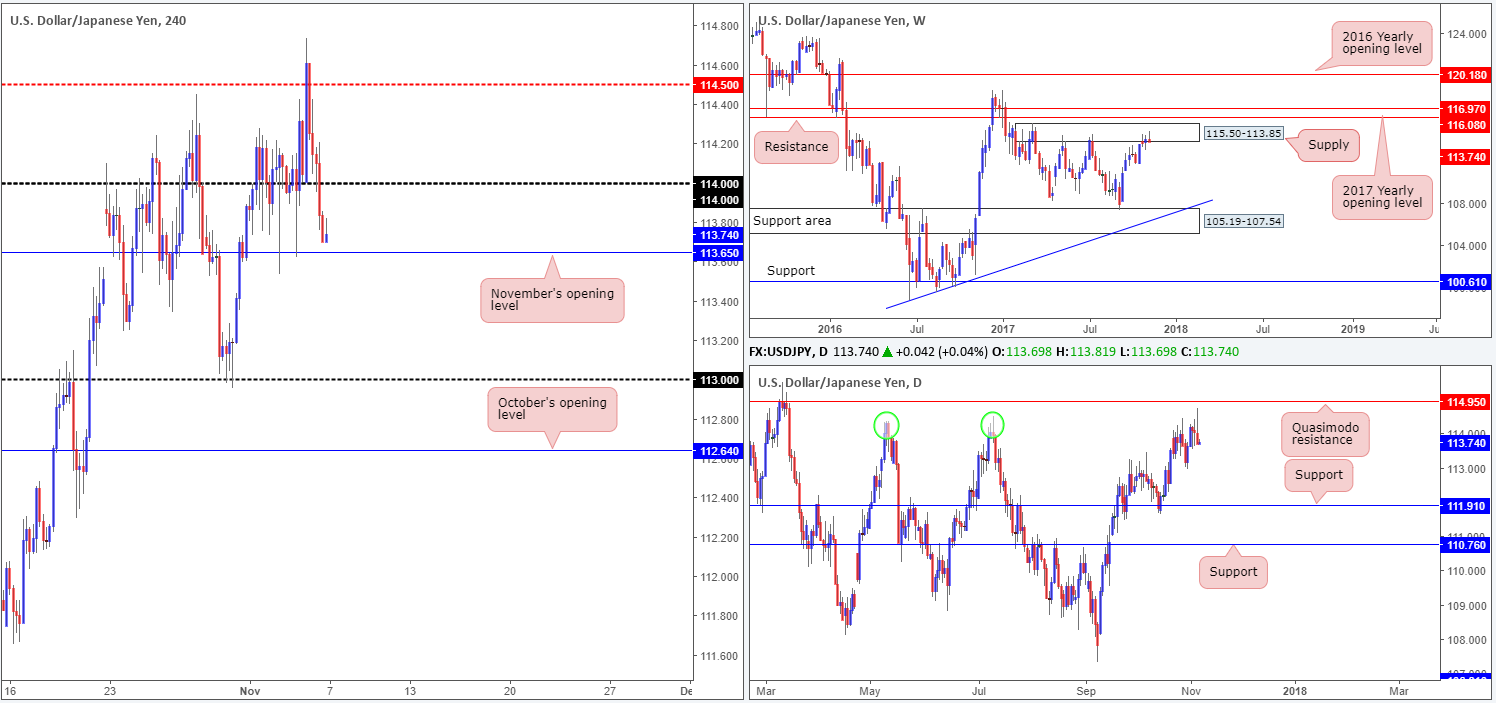
After a somewhat aggressive whipsaw through the H4 mid-level resistance 114.50 amid early trade on Monday, the USD/JPY came under fresh downside pressure. Taking out the 114 handle, the unit was able to conclude the day just ahead of November’s opening level at 113.65.
Technically speaking, this recent move lower should not have come as too much of a surprise. Weekly action is seen lurking around the lower limits of a supply zone penciled in at 115.50-113.85, while daily price was seen within striking distance of a Quasimodo resistance level at 114.95.
Suggestions: In view of the bigger picture, the desk is going to be looking for shorts sub 113.65 today. A decisive H4 close below November’s opening level, alongside a retest and a reasonably sized H4 bearish candle (preferably a full or near-full-bodied candle) would, in our opinion, be enough to warrant a sell, targeting at least the 113 handle.
Data points to consider: FOMC member Quarles speaks at 5.35pm; Fed Chair Yellen speaks at 7.30pm GMT.
Levels to watch/live orders:
- Buys: Flat (stop loss: N/A).
- Sells: Watch for H4 price to engulf 113.65 and then look to trade any retest of this level seen thereafter ([waiting for a H4 bearish candle to form following the retest – preferably a full or near-full-bodied candle – is advised] stop loss: ideally beyond the candle’s wick).
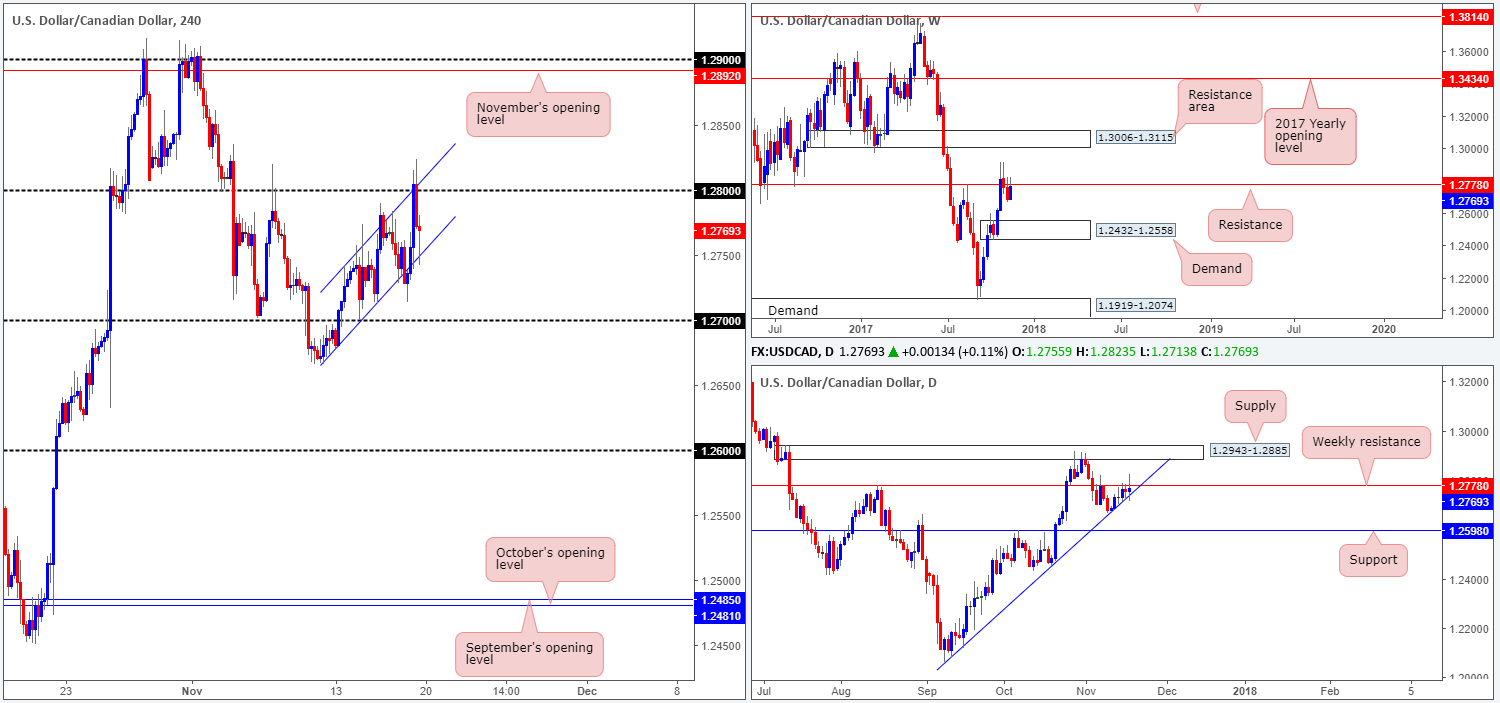
USD/CAD:
Kicking this morning’s report off with a look at the weekly timeframe shows that price is trading beneath resistance pegged at 1.2778, which could eventually force the unit down to demand at 1.2432-1.2558. A closer look at price action on the daily timeframe also shows room for the USD/CAD to push as far south as support at 1.2598, which happens to fuse nicely with a trendline support etched from the low 1.2061.
As you can see, the H4 resistance area at 1.2781-1.2816 held firm on Monday and dragged the candles down to just ahead of the 1.27 handle going into the close.
Suggestions: Given the bigger picture, a safer short, in our view, would be to wait and see if H4 price closes sub 1.27. A close below here, followed up with a retest, would be an ideal sell signal down to 1.26.
1.26, as you may have already noticed, represents the daily support mentioned above at 1.2598.
Data points to consider: FOMC member Quarles speaks at 5.35pm; Fed Chair Yellen speaks at 7.30pm; BoC Gov. Poloz speaks at 5.55pm GMT.
Levels to watch/live orders:
- Buys: Flat (stop loss: N/A).
- Sells: Watch for H4 price to engulf 1.27 and then look to trade any retest of this level seen thereafter ([waiting for a H4 bearish candle to form following the retest – preferably a full or near-full-bodied candle – is advised] stop loss: ideally beyond the candle’s wick).
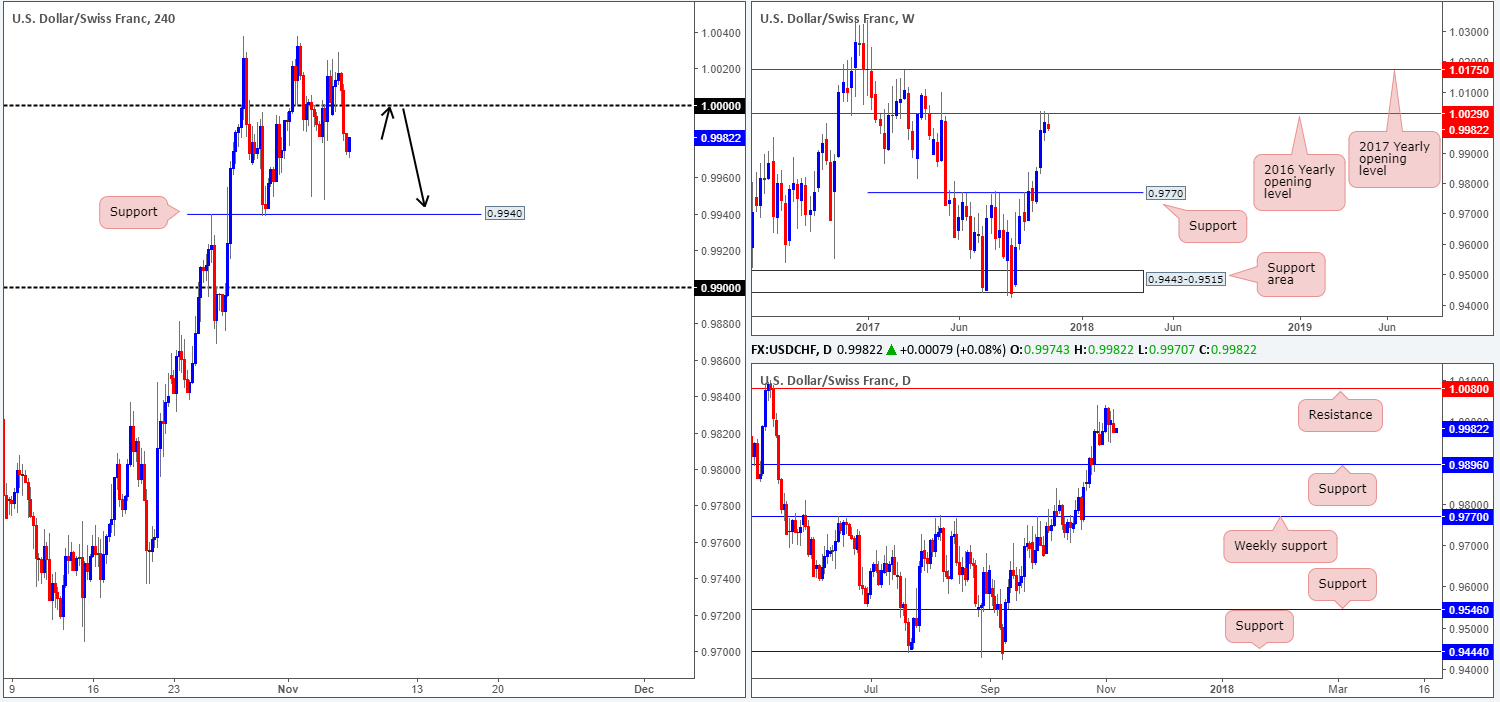
USD/CHF:
During the course of yesterday’s sessions, the USD/CHF probed the 2016 yearly opening level at 1.0029 and tumbled lower. Ripping its way through parity, the next downside target now on the radar is H4 support penciled in at 0.9940, followed by the 0.99 handle.
On the weekly timeframe, however, the next downside target does not come into view until we reach support at 0.9770. Down on the daily timeframe, the next area of concern is seen a little closer at 0.9896: another support.
Suggestions: Watch for H4 price to retest the underside of parity and hold ground. In order to sell from this line, we believe additional candle confirmation is required. This is largely due to how much 1.0000 has been chewed up of late. Should one manage to secure a sell position from 1.0000, the first take-profit target, at least for us, would be 0.9940, and then 0.99.
Data points to consider: FOMC member Quarles speaks at 5.35pm; Fed Chair Yellen speaks at 7.30pm GMT.
Levels to watch/live orders:
- Buys: Flat (stop loss: N/A).
- Sells: 1.0000 region ([waiting for a reasonably sized H4 bearish candle to form – preferably a full or near-full-bodied candle – is advised] stop loss: ideally beyond the candle’s wick).
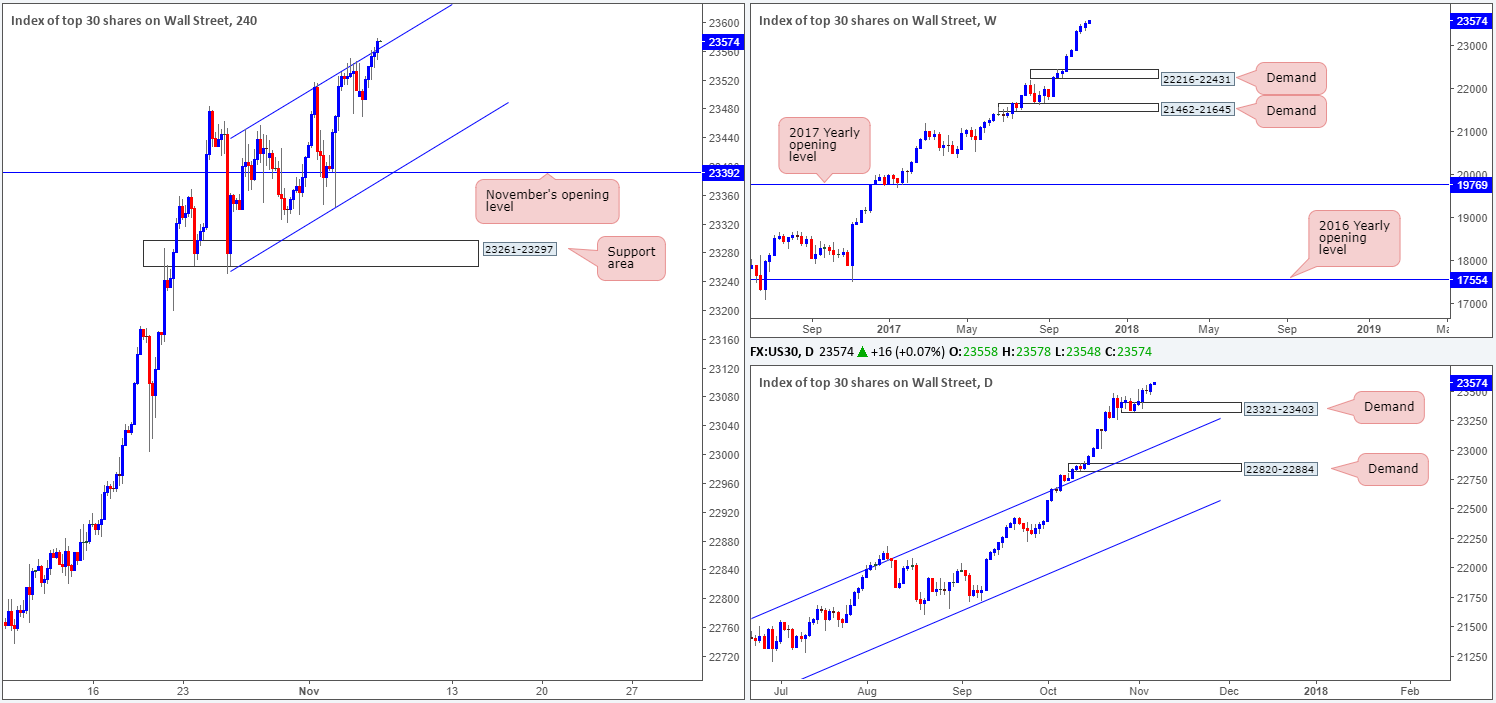
DOW 30:
Following a brief pullback from the underside of a H4 channel resistance extended from the high 23452, the DJIA bottomed around the 23468 mark on Monday and rallied higher. Not only did the index pierce above the channel structure, it also clocked a fresh record high of 23566.
As we were originally hoping for the pullback to challenge November’s opening level/H4 channel support taken from the low 23250, we do not really see much else to hang our hat on at current price. The next move may be a long on any retest seen at the top edge of the recently broken H4 channel resistance. However, for us, we would want to see the index punch a little higher before this becomes a reality.
Suggestions: Opting to stand on the sidelines might be the better road to take today, given the lack of confluence seen on the H4 timeframe right now.
Data points to consider: FOMC member Quarles speaks at 5.35pm; Fed Chair Yellen speaks at 7.30pm GMT.
Levels to watch/live orders:
- Buys: Flat (stop loss: N/A).
- Sells: Flat (stop loss: N/A).
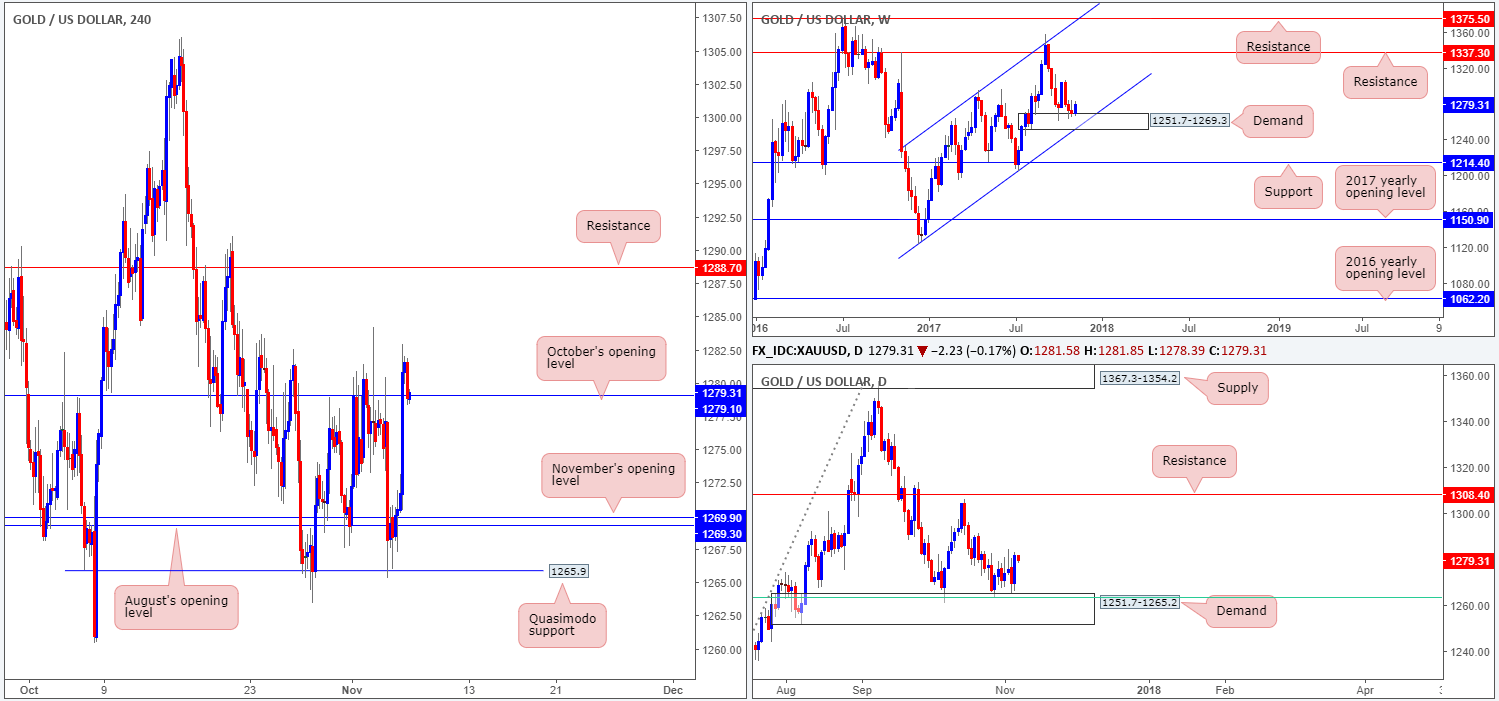
GOLD:
Thanks to a healthy bout of gold buying on Monday, the yellow metal closed above October’s opening level at 1279.1 and is, as we write, now seen retesting the line as support. Seeing as weekly price is currently bouncing from demand at 1251.7-1269.3, as is daily price from a smaller demand base (housed within the lower limits of the weekly zone) at 1251.7-1265.2, we are biased to the upside this morning. As such, a long from October’s opening level could be an option today.
Suggestions: Assuming that H4 price chalks up a healthy bullish candle from 1279.1, preferably in the shape of a full or near-full-bodied candle, a long from this region looks relatively attractive up to H4 resistance plotted at 1288.7. The reason behind requiring additional candle confirmation simply comes down to the risk of a fakeout below October’s opening level.
Levels to watch/live orders:
- Buys: 1279.1 region ([waiting for a reasonably sized H4 bullish candle to form – preferably a full or near-full-bodied candle – is advised] stop loss: ideally beyond the candle’s tail).
- Sells: Flat (stop loss: N/A).


