A note on lower timeframe confirming price action…
Waiting for lower timeframe confirmation is our main tool to confirm strength within higher timeframe zones, and has really been the key to our trading success. It takes a little time to understand the subtle nuances, however, as each trade is never the same, but once you master the rhythm so to speak, you will be saved from countless unnecessary losing trades. The following is a list of what we look for:
- A break/retest of supply or demand dependent on which way you’re trading.
- A trendline break/retest.
- Buying/selling tails/wicks – essentially we look for a cluster of very obvious spikes off of lower timeframe support and resistance levels within the higher timeframe zone.
- Candlestick patterns. We tend to only stick with pin bars and engulfing bars as these have proven to be the most effective.
We search for lower timeframe confirmation between the M15 and H1 timeframes, since most of our higher-timeframe areas begin with the H4. Stops are usually placed 5-10 pips beyond confirming structures.
EUR/USD:
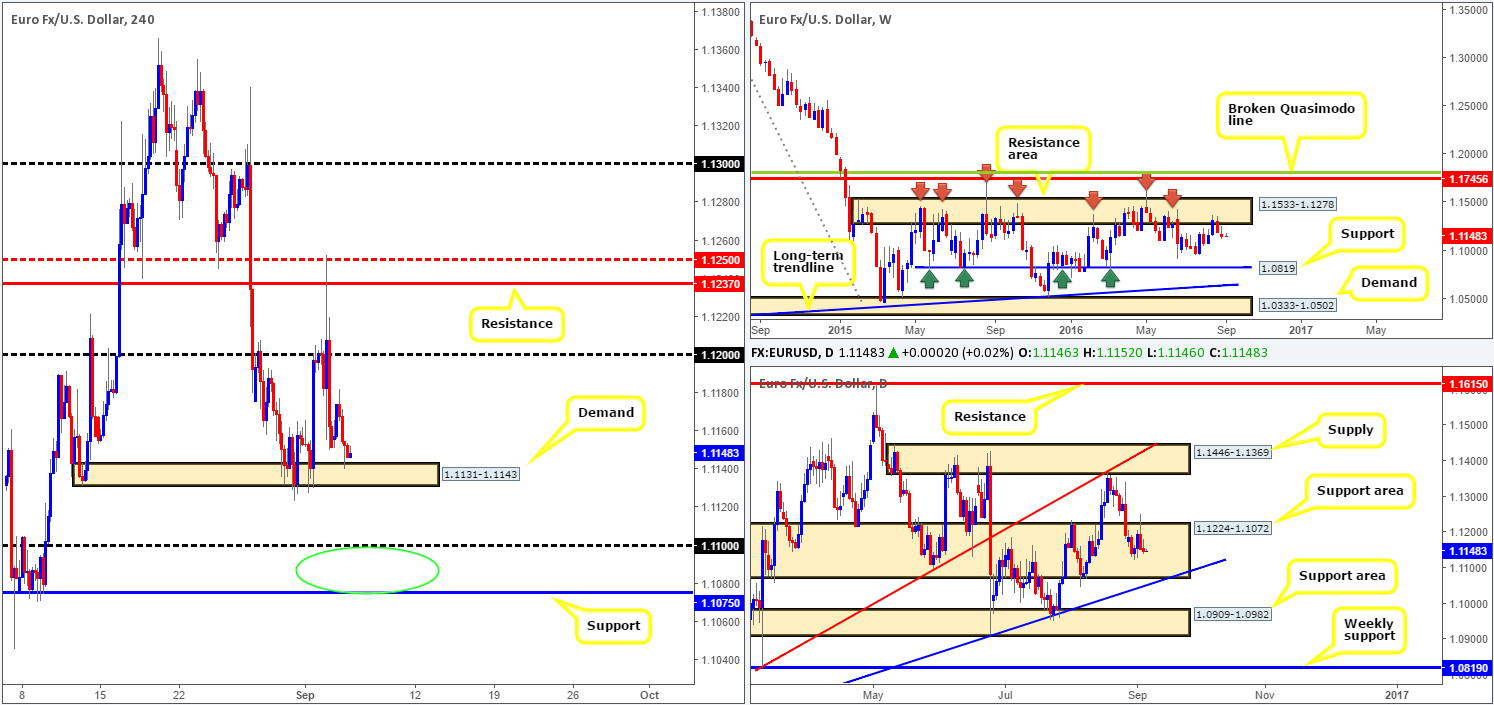
Trade was relatively thin during yesterday’s sessions due to both the US and Canadian banks being closed in observance of Labor Day. Despite this, the EUR did manage to reach highs of 1.1182 before reversing tracks and going on to test the top edge of a H4 demand base seen at 1.1131-1.1143. Consequent to yesterday’s rather sluggish movement, much of the following analysis will echo thoughts put forward in Monday’s report.
As things stand on the higher-timeframe picture, we can see weekly price extended losses last week from the major resistance area seen at 1.1533-1.1278. Meanwhile, daily candles remain loitering within a support area coming in at 1.1224-1.1072. While there’s a possibility of further consolidation within this area, we feel pressure from the overhead weekly supply will eventually push prices south to test the daily support area seen at 1.0909-1.0982.
Our suggestions: Given the points made above, the current H4 demand is also eventually likely to give way. A decisive close below this barrier followed by a retest is, in our book, sufficient enough to condone an intraday sell. Granted, this would mean selling into a daily support area, but given the position of price on the weekly chart and space seen for the unit to move lower on the H4 chart, we feel it is a high-probability trade.
Should this come to fruition, we’d look to liquidate shorts around the 1.11 band and begin hunting for lower timeframe confirmed (see the top of this report for lower timeframe entry techniques) buying opportunities around the 1.1075/1.11 region (green circle) for an intraday move north (1.1075 is a H4 support which merges with a daily trendline support at 1.0516 and is located within the extremes of the current daily support area).
Levels to watch/live orders:
- Buys: 1.1075/1.11 [tentative – confirmation required] (Stop loss: dependent on where one confirms this area).
- Sells: Watch for price to close below the H4 demand at 1.1131-1.1143 and then look to trade any retest seen thereafter.
GBP/USD:
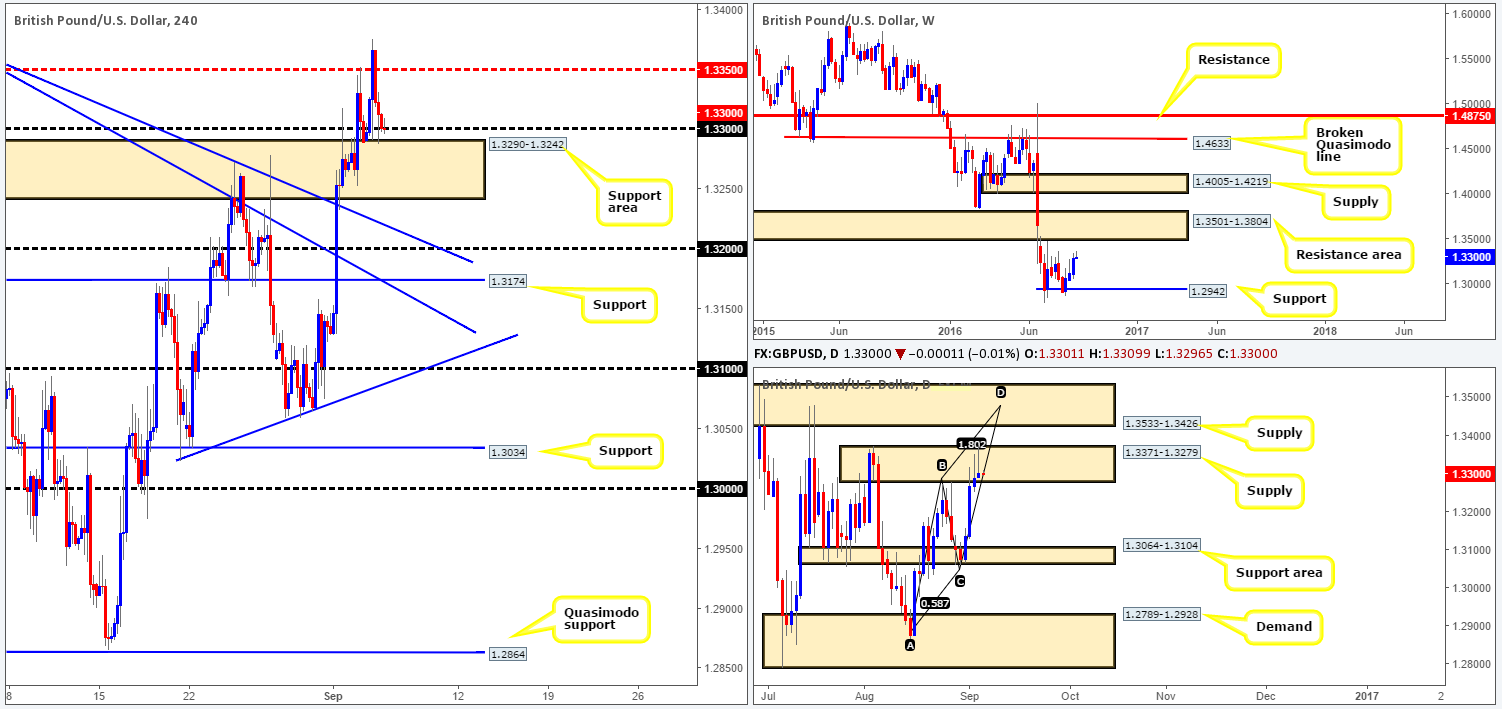
The UK services sector reported a better than expected month, consequently propelling the pair to highs of 1.3375 yesterday. As you can see, price popped its head above the H4 mid-way resistance 1.3350, but was unable to sustain gains beyond this point. The pair ended the day closing just ahead of the 1.33 handle, only ten pips above Friday’s closing point. What this move also did was chalk up a second consecutive daily bearish selling wick within the daily supply zone seen at 1.3371-1.3279.
However, as we highlighted in our previous report, before considering a sell in this market based on the daily candles, we’d urge you to consider the fact that there’s a slightly more attractive daily supply zone sitting directly above at 1.3533-1.3426. Not only is this area glued to the underside of a weekly resistance area at 1.3501-1.3804 but it also sports a daily AB=CD approach (see chart).
Our suggestions: Although price could still enter into a sell off from the current daily supply zone, it’s highly possible that this market will continue northbound towards the daily supply area mentioned above at 1.3533-1.3426 in view of its connection with the above noted weekly resistance area. With that being the case, we are once again (we missed the move from here yesterday) looking for the 1.33 handle/H4 support area at 1.3290-1.3242 to hold firm so we can begin looking to enter long (preferably with lower timeframe confirmation). The ultimate take-profit target from here would be the underside of the daily supply at 1.3426.
Levels to watch/live orders:
- Buys: 1.3290-1.3242/1.33 [tentative – confirmation required] (Stop loss: dependent on where one confirms this area).
- Sells: Flat (Stop loss: n/a).
AUD/USD:
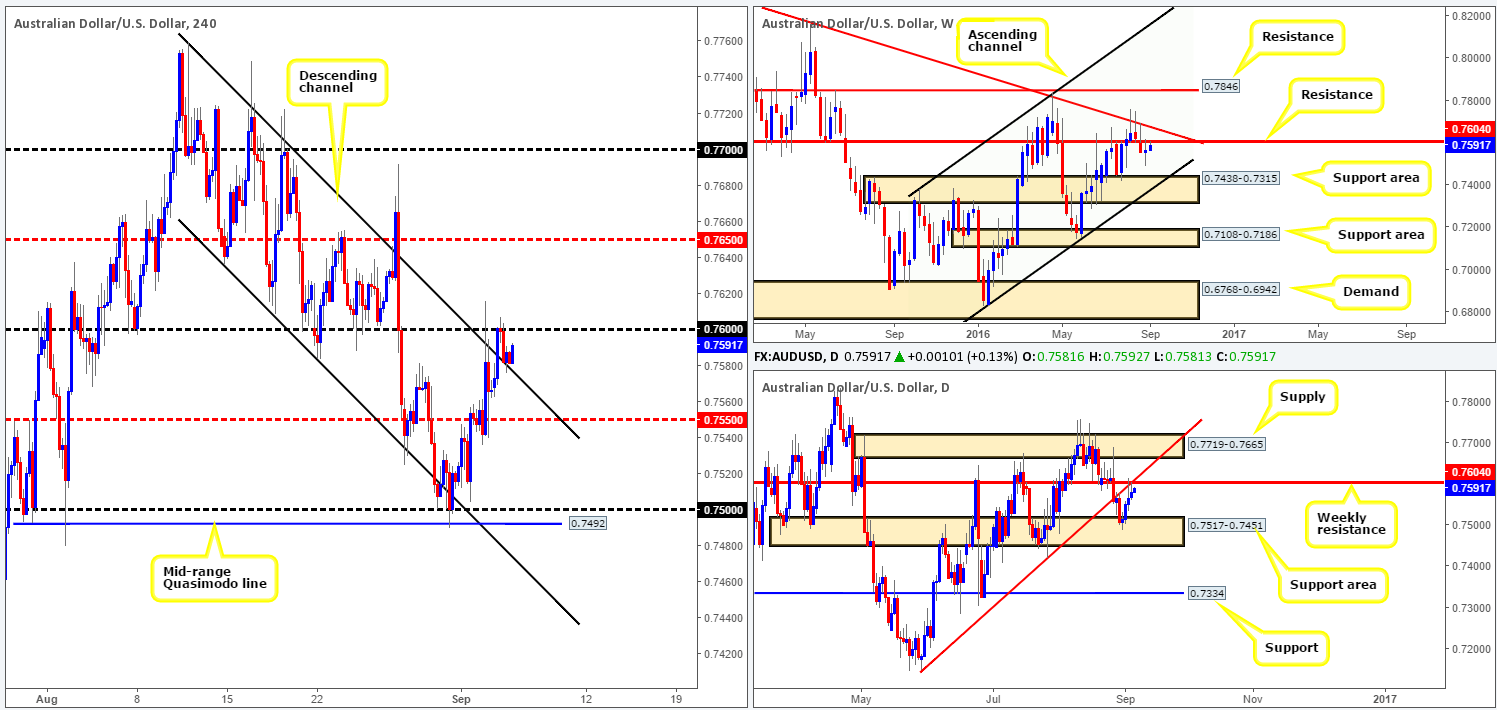
Going into the early hours of yesterday’s trading the commodity-linked currency broke above the H4 channel resistance line taken from the high 0.7759, and extended north to the 0.76 handle where price begun to top out as we entered into London’s session. Following this, the pair weakened from here and retested the top edge of the recently broken H4 channel resistance as US traders entered the fray. So far this line has held firm.
We agree that with price basing around the top edge of the H4 channel line does somewhat indicate that the bulls are in control right now. For all that though, we would not recommend buying here simply because not only would you be entering long into the 0.76 handle, but you’d also be going up against a weekly resistance line carved from 0.7604, which happens to merge with a daily trendline extended from the low 0.7148.
Our suggestions: Because there is a weekly resistance line lurking just above current price, our team has absolutely no interest in buying this market. In regards to selling, however, we would consider becoming sellers in this market following a close beyond the H4 mid-way support 0.7550. Until that time, we are happy to take a back seat for the time being.
Levels to watch/live orders:
- Buys: Flat (Stop loss: n/a).
- Sells: Watch for price to close below the mid-way support 0.7550 and then look to trade any retest seen thereafter (lower timeframe confirmation required).
USD/JPY:
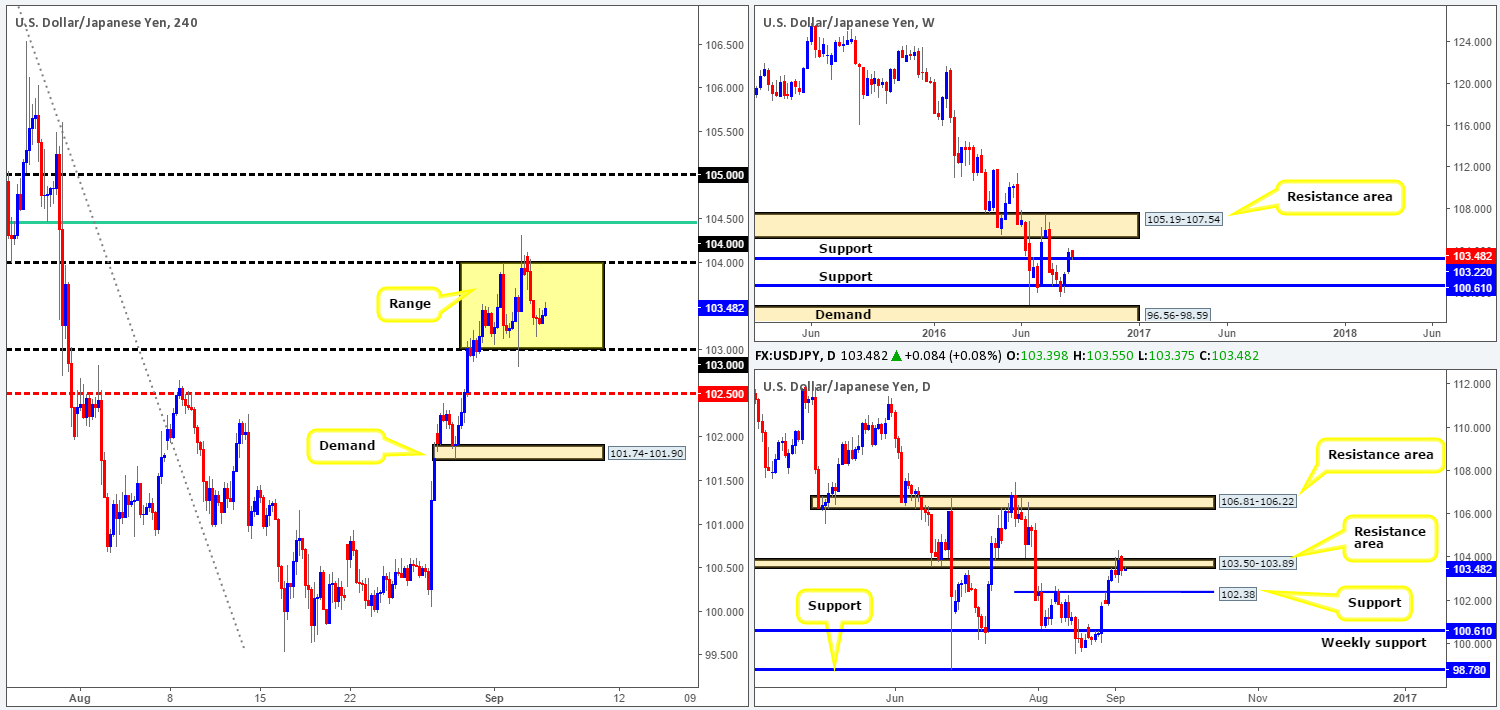
Beginning with a look at the weekly chart this morning, we can see that the USD/JPY is in the process of retesting the recently broken resistance line at 103.22 as support. In spite of this, down on the daily chart, there appears to be room for the pair to drop lower to test a minor support level drawn from 102.38, thus we may see a slight breach of the weekly support level before buyers step in.
Stepping across to the H4 chart, the unit is currently ranging between two psychological barriers: 103/104 (yellow range). Taking into account the higher-timeframe picture, here’s what we have jotted down so far:
- A close above 104 could take place given the weekly chart’s position. The next areas to watch are the 104.50 region (merges with a H4 61.8% Fib at 104.45) and the 105 handle, which sits only 20 pips below a weekly resistance area at 105.19-107.54 (the next upside target on that timeframe).
- As for daily action showing room to drop lower, we might see price slip below 103 and attack the H4 mid-way support 102.50. However, our team will not take a break below 103 as a bearish signal!
Our suggestions: Look for a close above 104. This – coupled with a retest is, in our opinion, enough to condone a long position, targeting 104.50 followed closely by the 105 hurdle. From here, we’d look to unwind long positions and begin considering shorts due to the nearby weekly resistance area.
In the event of a breach seen around 103, however, our team will look to keep a close eye on the 102.50 region. A fakeout through this number to tag in the daily support 102.38 would, at least for us, be considered a signal to buy.
Levels to watch/live orders:
- Buys: Watch for price to close above the 104 handle and then look to trade any retest seen thereafter. 102.50 region [watch for a whipsaw through this level] (Stop loss: place below the trigger candle i.e. the whipsaw candle).
- Sells: Flat (Stop loss: n/a).
USD/CAD:
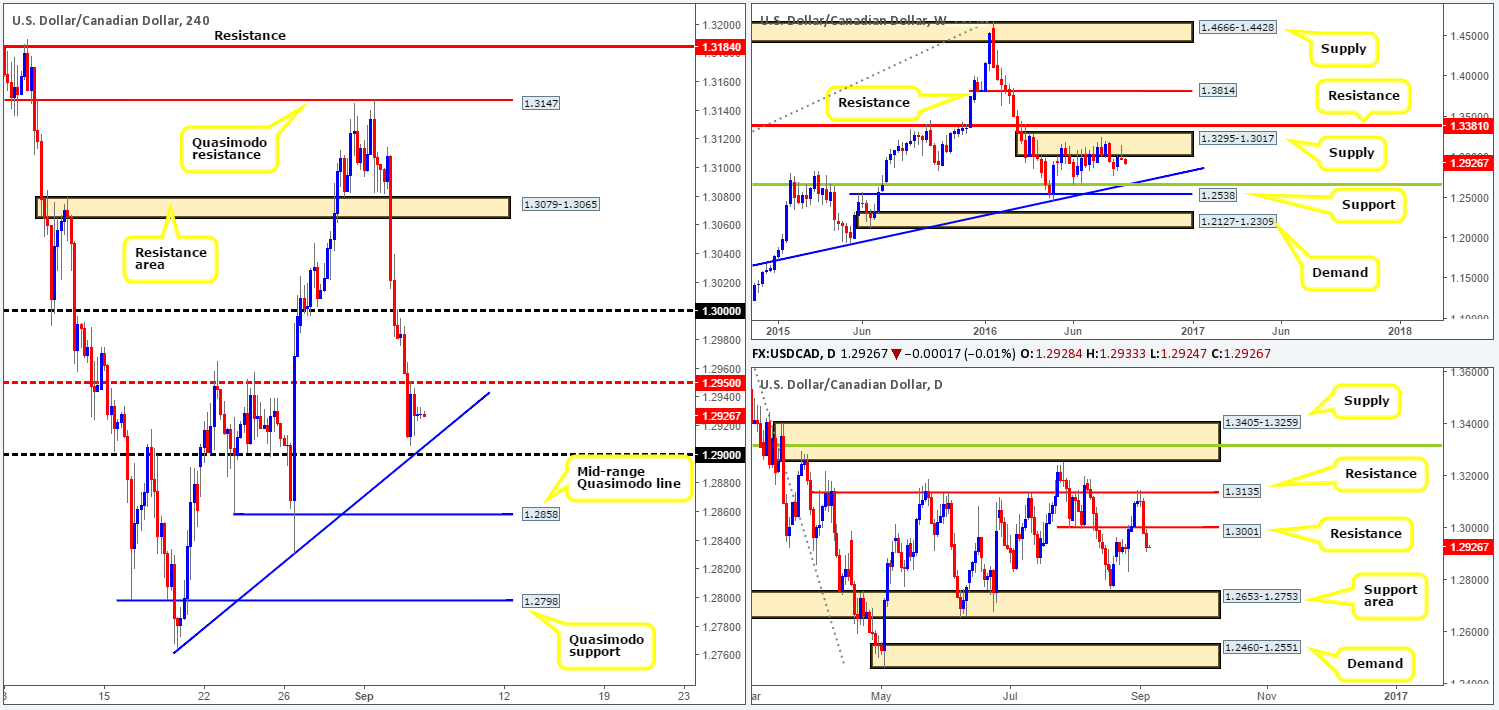
Bolstered by a strong bid over in the oil market yesterday, the USD/CAD sold off. In consequence to this, the H4 mid-way support 1.2950 was taken out, with price seen stalling ahead of the 1.29 handle (merges with a H4 trendline support extended from the low 1.2763). Yesterday’s selling should not really come as too much of a surprise, given that weekly price formed a beautiful-looking selling wick from within a supply zone at 1.3295-1.3017 last week, along with price also consuming the daily support at 1.3001.
While price is beginning to bottom out, we feel this will only be a brief pause before the market continues to push south today and break below the 1.29 band. The next areas to keep an eyeball on beyond 1.29 are the H4 mid-range Quasimodo level at 1.2858, followed by the H4 Quasimodo support at 1.2798.
Our suggestions: Watch for price to break below both the 1.29 level and its intersecting H4 trendline support. Should this come into view, and assuming that price retests the underside of 1.29 and forms a bearish close, this is, at least in our book, sufficient enough to permit a short entry targeting the H4 supports highlighted in bold.
Levels to watch/live orders
- Buys: Flat (Stop loss: n/a).
- Sells: Watch for price to close below the 1.29 handle and then look to trade any retest seen thereafter.
USD/CHF:
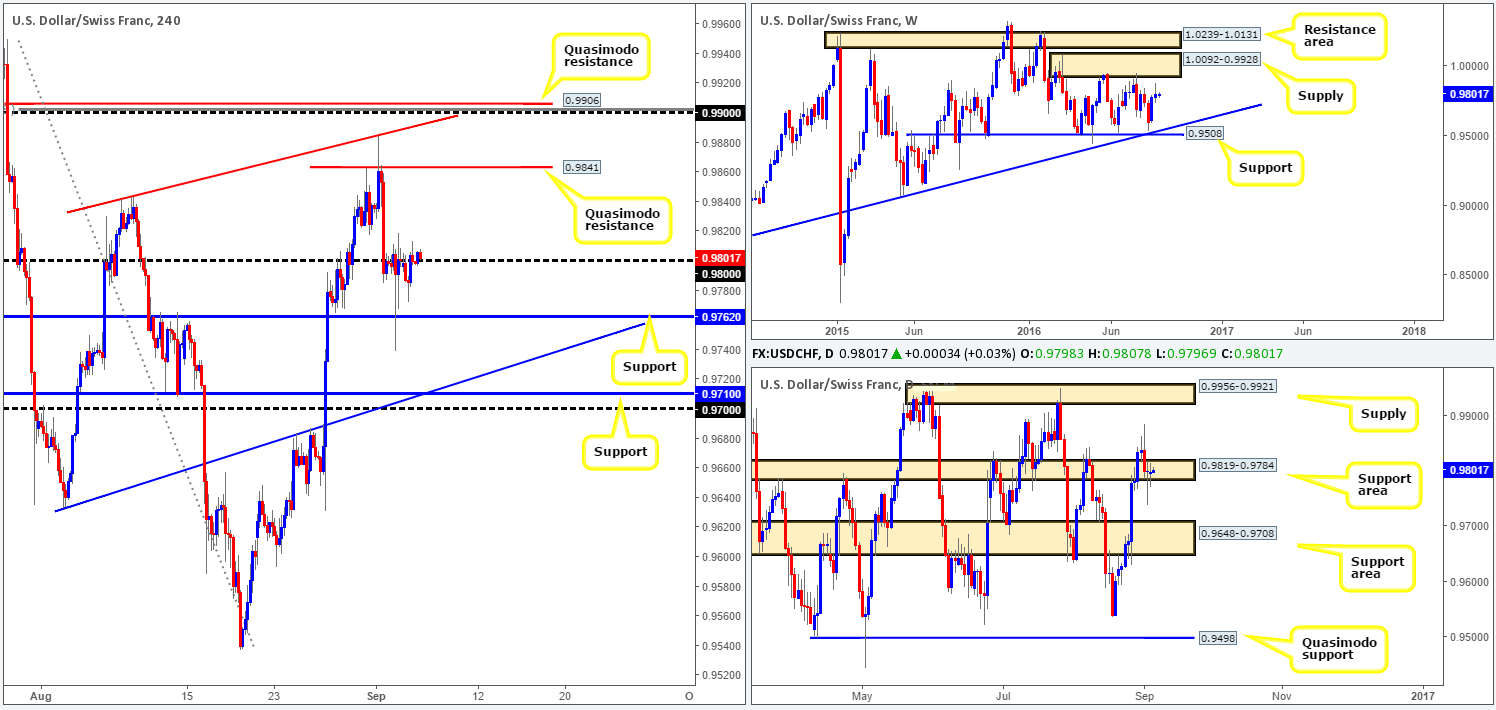
Price took on a more sober tone yesterday due to both the US and Canadian banks being closed in observance of Labor Day. The day’s range came in at around 40 pips, with the market closing the day relatively unchanged. Looking at the H4 chart, nevertheless, we can see that the Swissy is seen trading just above the 0.98 handle. Should price remain bid above this level, it’s likely we’ll see price connect with the H4 Quasimodo resistance level at 0.9841, and quite possibly the 0.99 band just above it.
The reason we believe a push higher may be on the cards today comes down to seeing daily action occupying a support area penciled in at 0.9819-0.9784. In addition to this, we can also see that there’s room to advance north on the weekly chart until price shakes hands with the weekly supply zone carved in at 1.0092-0.9928.
Our suggestions: One could look to buy from around the 0.98 region today with the backing of a lower timeframe buy signal (see the top of this report for lower timeframe entry techniques). From here we’d be looking to target 0.9841 as well as the 0.99 region.
Should price reach 0.99, we aim to close out any long positions and will look to short at 0.9899, placing stops above the high 0.9950. 0.99 is a far more attractive sell zone than 0.9841 due to the following:
- Sits thirty pips below the underside of weekly supply at 1.0092-0.9928.
- Merges with a H4 trendline resistance taken from the high 0.9841.
- Boasts a H4 88.6% Fib resistance at 0.9901.
Levels to watch/live orders:
- Buys: 0.98 region [tentative – confirmation required] (Stop loss: dependent on where one confirms this area).
- Sells: 0.9899 [pending order] (Stop loss: 0.9952).
DOW 30:
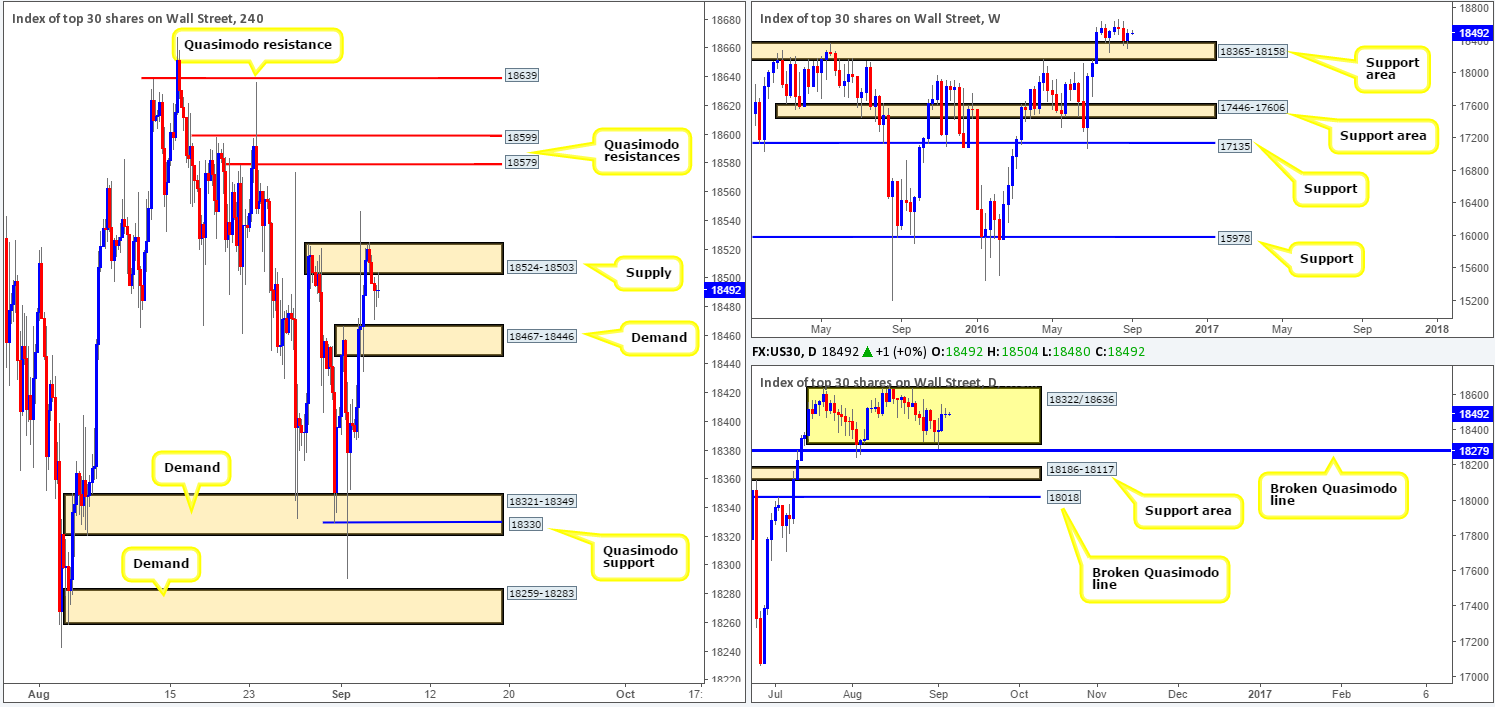
In view of weekly price recently rebounding off the top edge of a support area coming in at 18365-18158, we could see the index challenge and possibly break the all-time high 18668 this week. Daily action on the other hand, remains trading mid-range between 18322/18636. Nevertheless, we’re confident that the index will, given the weekly picture, attack the top-side of this range sometime this week, and likely close above it!
Turning our attention to the H4 chart, we can see that the buyers failed to close price above the H4 supply zone seen at 18524-18503, and instead declined to lows of 18471 on the day. However, as we mentioned in Monday’s report, given the predominant uptrend in place, the weekly support area and also space to move north on the daily chart, we feel that it’s only a matter of time before this H4 supply eventually gives way.
Our suggestions: Watch for a decisive push above the current H4 supply. This, along with a strong retest should be enough to condone a long entry, targeting the H4 Quasimodo at 18579 as an initial take-profit target. If this comes to fruition, we would personally look at holding some of this position beyond this target, since there’s potential for this market to break all-time highs here!
Levels to watch/live orders:
- Buys: Watch for price to close above the H4 supply at 18524-18503 and then look to trade any retest seen thereafter.
- Sells: Flat (Stop loss: N/A).
GOLD:
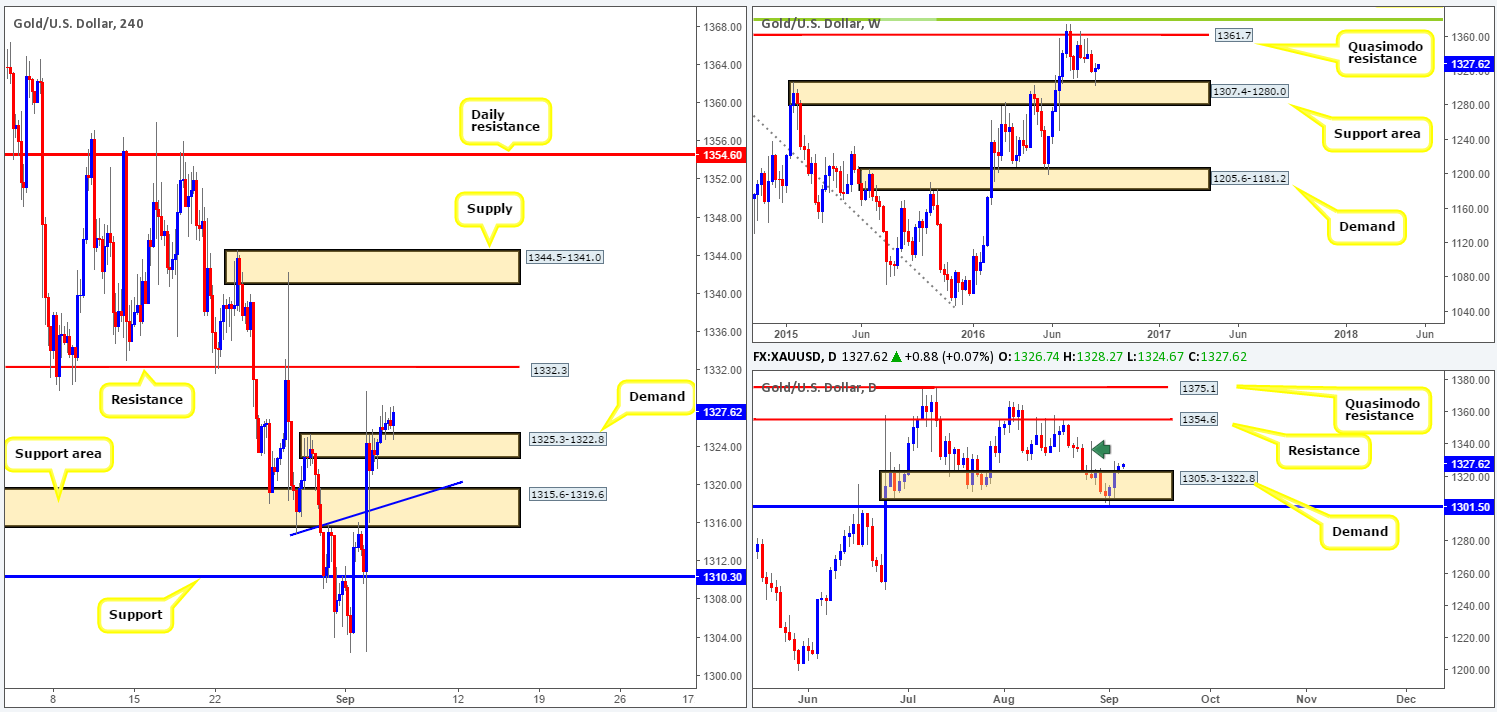
Shortly after the market opened, gold was bid above the H4 supply zone at 1325.3-1322.8. Following this, the metal entered into a phase of consolidation using the top edge of the recently broken supply as demand. Consequent to this rather lackluster performance, much of the following report will mirror Monday’s analysis…
Up on the weekly chart, we can see that price rebounded from the support area at 1307.4-1280.0. This forced price to print a rather attractive buying tail last week, which could, given where price bounced from, lead to further buying this week. The next upside target from this angle can be seen at 1361.7: a Quasimodo resistance level. Looking down to the daily chart, last Thursday’s fakeout beyond the demand zone at 1305.3-1322.8 helped push prices higher on Friday. In view of the large wick seen marked with a green arrow at 1342.2, we feel the majority of the supply above current price is consumed. Therefore, the next barrier of resistance we have on our watchlist is 1354.6.
Our suggestions: Quite simply, watch for a decent-sized H4 bullish candle to form off of the current H4 demand zone. Should this be seen, a long trade, with your stop placed below the trigger candle is certainly something worth consider, targeting the H4 resistance at 1332.3, followed by H4 supply at 1344.5-1341.0 and then the aforementioned daily resistance level.
Levels to watch/live orders:
- Buys: Watch for a H4 bullish close off of the H4 demand at 1325.3-1322.8 (Stop loss: below the trigger candle).
- Sells: Flat (Stop loss: N/A).


