A note on lower timeframe confirming price action…
Waiting for lower timeframe confirmation is our main tool to confirm strength within higher timeframe zones, and has really been the key to our trading success. It takes a little time to understand the subtle nuances, however, as each trade is never the same, but once you master the rhythm so to speak, you will be saved from countless unnecessary losing trades. The following is a list of what we look for:
- A break/retest of supply or demand dependent on which way you’re trading.
- A trendline break/retest.
- Buying/selling tails/wicks – essentially we look for a cluster of very obvious spikes off of lower timeframe support and resistance levels within the higher timeframe zone.
- Candlestick patterns. We tend to stick with pin bars and engulfing bars as these have proven to be the most effective.
We search for lower timeframe confirmation between the M15 and H1 timeframes, since most of our higher-timeframe areas begin with the H4. Stops are usually placed 5-10 pips beyond confirming structures.
EUR/USD:
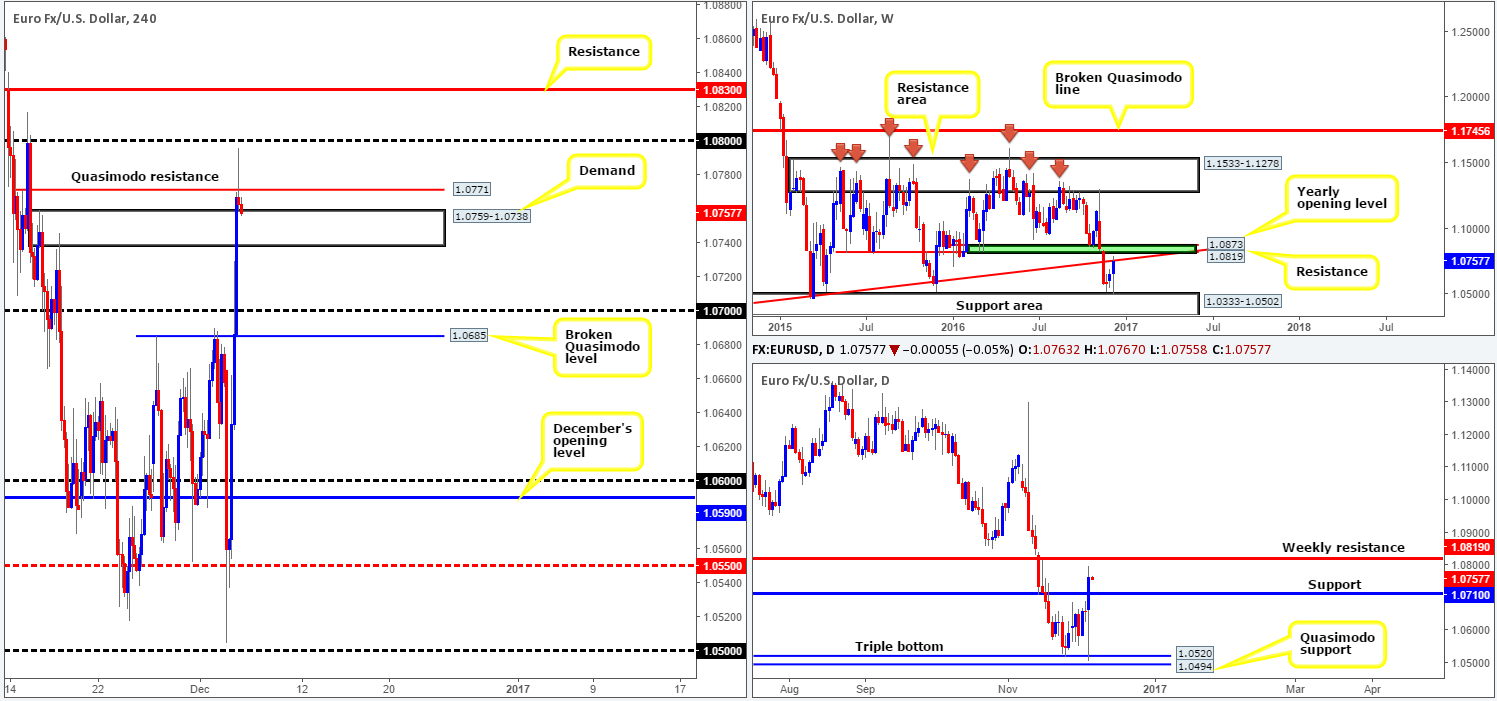
The single currency, as you can see, fell sharply in early trading on news of Italian Prime Minister Matteo Renzi’s resignation amid yesterday’s constitutional referendum. The pair managed to clock lows of 1.0504 before switching tracks and rallying just as sharply against its US counterpart. Several resistances were wiped out during this bullish assault, which ended the day with the unit piercing through a H4 Quasimodo resistance level coming in at 1.0771.
Over on the bigger picture, however, we can see that weekly action is now flirting with a trendline resistance extended from the low 0.8231. In addition to this, it might also pay to remain cognizant of the nearby 2016 yearly opening level at 1.0873 and resistance at 1.0819 lurking just above, as this may encourage a fakeout through the current trendline resistance later on today.
Our suggestions: While shorting from the current H4 Quasimodo resistance seems a reasonable approach given the position of price on the weekly chart, our desk would not be comfortable pulling the trigger here considering that the H4 candles are shaking hands with the H4 supply-turned demand at 1.0759-1.0738. A close below this area would, we agree, open up some space to the downside, but nothing to get excited about as price would then be within striking distance of the daily support at 1.0710! Ultimately, we would need to see a close beyond the H4 broken Quasimodo level at 1.0685 for us to become sellers, since there is little standing in the way of the pair from dropping down to at least the 1.06 handle.
Alternatively, should we see price strike the 1.0830/1.08 neighborhood today, which aligns with weekly resistance at 1.0819, we would consider shorting from here on the basis that a reasonable H4 bearish candle forms. The reason for requiring this confirmation comes from the possibility that a fakeout may be seen above this area to the aforementioned yearly opening level.
Data points to consider: There’s relatively little high-impacting data on the docket today for both the EUR and USD markets.
Levels to watch/live orders:
- Buys: Flat (stop loss: N/A).
- Sells: 1.0830/1.08 region ([reasonably sized H4 bearish close required prior to pulling the trigger] stop loss: ideally beyond the trigger candle).
GBP/USD:
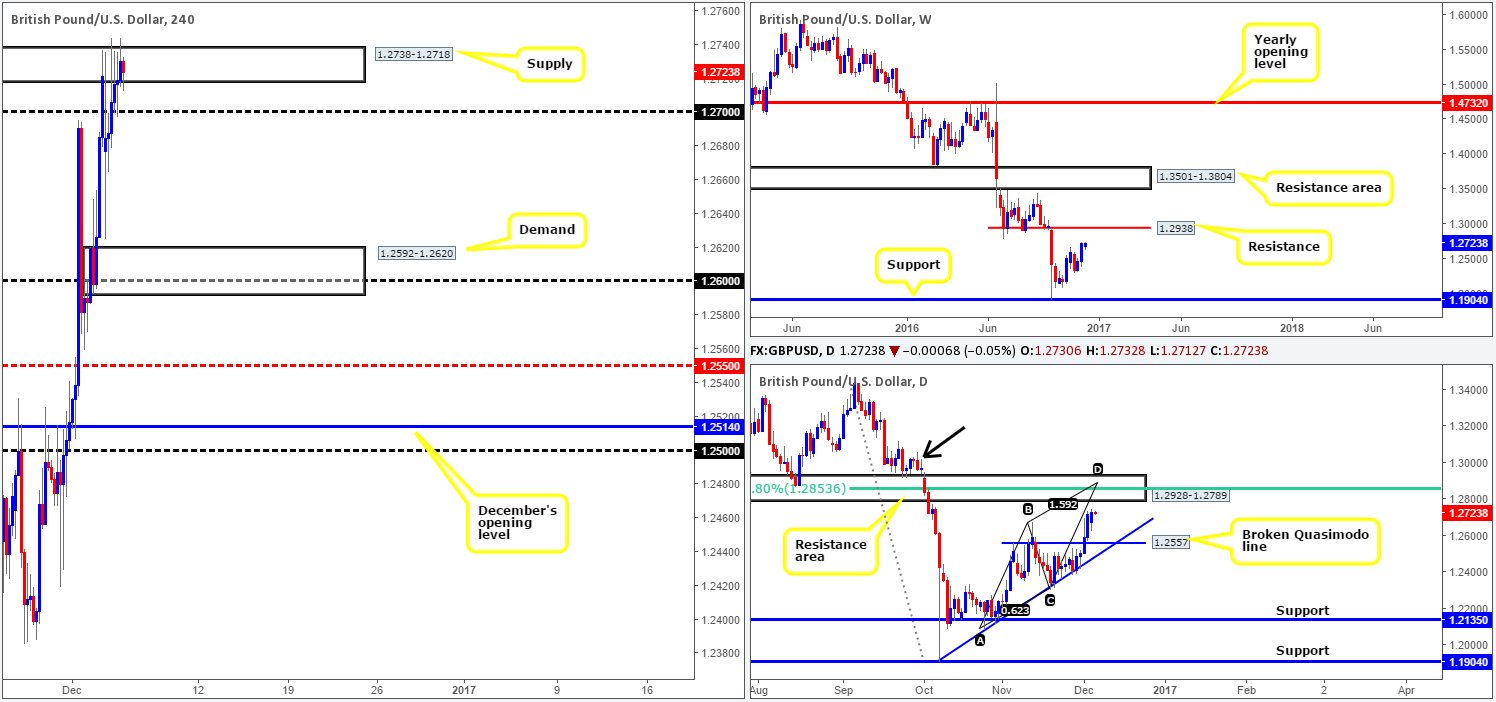
The GBP/USD closed marginally higher on Monday, consequently printing its fifth consecutive bull candle. The UK service sector reported a better-than-expected month in the early hours of London, but was not sufficient enough to shove price through the H4 supply zone at 1.2738-1.2718. Be that as it may, offers around this area do appear exhausted right now, and thus could portend further upside.
A close above the current H4 supply would likely stimulate an upside move to the 1.28 neighborhood. Still, traders need to be prepared for the possibility of a pullback to 1.27 beforehand. Should a close higher come to fruition, not only would 1.28 and a nearby H4 supply at 1.2872-1.2839 be in view, but also a daily resistance area at 1.2928-1.2789 which happens to be positioned just beneath a weekly resistance level at 1.2938. Of particular interest here is the confluence seen within this zone: an AB=CD bearish completion point at 1.2890 and a 61.8% Fib resistance level at 1.2853. Despite this confluence, traders may also want to note that there’s a chance the market could fake beyond this area to tag the nearby supply marked with a black arrow at 1.3058-1.2966.
Our suggestions: On account of the above points, we’re currently watching for a close above the H4 supply. This would be our first cue. Upon seeing this, a rally up to the 1.08 region could be on the cards. Although 1.08 converges with the underside of the aforementioned daily resistance area , our team has stated that shorts would be best taken around the H4 supply located just above 1.08 at 1.2872-1.2839, since it fuses nicely with the daily convergence point (AB=CD/Fib resistance – see above). We would, dependent on the time of day, consider entering short from this zone without the need to wait for confirmation, on the basis that it holds strong confluence with higher-timeframe structures.
Data points to consider: There’s relatively little high-impacting data on the docket today for both the GBP and USD markets.
Levels to watch/live orders:
- Buys: Flat (stop loss: N/A).
- Sells: 1.2872-1.2839 ([shorts at market here are a possibility] stop loss: 1.2875).
AUD/USD:
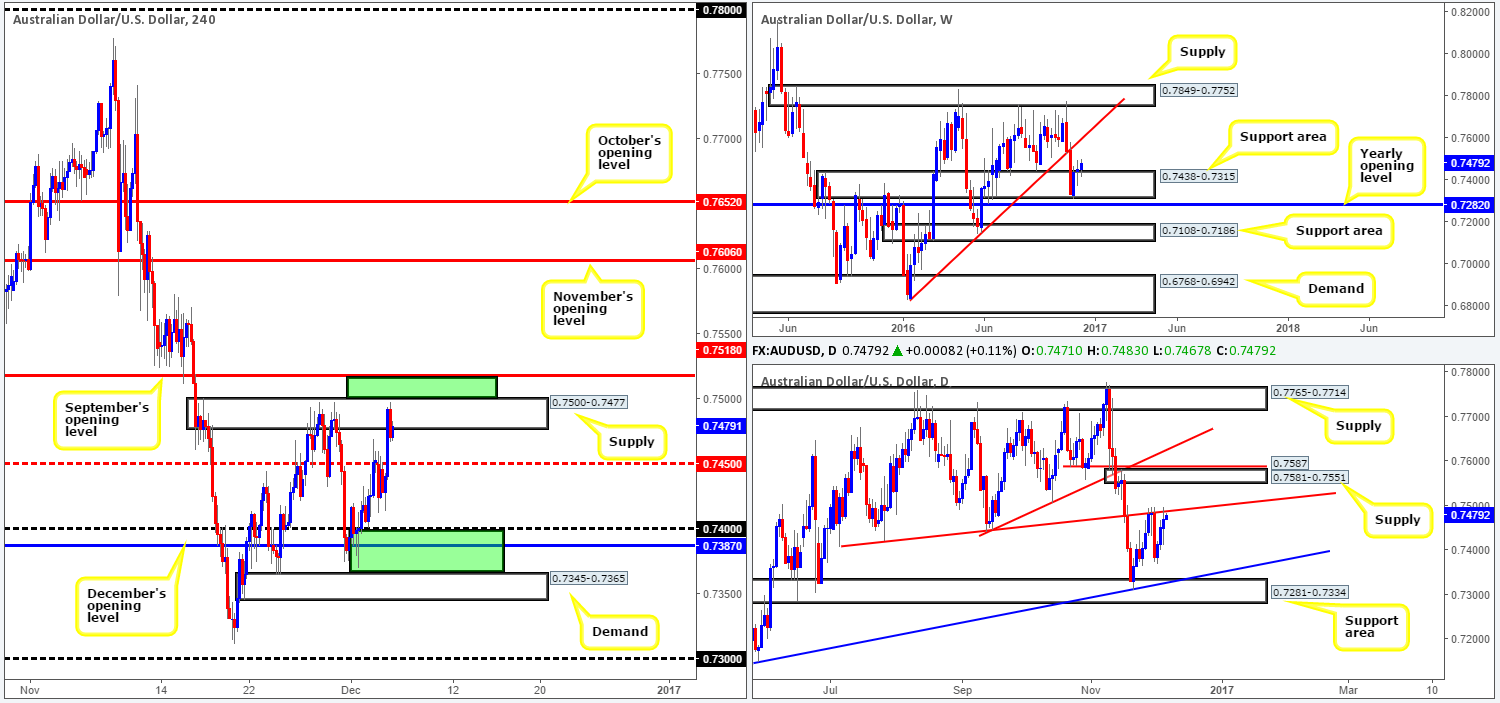
Working our way from the top this morning, we can see that weekly price remains reasonably well-bid from the support area coming in at 0.7438-0.7315. A continuation move higher from this angle could force price to connect with a trendline resistance stretched from the low 0.6827. Meanwhile, a push south from here may portend a fakeout to the 2016 yearly opening level at 0.7282. Daily action on the other hand, is now seen testing a trendline resistance taken from the low 0.7407. In the event that this hurdle fails to hold, nevertheless, supply at 0.7581-0.7551, followed closely by a broken Quasimodo line at 0.7587 would very likely be the next areas on the hit list.
In conjunction with the above noted daily trendline resistance, the H4 candles are also seen testing a H4 supply base drawn from 0.7500-0.7477. Monday’s advance can likely be attributed to an overall weak dollar and also upbeat Chinese data released going into the early hours of the day.
Our suggestions: The main interest in this market at the moment is the area seen between H4 supply at 0.7500-0.7477 and September’s opening level at 0.7518 (upper green zone). The zone is considered, at least by our desk, to be a fakeout area. Our reasoning simply stems from the amount of stops likely positioned above the current H4 supply, hence the expectation of a fakeout/stop run. Nevertheless, as there is risk of weekly bulls pushing this market higher from here (see above), we would recommend waiting for a H4 bear candle to confirm seller interest before pressing the sell button!
Data points to consider: RBA (Reserve Bank of Australia) economic policy meeting at 3.30am.
Levels to watch/live orders:
- Buys: Flat (stop loss: N/A).
- Sells: 0.7518/0.75 ([reasonably sized H4 bearish close required prior to pulling the trigger] stop loss: ideally beyond the trigger candle).
USD/JPY:
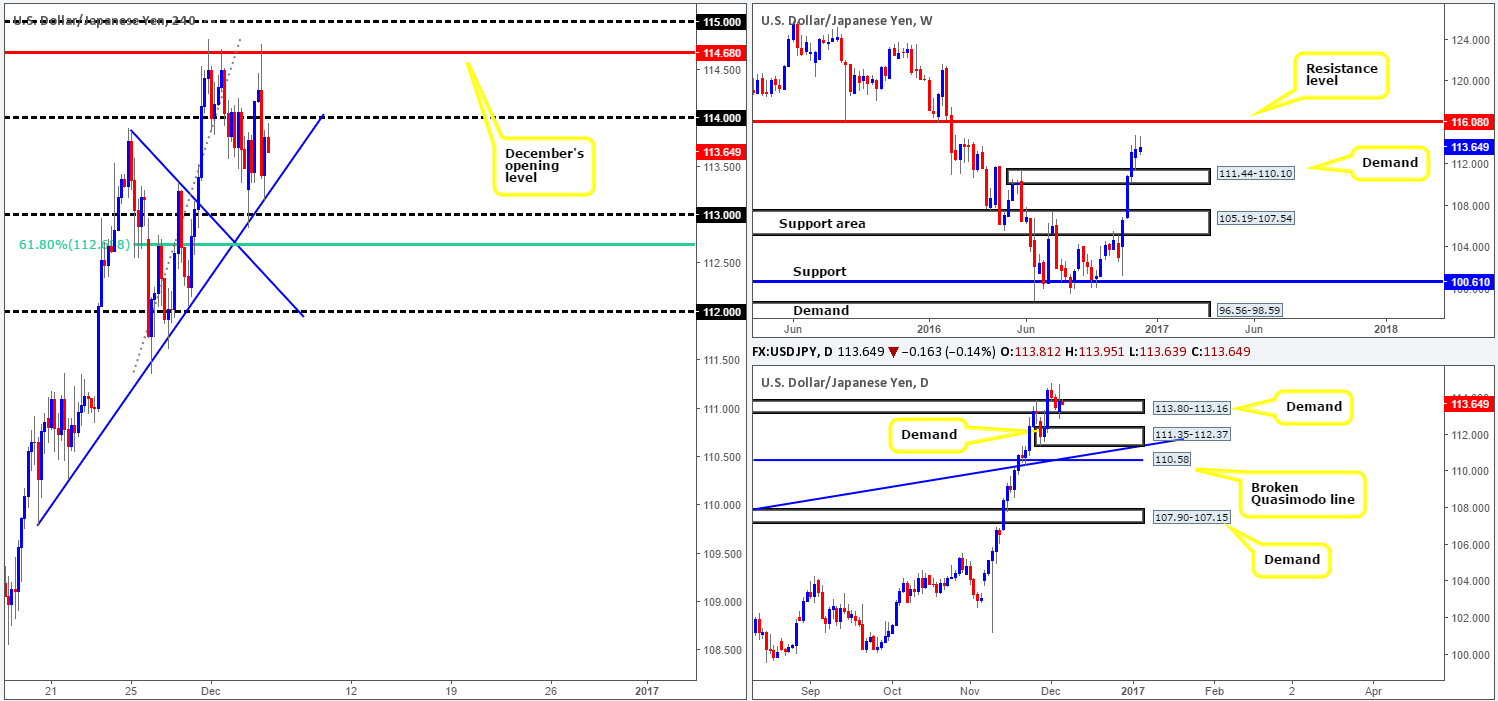
The pair began the week robustly, consequently squeezing out shorts from the 114 handle and forcing price to test December’s opening level at 114.68 going into the US segment. The move was aided by US services PMI coming in stronger than expected. Nonetheless, risk appetite turned sour from the 114.68 region and aggressively drove lower. Psychological support 114 was retaken and price ended the day testing trendline support extended from the low 109.80.
According to our desk, the weekly chart displays room to continue advancing this week up to resistance at 116.08 – a level that held beautifully as support throughout 2015. Down on the daily chart, supply-turned demand at 113.80-113.16 continues to hold ground. Providing that the market remains bullish from here, we see absolutely no reason (due to there being little active supply seen to the left of current price) why price cannot reach the aforementioned weekly resistance level.
Our suggestions: Seeing as price is currently trading nearby yesterday’s opening price, our outlook for the pair remains the same. Ultimately, our team is suggesting holding fire and letting the bulls prove themselves further this morning before attempting to buy this market. A H4 close above 114 followed up with a retest would, at least in our book, be enough to justify a buy position, targeting 114.68/115. A close above 115, nevertheless, suggests further upside to the 116 handle, which effectively represents the weekly resistance band at 116.08.
Data points to consider today: There’s relatively little high-impacting data on the docket today for both the JPY and USD markets.
Levels to watch/live orders:
- Buys: Watch for a H4 close above 114 and then look to trade any retest seen thereafter (stop loss: ideally beyond the trigger candle).
- Sells: Flat (stop loss: N/A).
USD/CAD:
In view of weekly price remaining bearish below resistance at 1.3381, as well as the daily candles recently retesting the underside of a resistance drawn from 1.3295, lower prices are likely on the cards. The nearest higher-timeframe support target can be seen on the daily chart: a Quasimodo support coming in at 1.3139. With the higher-timeframe picture in mind, the 1.33 handle along with the H4 supply at 1.3334-1.3317 is what we currently have our eye on. 1.33 is attractive due to its connection with the daily resistance at 1.3295. However, considering that psychological barriers are typically prone to fakeouts, one could be inclined to think a whipsaw through 1.33 up to the nearby fresh H4 supply may be on the horizon.
Our suggestions: Our team has come to a consensus that shorting from the H4 supply area is the better route to take, since we like that fact that buy stops are likely located just above 1.33, thus providing the big players liquidity to sell into. Therefore, we believe that the H4 supply is tradable for a bounce without the need to wait for confirmation. However, we would strongly advise moving stops to breakeven once price has touched base with 1.33, since this level may very well act as support!
Data points to consider today: CAD Trade balance at 1.30pm.
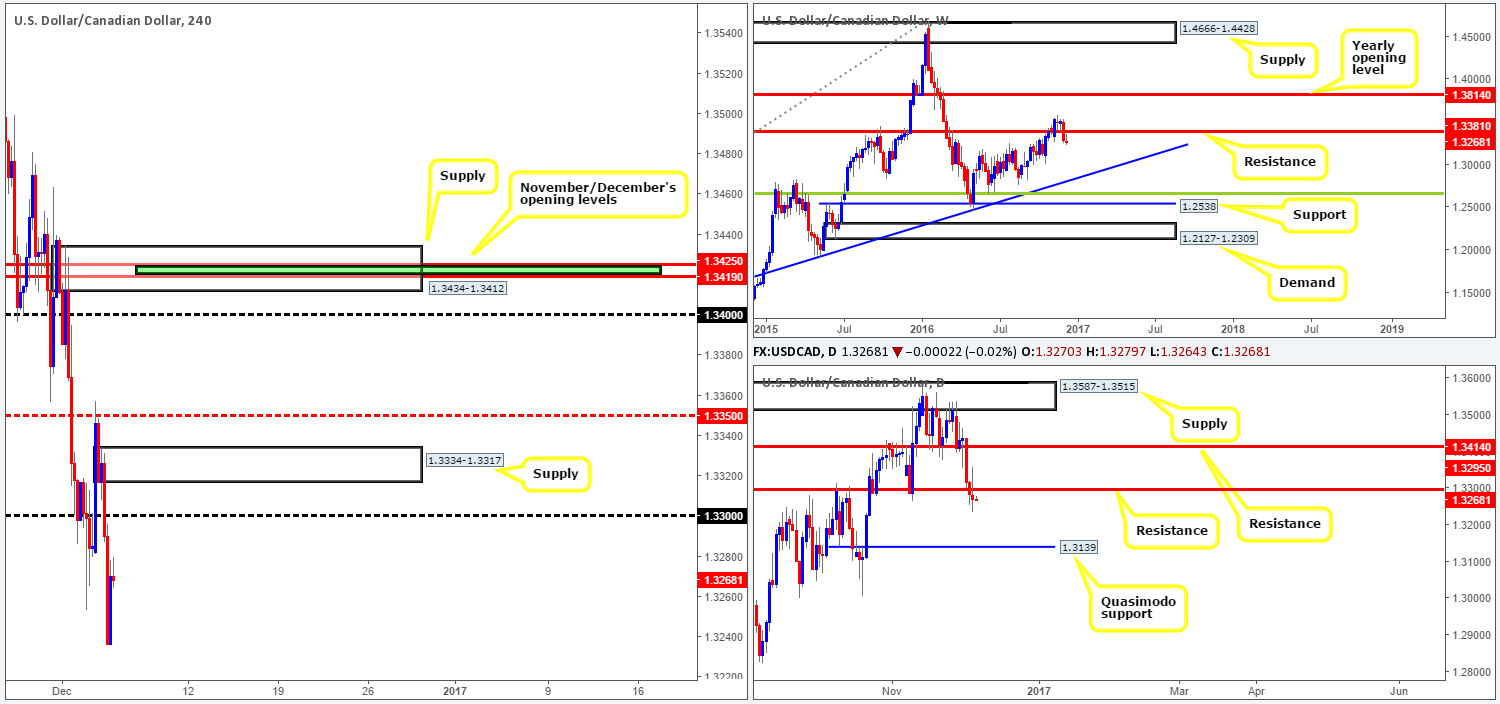
Levels to watch/live orders:
- Buys: Flat (stop loss: N/A).
- Sells: 1.3334-1.3317 ([shorts at market here are a possibility] stop loss: 1.3336).
USD/CHF:
After a brief opening rally, the USD/CHF spent the best part of yesterday fading from December’s opening level at 1.0170 (a level that was noted to watch for shorts in our previous report). US Services PMI provided brief support during this downside move, but failed to register any noteworthy movement. As can be seen from the H4 chart, the day ended closing below support at 1.0076 (now an acting resistance barrier) and potentially opened up the path south for prices to challenge demand seen at 0.9994-1.0019, which holds parity.
While the above H4 demand is a reasonable downside target, there are hidden dangers here! Over on the weekly chart, the next support target comes in a little higher at 1.0029: the 2016 yearly opening level, while down on the daily chart there’s a broken Quasimodo line sitting just above here at 1.0037.
Our suggestions: Should one be looking to short from the current H4 resistance barrier today, price is likely to tag the aforementioned H4 demand. However, remain vigilant to the fact that prices could possibly turn at the higher-timeframe targets before reaching this area! For our desk, this is not a trade we would feel comfortable taking, despite weekly price recently rebounding from a resistance area at 1.0239-1.0131. The higher-timeframe supports are located just too close for our liking!
Data points to consider today: There’s relatively little high-impacting data on the docket today for both the USD and CHF markets.
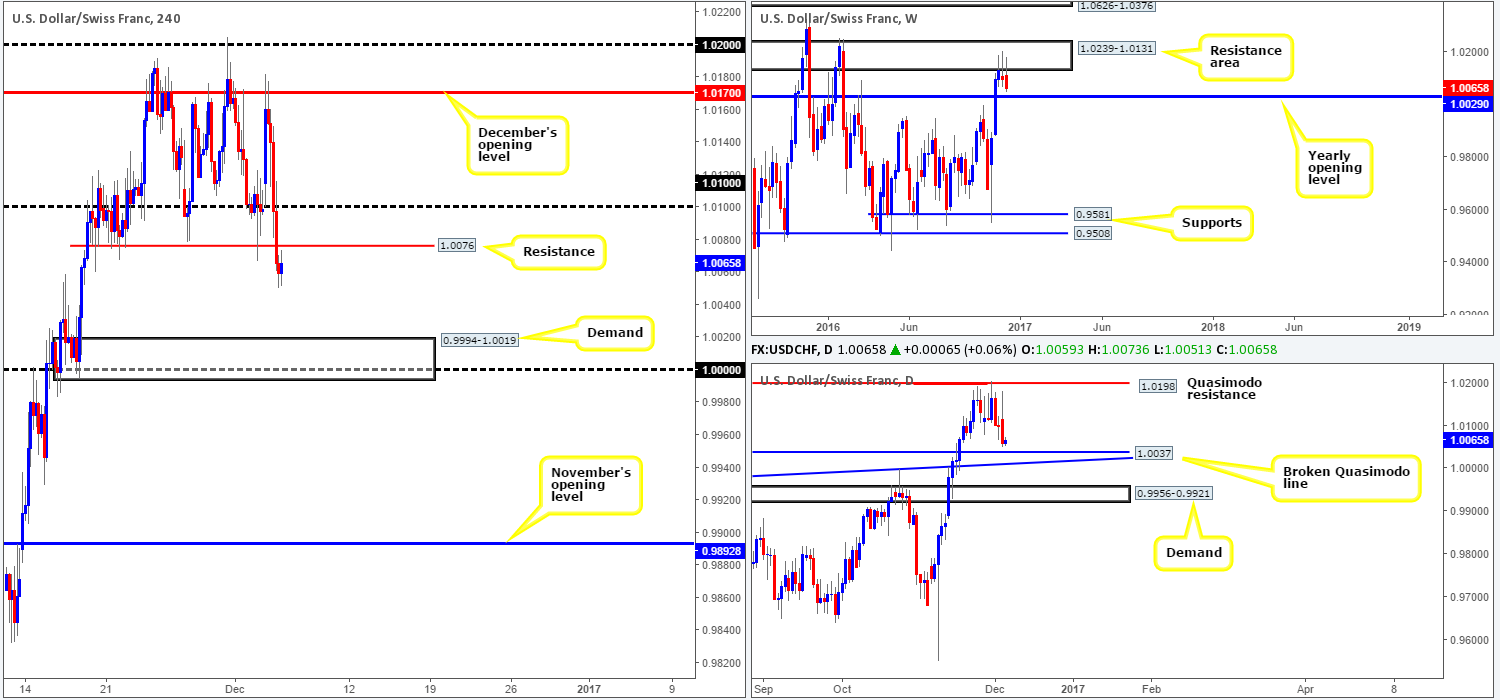
Levels to watch/live orders:
- Buys: Flat (stop loss: N/A).
- Sells: Flat (stop loss: N/A).
DOW 30:
Equities aggressively pushed higher from the top edge of a H4 demand area at 19107-19125 an hour or so before London opened its doors for business yesterday. The move easily reclaimed earlier losses brought on by the Italian referendum, and even went on to clock fresh highs of 19284.The H4 candles, as you can see, recently found a pocket of bids off the minor H4 trendline support extended from the high 19222. Whether this line continues to hold firm is difficult to tell, since just beneath here sits December’s opening level at 19151.
Both the weekly and daily charts show absolutely no reason why this uptrend will not continue, as there’s yet to be a decisive break of significant support. Therefore, the team remains biased to the upside for now.
Our suggestions: Both the current H4 trendline support and December’s opening level are somewhere price may bounce from today. As such, we will be keeping a close eye on both barriers for possible long opportunities today, preferably using a lower timeframe confirming setup for entry.
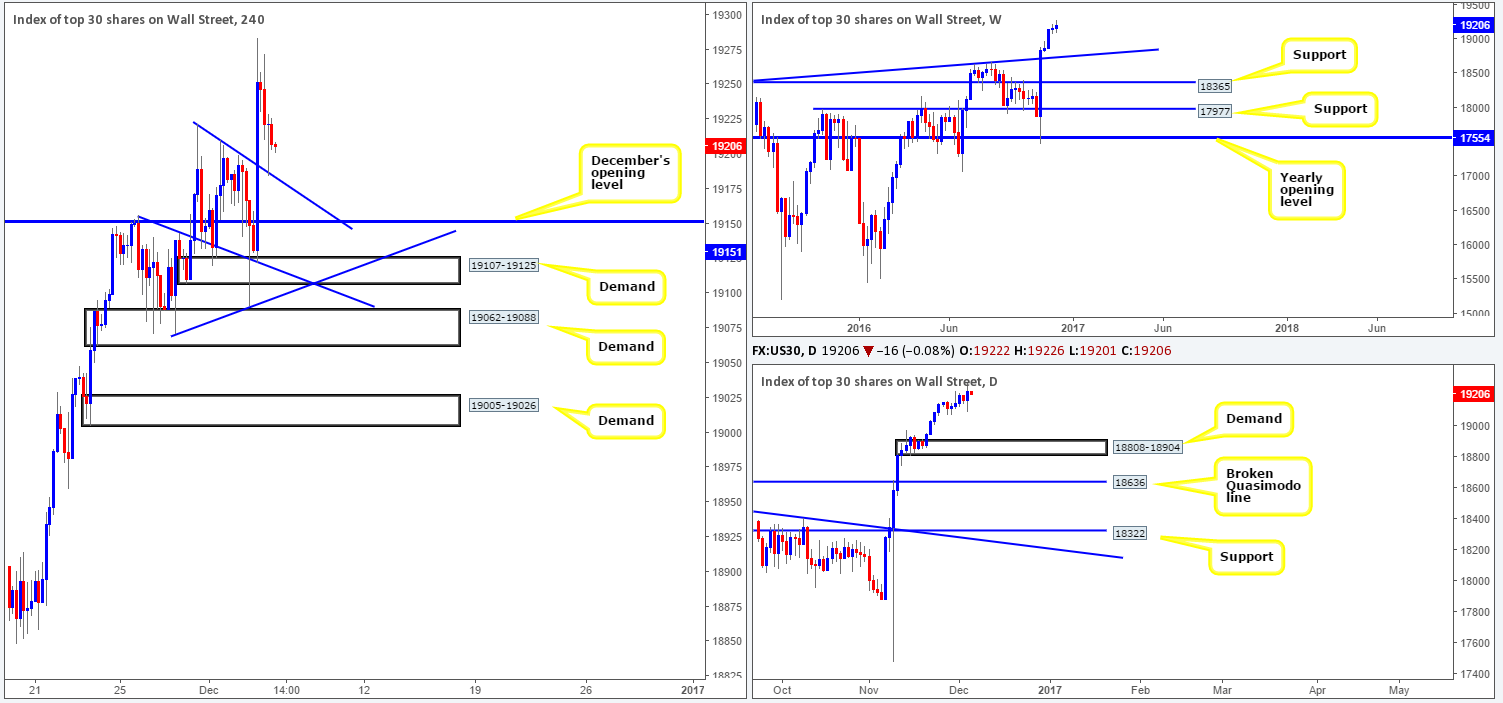
Levels to watch/live orders:
- Buys: H4 trendline support (19222 [waiting for lower timeframe confirming action is preferred] stop loss: dependent on where one confirms the area).19151 ([waiting for lower timeframe confirming action is preferred] stop loss: dependent on where one confirms the area).
- Sells: Flat (stop loss: N/A).
GOLD:
Since the beginning of the month, the yellow metal has been seen trading within the walls of a H4 consolidation fixed at 1161.9-1177.8. As we hope is clearly demonstrated on the H4 chart, the top edge of this consolidation is bolstered by a H4 resistance area drawn from 1178.5-1182.4, while a break to the downside likely clears the path south for price to test H4 demand at 1145.1-1150.9. Now, considering that the weekly candles remain beneath the resistance area at 1205.6-1181.3, there’s a chance we may see a continuation move south in the near future. However, to confirm bearish strength from the current weekly resistance area, a daily close below daily support at 1169.8 would be ideal. This close would likely open up a void down to 1108.2-1117.8: a daily demand.
Our suggestions: Based on the above points, our team is looking for a H4 close to be seen beyond the current H4 consolidation. Should this come into view and be followed up with a retest to the underside of this area as resistance along with a reasonably sized H4 bearish candle, our team would look to short, targeting the H4 demand mentioned above at 1145.1-1150.9 as our immediate take-profit zone.
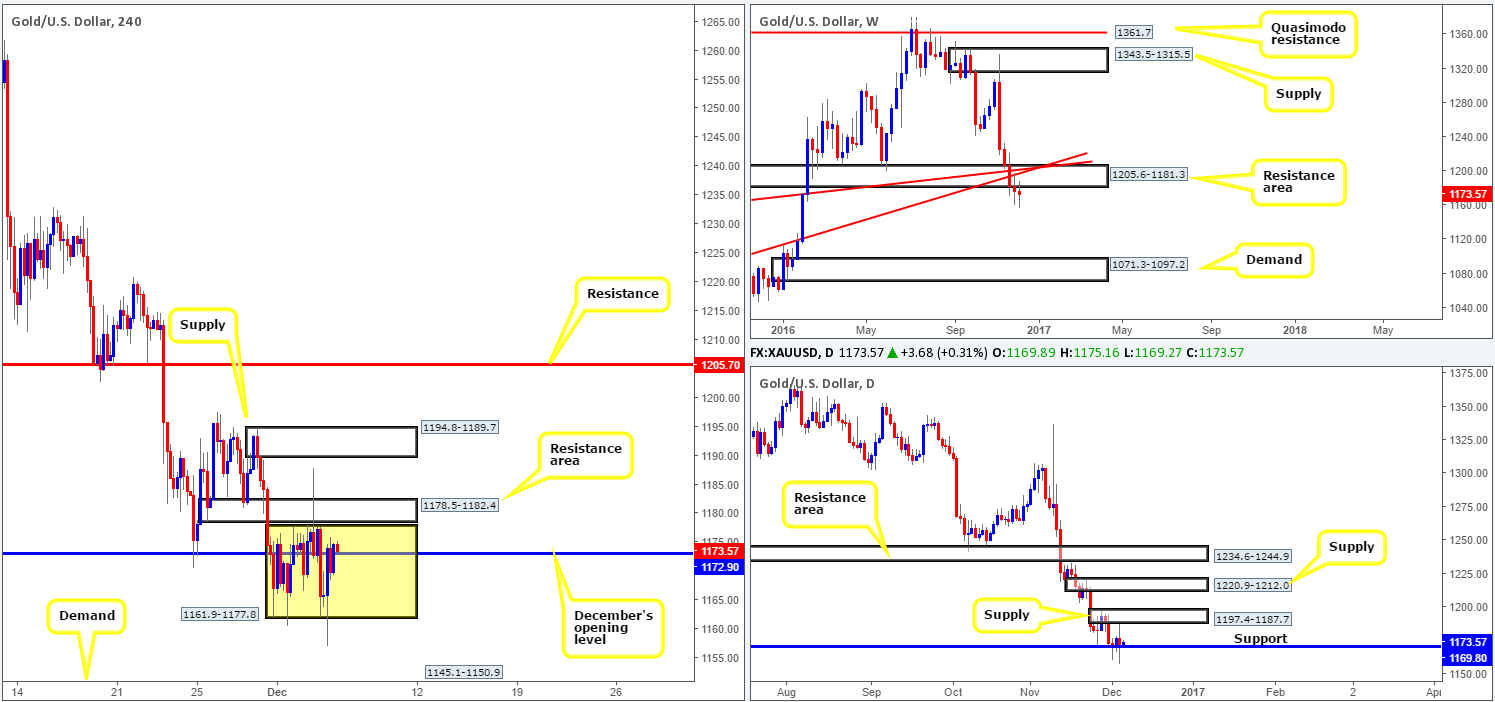
Levels to watch/live orders:
- Buys: Flat (stop loss: N/A).
- Sells: Watch for a H4 close to form below the current H4 consolidation zone at 1161.9-1177.8 and then look to trade any retest seen thereafter ([H4 bearish candle close required following the retest] stop loss: ideally beyond the trigger candle).


