A note on lower timeframe confirming price action…
Waiting for lower timeframe confirmation is our main tool to confirm strength within higher timeframe zones, and has really been the key to our trading success. It takes a little time to understand the subtle nuances, however, as each trade is never the same, but once you master the rhythm so to speak, you will be saved from countless unnecessary losing trades. The following is a list of what we look for:
- A break/retest of supply or demand dependent on which way you’re trading.
- A trendline break/retest.
- Buying/selling tails/wicks – essentially we look for a cluster of very obvious spikes off of lower timeframe support and resistance levels within the higher timeframe zone.
- Candlestick patterns. We tend to only stick with pin bars and engulfing bars as these have proven to be the most effective.
We search for lower timeframe confirmation between the M15 and H1 timeframes, since most of our higher-timeframe areas begin with the H4. Stops are usually placed 5-10 pips beyond confirming structures.
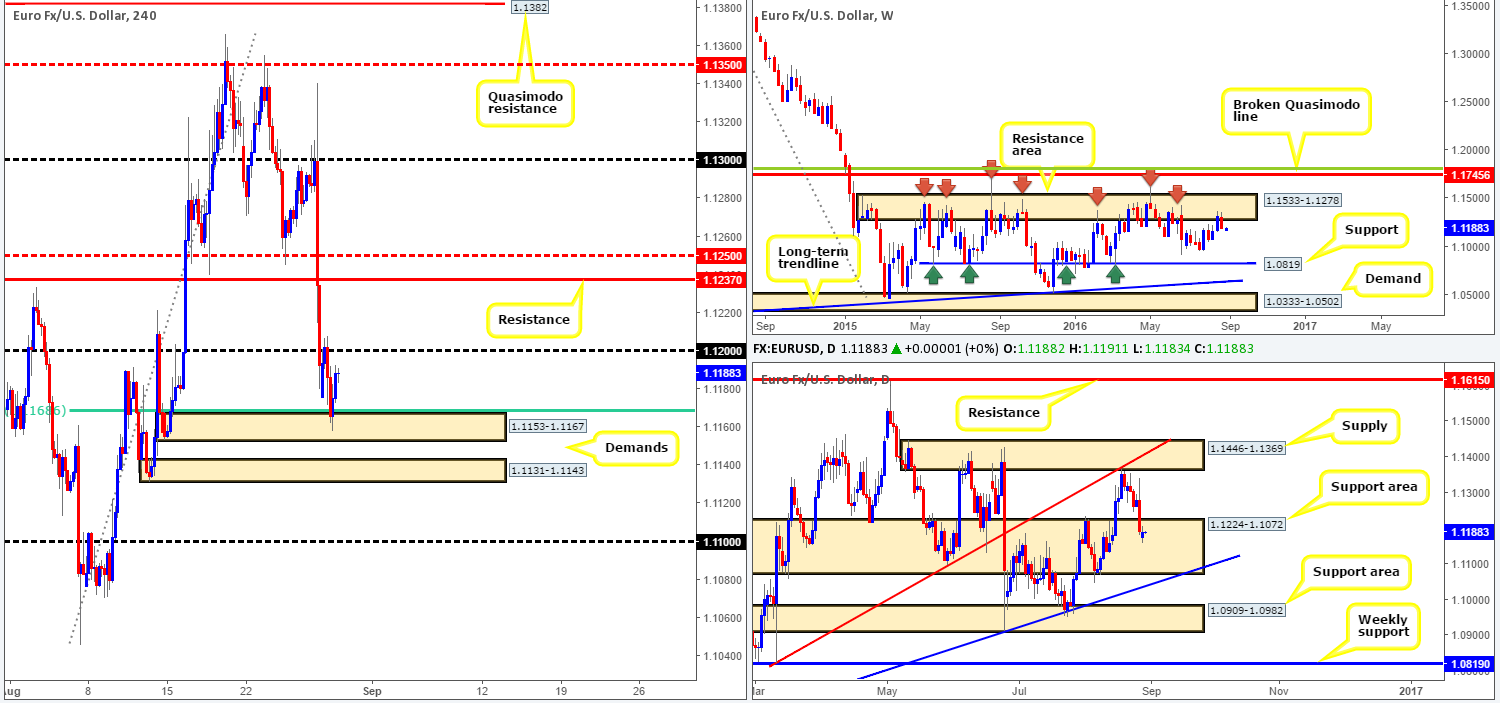
EUR/USD:
After dropping sharply on Friday on the back of Yellen’s comments, the pair attracted fresh buyers around a H4 demand zone drawn from 1.1153-1.1167 (merges with a H4 61.8% Fib level at 1.1168) going into yesterday’s US session. The bounce from here was not only backed by a daily support area at 1.1224-1.1072, but also a H4 resistance at 95.83 seen over on the US dollar index. A decisive close above the 1.12 handle would, in our opinion, further confirm upside towards the H4 resistance seen at 1.1237/H4 mid-way resistance 1.1250. Nevertheless, although a close higher would likely prompt further buying, let’s not forget that the weekly chart shows that price reversed from the underside of a major resistance area at 1.1533-1.1278 last week.
Our suggestions: Despite the weekly picture (see above), a long trade above 1.12 is still feasible. However, we’d advise waiting for price to retest 1.12 as support followed by a lower timeframe buy signal (see the top of this report). Furthermore, we’d also recommend taking 50% off the table around the H4 resistance mentioned above at 1.1237 and reducing risk to breakeven.
In regard to shorting this market, this would only be possible, at least for us, on a close below the H4 demand at 1.1131-1.1143, targeting the 1.11 handle as your immediate first take-profit target.
Levels to watch/live orders:
- Buys: Watch for price to close above the 1.12 handle and then look to trade any retest seen thereafter (lower timeframe confirmation required).
- Sells: Watch for price to close below the H4 demand at 1.1131-1.1143 and then look to trade any retest seen thereafter (lower timeframe confirmation required).
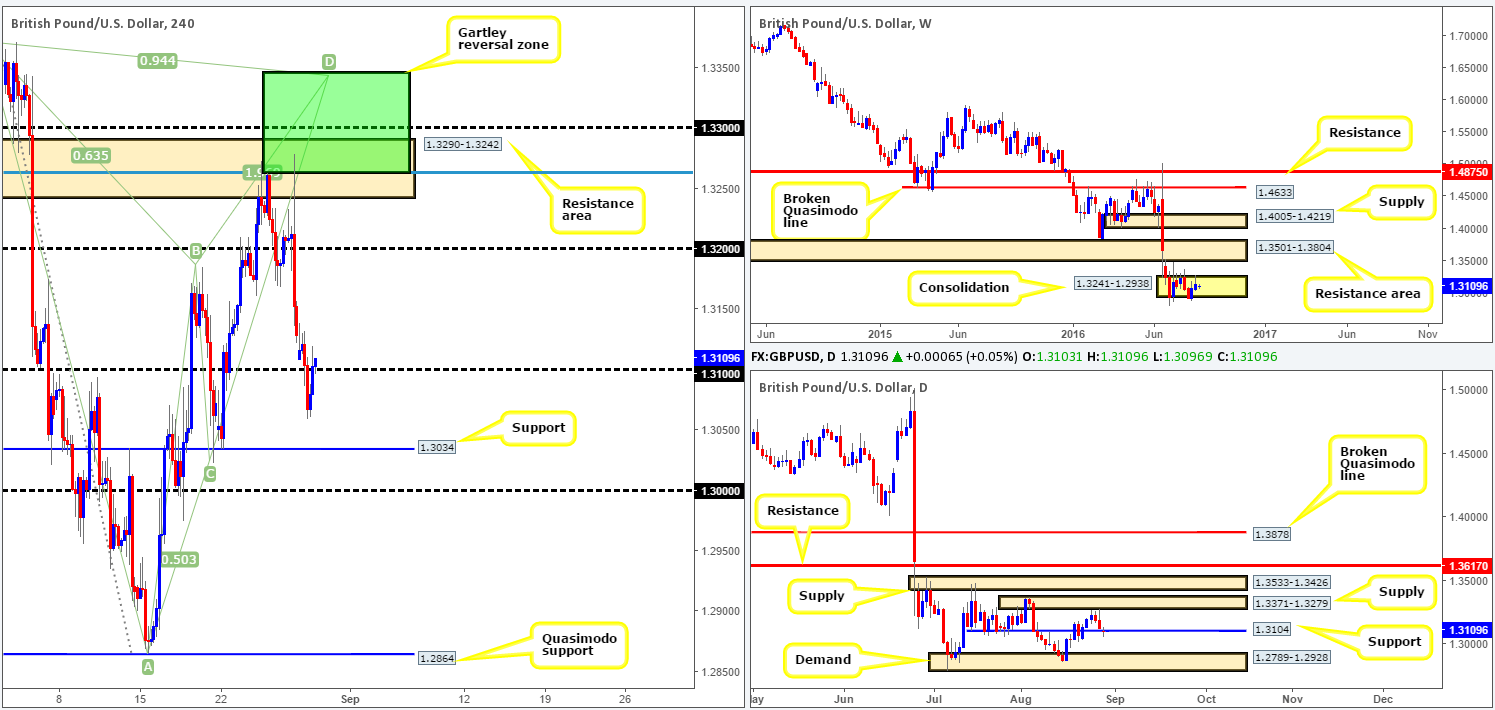
GBP/USD:
Sterling closed lower for a third consecutive day yesterday, managing to clock lows of 1.3059 on the day. Very similar to the EUR/USD, however, price bottomed out during the US open around the 1.3066ish range and rallied back up to the 1.31 neighborhood into the day’s close.
With the above in mind, how do things stand on the higher-timeframe picture? Well, since early July cable entered into a phase of weekly consolidation between 1.3241-1.2938. Meanwhile, down on the daily chart, the buyers and sellers are seen battling for position around a support line registered at 1.3104.
Our suggestions: 1.31 is key today guys! Should a DECISIVE close be seen above or below this number, this will likely indicate short-term direction. A close above 1.31, followed by a retest and a lower timeframe buy signal (see the top of this report) would likely achieve the 1.32 area. Conversely, a close below 1.31, followed by a retest and a lower timeframe sell signal has the H4 support level at 1.3034 to target along with the key figure sitting just below at 1.30.
Levels to watch/live orders:
- Buys: Watch for price to close above the 1.31 handle and then look to trade any retest seen thereafter (lower timeframe confirmation required).
- Sells: Watch for price to close below the 1.31 handle and then look to trade any retest seen thereafter (lower timeframe confirmation required).
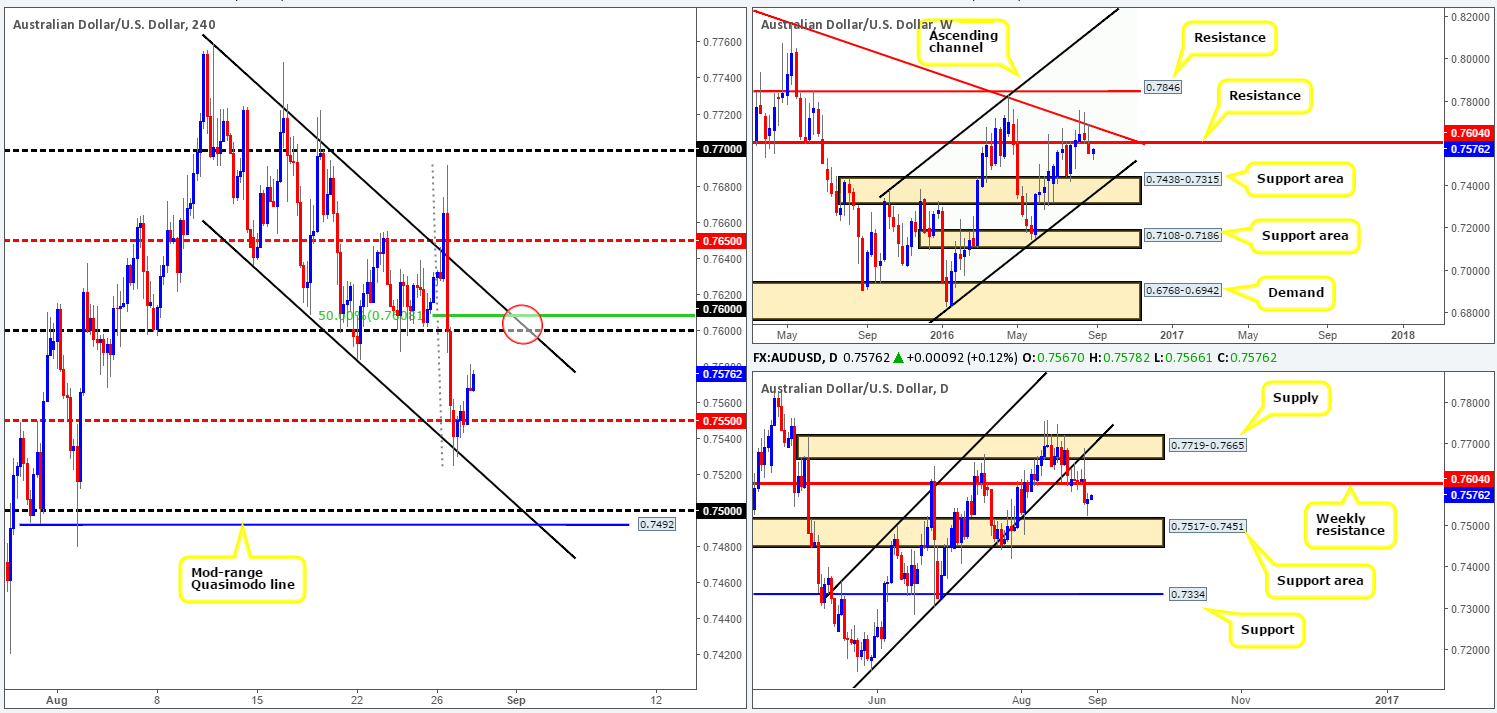
AUD/USD:
As expected, yesterday’s action posted a modest recovery from the H4 channel support line extended from the low 0.7636, and has so far managed to reach highs of 0.7575. In the event that the Aussie continues to climb higher today, the 0.76 region is likely to be placed in the spotlight. From a technical standpoint, there is a high probability that price will bounce lower from this number. Here’s why:
- 0.76 merges beautifully with a weekly resistance level coming in at 0.7604.
- H4 channel resistance taken from the high 0.7759 also fuses nicely with the 0.76 line.
- And finally, we have a H4 50.0% Fib resistance at 0.7608 supporting the psychological band.
Our suggestions: Given the above points, we’re ultimately looking for price to tag the 0.76 level around the region marked with a red circle. Should this come to fruition, we’d short the market with a stop placed at 0.7615, targeting the H4 mid-way support 0.7550 as a first take-profit area.
Levels to watch/live orders:
- Buys: Flat (Stop loss: N/A).
- Sells: Looking to sell 0.76 with a stop placed at 0.7615.
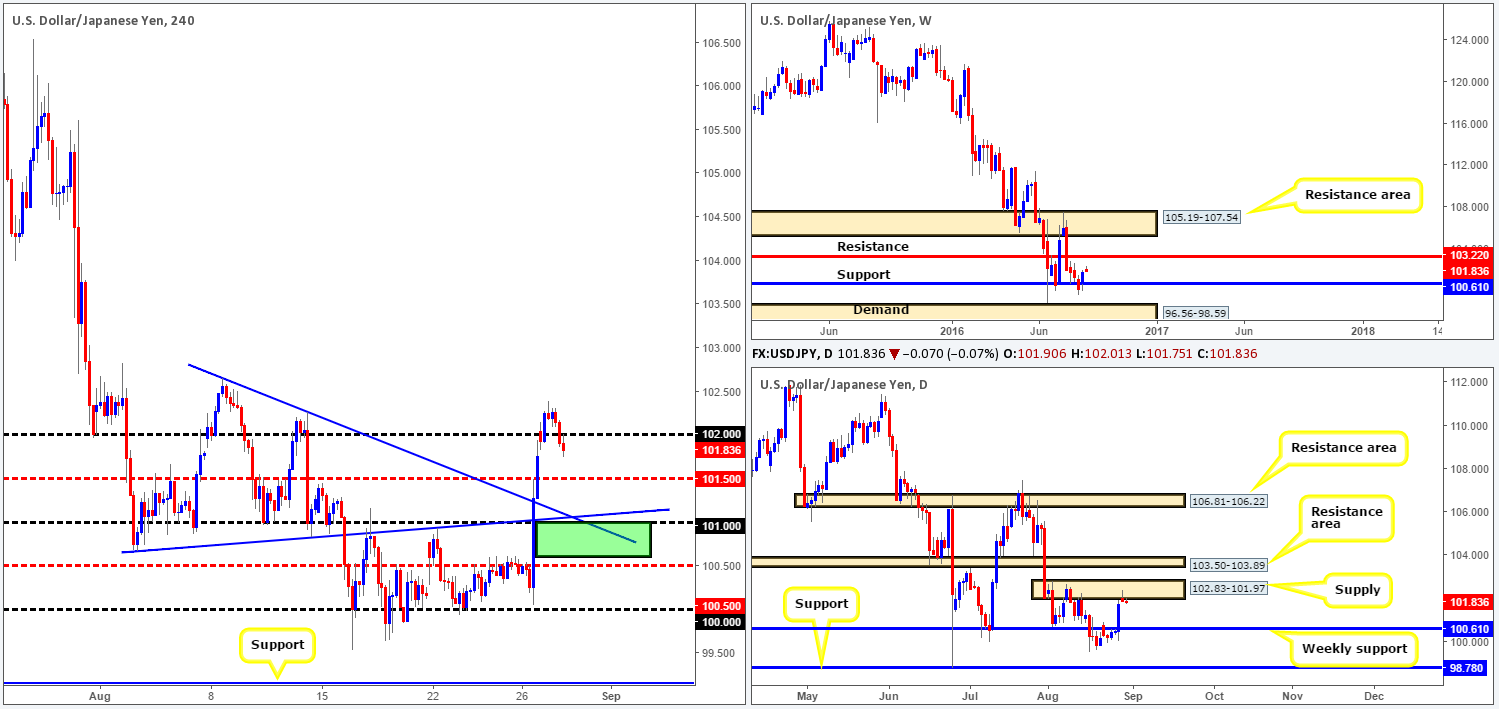
USD/JPY:
Following the week’s open, the USD/JPY was bid above the 102 handle. However, as you can see, the buyers were unable to sustain gains above this number, with price seen topping out around the 102.25 region and eventually closing back below the 102 handle by the day’s close. Technically, the reason for this was likely due to price crossing swords with a daily supply zone coming in at 102.83-101.97, which could potentially push the pair back down to the weekly support level seen at 100.61.
As of now, we see very little opportunity to short this market unless price retraces and retests 102 as resistance. In the event that prices continue to weaken, however, and the H4 mid-way support 101.50 is taken out, the 101 handle along with the weekly support level at 100.61 is an interesting area to look for longs (green zone). Although this area is also bolstered with two H4 trendline supports (102.65/100.67), one still needs to factor in that this instrument is currently in a rather strong downtrend right now (seen clearly on the weekly chart).
Our suggestions: Watch 102 to be retested as resistance. To avoid the dreaded fakeout that is so common around psychological numbers, we’d advise waiting for lower timeframe confirmation before pulling the trigger (see the top of this report). In regard to buying from the above noted 100.61/101 region, we would still advise waiting for a lower timeframe buy signal to form before entering into a buy trade here, simply because you are buying against the predominant trend!
Levels to watch/live orders:
- Buys: 100.61/101 region [Tentative – confirmation required] (Stop loss: dependent on where one confirms this area).
- Sells: 102 region [Tentative – confirmation required] (Stop loss: dependent on where one confirms this area).
USD/CAD:
Shortly after the market opened, we can see that the USD/CAD closed above the key figure 1.30 and quickly retested the number as support. Despite price topping out around the 1.3030 region, price still remains afloat above the 1.30 mark. In light of weekly action now nibbling at the underside of a supply zone drawn from 1.3295-1.3017 and daily price seen trading around resistance at 1.3001, 1.30 may be on the verge of giving way!
Our suggestions: In view of the above points, we see two possible outcomes here:
- Wait and see if price closes below the 1.30 figure today. Should this come into view, it’s likely that the H4 mid-way support 1.2950 will be the next target on the hit list. To trade this move, a retest to the underside of 1.30 is preferable followed by a lower timeframe sell signal (see the top of this report).
- Assuming that 1.30 holds firm today, it’s possible that we may see price bounce up to H4 supply penciled in at 1.3079-1.3065. Given how fresh this area is and its connection with both the H4 61.8% Fib resistance at 1.3067 and the aforementioned higher-timeframe areas, we would short from here at market with a stop placed above the H4 zone at 1.3087.
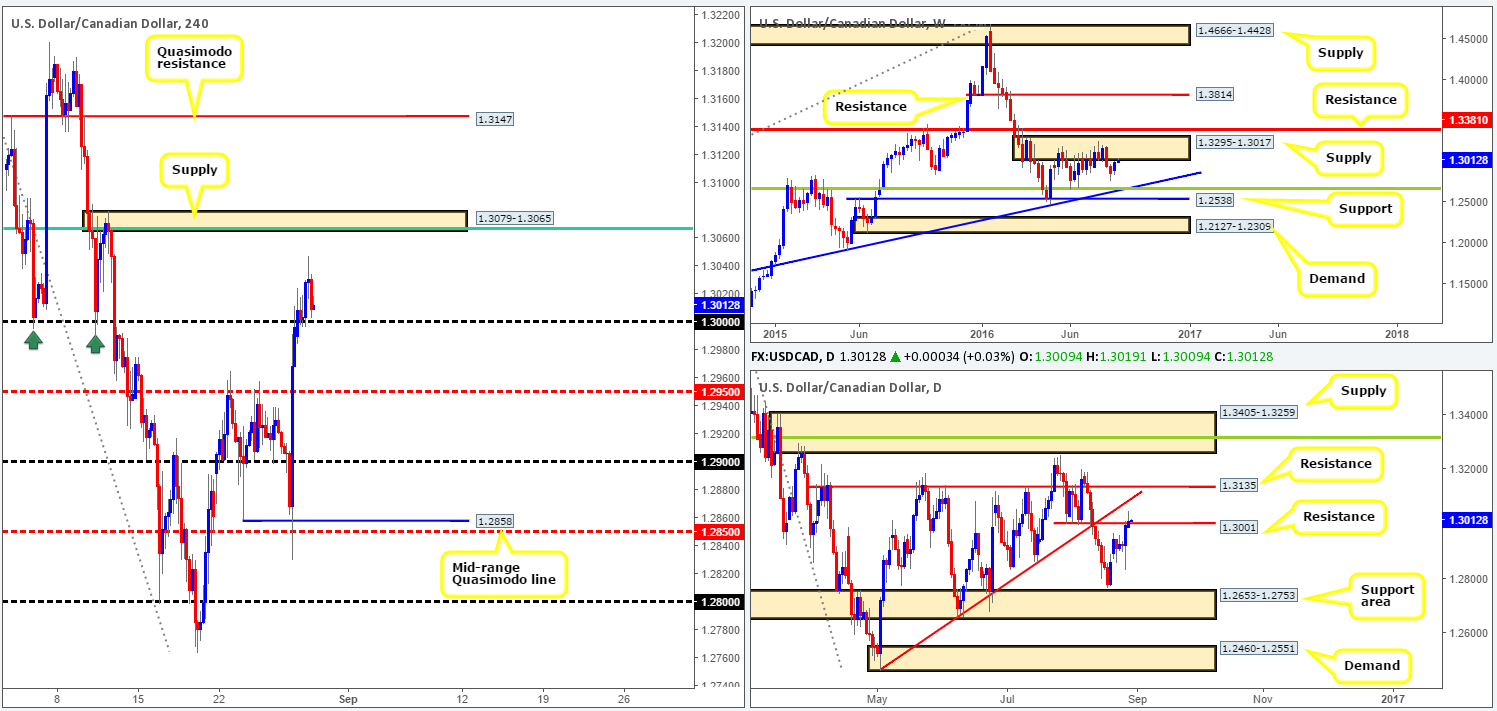
Levels to watch/live orders
- Buys: Flat (Stop loss: N/A).
- Sells: 1.3063 (Market short] (Stop loss: 1.3087). Watch for price to close below the 1.30 handle and then look to trade any retest seen thereafter (lower timeframe confirmation required).
USD/CHF:
Going into yesterday’s US session, the Swissy found a pocket of offers around the 0.98 band and managed to clock lows of 0.9767 on the day. The reaction from this number should not have come as much of a surprise, seeing as how over on the daily chart the buyers and sellers are seen battling for position around a resistance zone coming in at 0.9819-0.9784. However, for us to be convinced that the pair wants lower prices from here, the H4 support at 0.9762 would need to be taken out, which would likely open up the path south down to the 0.97/0.9710 region (represents the top edge of a daily support area: the next downside target on the daily timeframe). Despite this, there is a chance that we may see 0.98 breached today, due to weekly action showing room to appreciate up to the underside of a supply zone at 1.0092-0.9928.
Our suggestions: Although a breach of 0.98 could possibly indicate further buying, we would not really feel comfortable entering long above here given that price would still be enclosed within he above said daily resistance area. On the flip side, a close below the current H4 support level followed by a retest and a lower timeframe signal (see the top of this report) would, in our book, be enough to condone a short entry into this market, targeting the 0.97/0.9710 band.
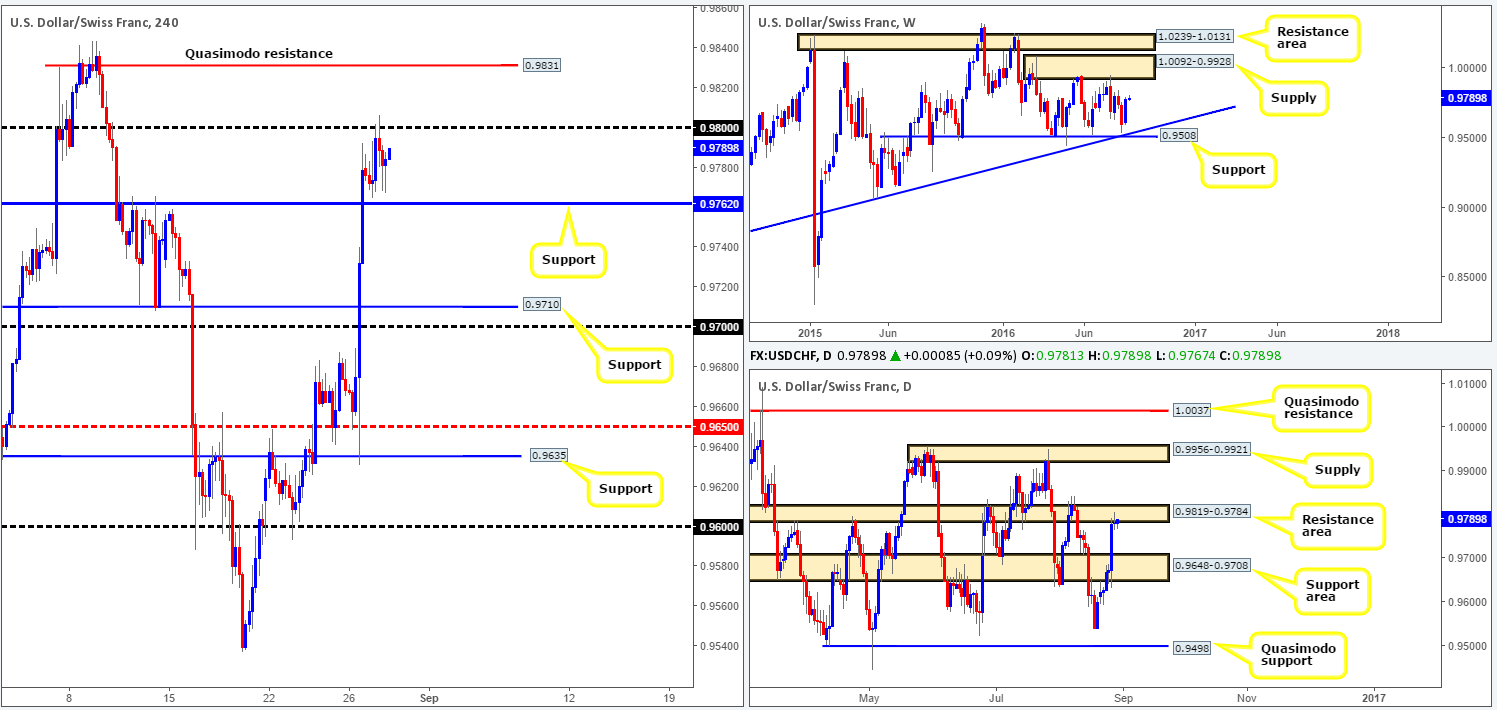
Levels to watch/live orders:
- Buys: Flat (Stop loss: N/A).
- Sells: Watch for price to close below the H4 support 0.9762 and then look to trade any retest seen thereafter (lower timeframe confirmation required).
DOW 30:
Beginning with a look at the weekly chart this morning, we can see that price has rotated beautifully from the top edge of the support area carved in at 18365-18158. In conjunction with this, down on the daily chart price recently closed back above a minor resistance line at 18480. With higher-timeframe structures showing that this index may want to climb higher, let’s step across to the H4 chart to see if we can go about nailing down an entry point.
In view of price closing above H4 resistance at 18482, a retest of this level could provide a stable platform in which to look for buying opportunities today. Apart from the supporting higher-timeframe structures (see above), there’s a clear H4 consumption wick seen marked with a black arrow at 18574 (caused by Yellen’s speech on Friday). This, at least in our opinion, helps clear the pathway north up to at least the H4 Quasimodo resistance at 18599.
Our suggestions: Watch for price to retest the H4 support at 18482 and look to buy, targeting the above noted H4 Quasimodo resistance level. Now, we would not advise placing a pending order at this level and simply hoping that it holds. Instead, look for a H4 bullish close at this level: a buying tail or an engulfing candle. With this, one is then able to comfortably place stops below the trigger candle.

Levels to watch/live orders:
- Buys: 18482 region (Stop loss: dependent on where one confirms this area).
- Sells: Flat (Stop loss: N/A).
GOLD:
Looking at the H4 chart this morning, we can see that in the early hours of yesterday morning the yellow metal whipsawed below a H4 demand base seen at 1315.6-1319.6. This, as you can see, prompted a modest recovery in the gold market yesterday, following Friday’s sharp decline on the back of Janet Yellen’s comments.
Given last Thursday’s rebound from this H4 demand area, would we consider this second touch to be, despite the small breach, a valid move? Well, it’s difficult to judge since on the one hand price is currently trading from a daily demand area seen at 1305.3-1322.8. However, on the other hand, weekly price shows room to drop down to test a support area painted at 1307.4-1280.0.
Our suggestions: In our estimation, the metal will not likely continue northbound today. Instead, we’ll likely see prices weaken and eventually take out the current H4 demand and tag in bids sitting around the H4 support at 1310.3. This level – coupled with the top edge of the weekly support area at 1307.4 is an incredibly attractive zone for longs. Be that as it may, waiting for the lower timeframes to confirm buying interest resides here before pulling the trigger is something we would advise. Reason being is one can never tell how deep weekly price will dive into the weekly support area, and also there is a chance price may fakeout below our above said buy zone to daily support located at 1301.5.
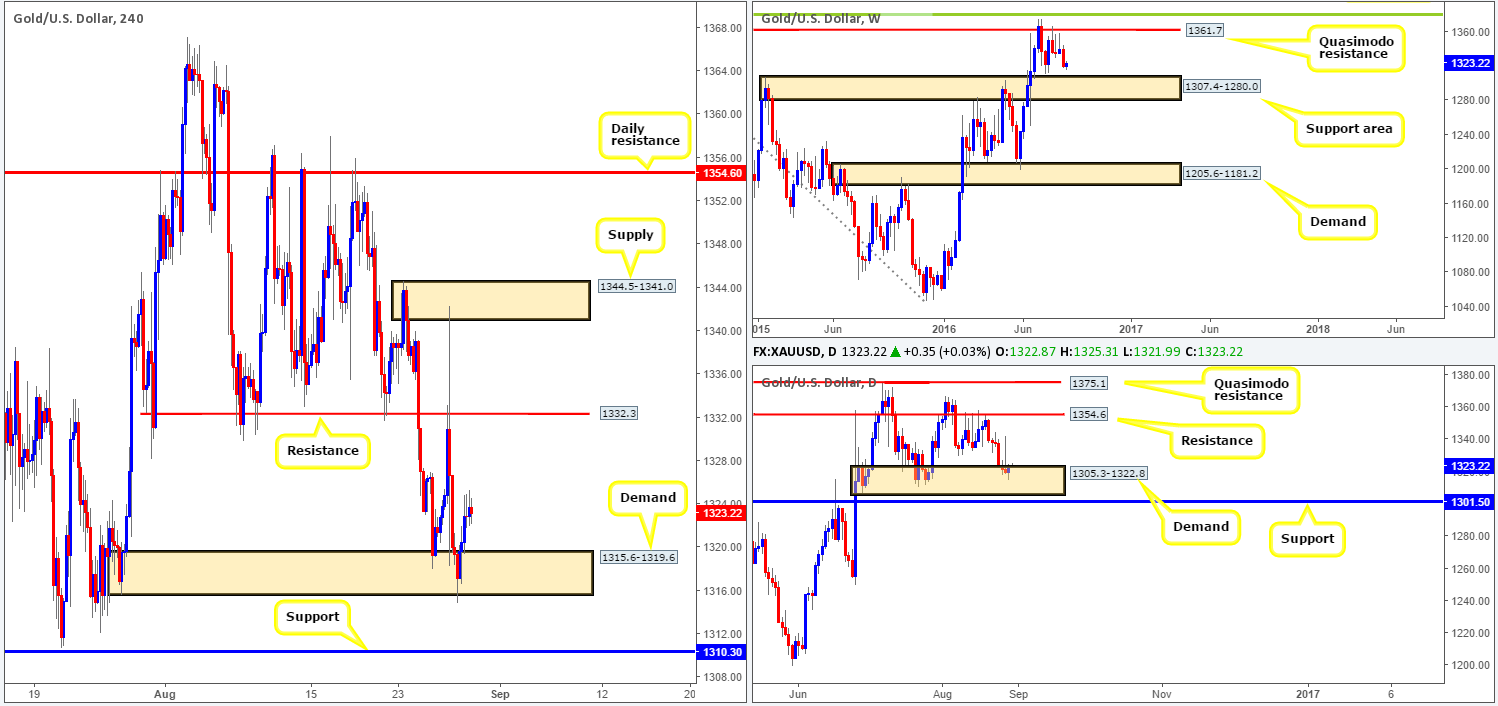
Levels to watch/live orders:
- Buys: 1307.4/1310.3 [Tentative – confirmation required] (Stop loss: dependent on where one confirms this area).
- Sells: Flat (Stop loss: N/A).


