Waiting for lower timeframe confirmation is our main tool to confirm strength within higher timeframe zones, and has really been the key to our trading success. It takes a little time to understand the subtle nuances, however, as each trade is never the same, but once you master the rhythm so to speak, you will be saved from countless unnecessary losing trades. The following is a list of what we look for:
- A break/retest of supply or demand dependent on which way you’re trading.
- A trendline break/retest.
- Buying/selling tails/wicks – essentially we look for a cluster of very obvious spikes off of lower timeframe support and resistance levels within the higher timeframe zone.
- Candlestick patterns. We tend to stick with pin bars and engulfing bars as these have proven to be the most effective.
We typically search for lower-timeframe confirmation between the M15 and H1 timeframes, since most of our higher-timeframe areas begin with the H4. Stops are usually placed 3-5 pips beyond confirming structures.
EUR/USD:
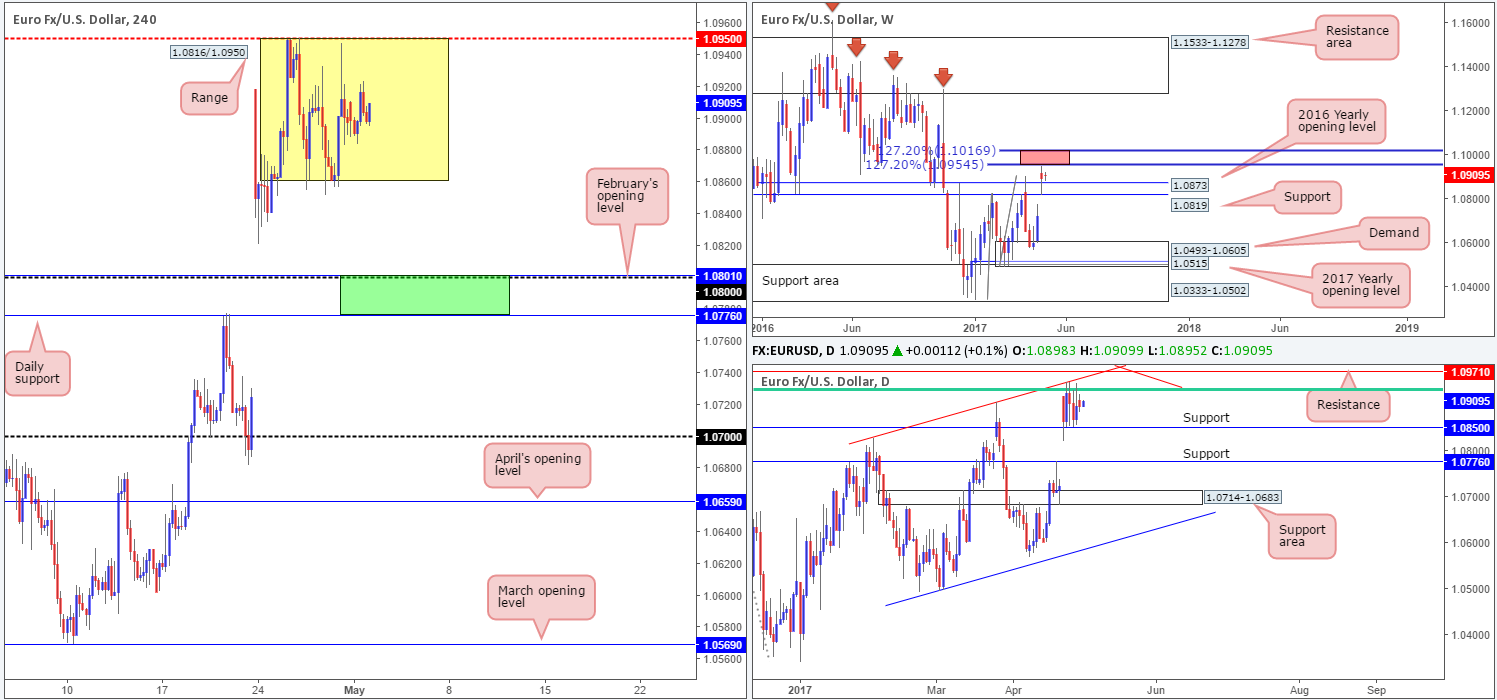
As anticipated, trading volume was thin during the yesterday’s segment, with the pair ranging a mere forty pips on the day. Europe’s banks were closed in observance of Labor Day as were the UK’s banks due to May Day. Because of this, the EUR is effectively unchanged this morning. Therefore, much of the following report will echo thoughts put forward in yesterday’s analysis…
The H4 chart shows that the unit has recently entered into the phase of a consolidation between 1.0861/1.0950. Momentum, nevertheless, has been firmly positioned to the upside since early April so a lot of traders will likely have their eye on buying the breakout of this range. Though, with a daily resistance seen lurking just above at 1.0971 coupled with a weekly 127.2% Fib extension at 1.0954 (taken from the lows 1.0340), this could very well end in tears!
Our suggestions: Based on the above notes, we see two possible scenarios:
- Watch for price to breakout above 1.0950, and assess H4 candle action. In the event that a solid (bearish) rejection candle is seen, preferably a full-bodied candle, then not only is a move back into the H4 consolidation possible, but a trade short on the back of this is as well.
- Assuming that the bears do take over this week, longs could be an option from 1.0776/1.0801. Why here? This green area is comprised of a daily support at 1.0776, a round number at 1.08 and February’s opening level at 1.0801. Ultimately though, before considering a trade from this region we’d like to see some form of bullish rotation emerge from here (a reasonably sized full-bodied candle would be ideal).
Data points to consider: No high-impacting new events.
Levels to watch/live orders:
- Buys: 1.0776/1.08 ([waiting for a reasonably sized H4 bull candle to form before pulling the trigger is advised] stop loss: ideally beyond the candle’s tail).
- Sells: Trading any fakeout seen beyond 1.0950 is a possibility (should a full-bodied rejection candle be seen). Stops would ideally be placed beyond daily resistance at 1.0971.
GBP/USD:
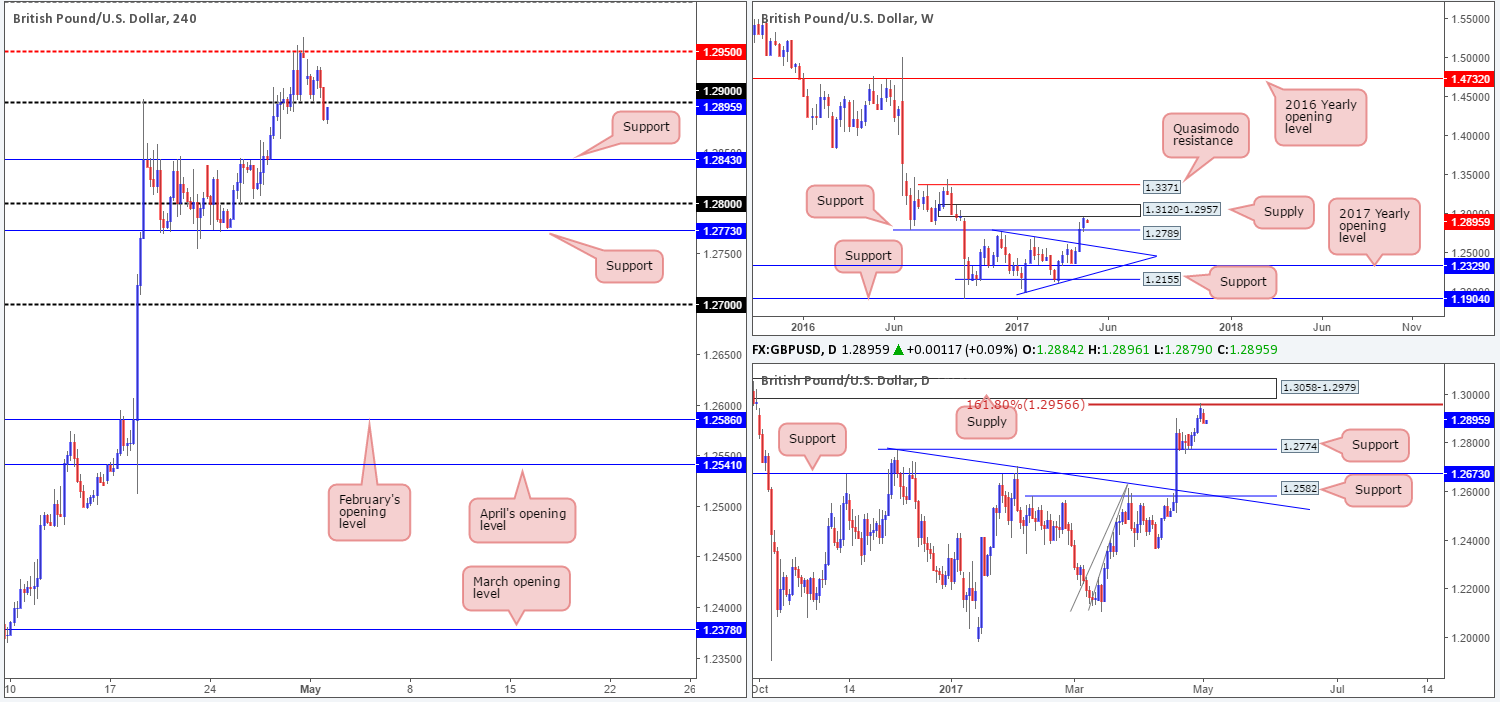
In recent trading, the GBP elbowed its way through the 1.29 neighborhood and ended the day chalking up a full-bodied bearish candle. This – coupled with weekly price recently touching gloves with supply at 1.3120-1.2957, and daily movement checking in with a 161.8% Fib extension at 1.2956 (drawn from the low 1.2108), could see H4 price shake hands with support at 1.2843/61.8% Fib support at 1.2835 (taken from the low 1.2754) sometime today. To take advantage of this potential move south, we’d be looking for a retest of 1.29 to hold firm as resistance.
Our suggestions: Should H4 price retest 1.29 today and pencil in a reasonably sized H4 bearish candle (preferably a full-bodied candle), a short from here is high probability and will likely reach the 1.2843 region, and quite possibly the weekly support mentioned above at 1.2789.
Data points to consider: UK manufacturing PMI figures at 9.30am GMT+1.
Levels to watch/live orders:
- Buys: Flat (stop loss: N/A).
- Sells: 1.29 region ([waiting for a reasonably sized H4 bear candle to form before pulling the trigger is advised] stop loss: ideally beyond the candle’s wick).
AUD/USD:
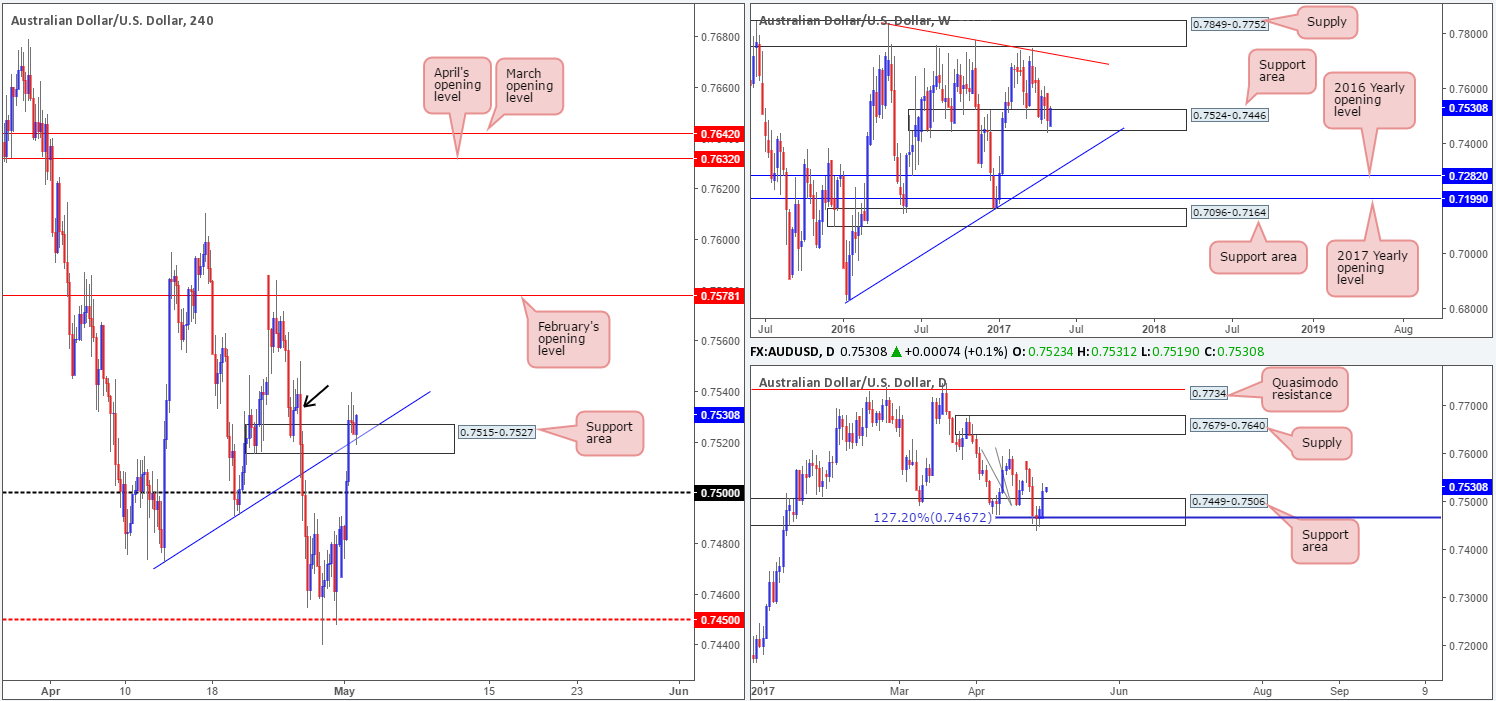
The AUD/USD, as you can see, began the day on a strong footing, printing a near-full-bodied bullish candle. Shortly after (the London open), the 0.75 handle was easily cleared which allowed the unit to smash through both a H4 resistance area at 0.7515-0.7527 and a H4 trendline resistance extended from the low 0.7472.
With both of these structures now seen offering support, and the nearby H4 supply seen marked with a black arrow at the 0.7537ish range (most likely) consumed by yesterday’s high 0.7540, further buying could be on the cards today. Adding to this rationale is that weekly bulls remain trading from within a support area at 0.7524-0.7446, as do the daily bulls from a support zone logged at 0.7449-0.7506 (also bolstered by a AB=CD 127.2% Fib extension at 0.7467 taken from the high 0.7610).
Our suggestions: Should the current H4 candle close as is seen on the chart, our team would have no hesitation in buying here and targeting February’s opening level at 0.7581.Ultimately, what we’re looking for a sign that bulls are interested, and a near-full-bodied bullish candle would do just that.
Data points to consider: Chinese Manufacturing PMI at 2.45am, followed by the RBA meeting at 5.30am GMT+1.
Levels to watch/live orders:
- Buys: Currently hunting for longs out of the H4 support area at 0.7515-0.7527 ([waiting for a reasonably sized H4 bull candle to form before pulling the trigger is advised] stop loss: ideally beyond the candle’s tail).
- Sells: Flat (stop loss: N/A).
USD/JPY:
Beginning with a look at the weekly timeframe this morning, we can see the unit remains trading within the jaws of supply coming in at 112.19-111.05. Looking down to the daily candles, the resistance area seen at 111.35-112.37 is still in play. In the event that the bears come into the market here, the next area of interest for us would be the support zone seen at 107.15-107.90, which is joined closely by a 61.8% Fib support at 107.84 taken from the low 101.19. A continuation move to the upside, nevertheless, could set the stage for price to challenge the resistance area at 115.62-114.60.
A brief look at recent dealings on the H4 chart shows that price came within a cat’s whisker of supply seen at 112.19-111.95 (holds the 112 handle within). Given that this area is lodged within the upper limits of the said weekly supply, we feel this H4 zone could be a nice base to consider shorts from.
Our suggestions: Wait for H4 action to strike 112 and hold firm. Should this be seen, we believe a short from here is valid down to at least April’s opening level at 111.41.
Data points to consider: No high-impacting new events.

Levels to watch/live orders:
- Buys: Flat (stop loss: N/A).
- Sells: As long as 112 holds firm when tested, a short from here is valid according to our technicals (stop loss: 112.22).
USD/CAD:
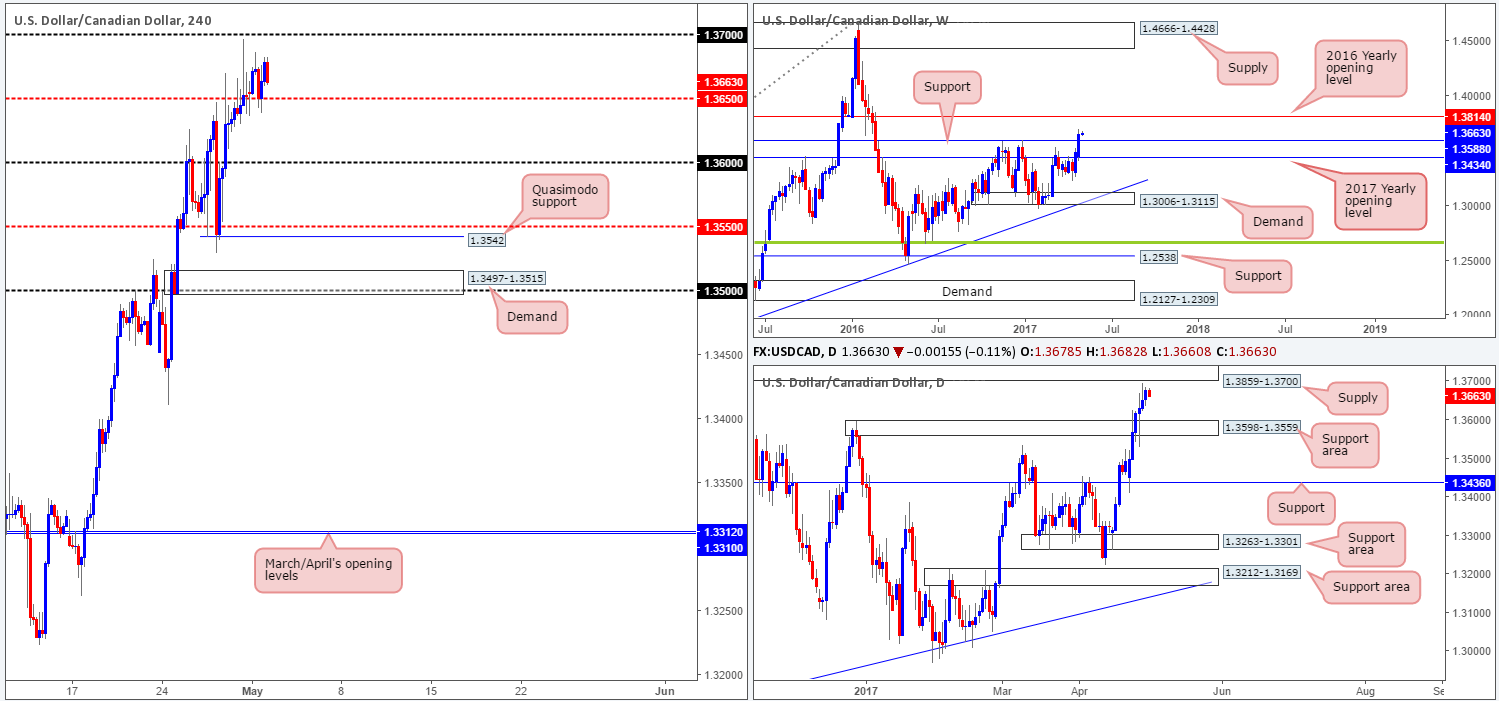
Although the buyers printed a seventh consecutive bullish candle yesterday, our team remains somewhat biased to the downside. To begin with, we have the 1.37 handle lurking just above current price. In addition to this, the 1.37 level represents the underside of a daily supply pegged at 1.3859-1.3700. Also of note is the 2016 yearly opening level at 1.3814 (the next upside target on the weekly scale), which is held within the walls of the above said daily supply area.
Our suggestions: The 1.37 handle remains of interest to our team this week seeing as how it aligns perfectly with the underside of the said daily supply. An intraday short from this level could be something to think about. The reason for not expecting much more of a move from here is simply through fear of weekly price dragging the market higher to the noted 2016 yearly opening level. And this is why we believe the better level for shorts today/this week, albeit quite a way off yet, is the 2016 yearly opening base itself (1.38 region) as it is firmly positioned within the said daily supply, thus allowing the trader to conservatively place stops above this area.
Data points to consider: No high-impacting new events.
Levels to watch/live orders:
- Buys: Flat (stop loss: N/A).
- Sells: 1.37 region ([possible intraday shorts – would not advise placing pending orders – wait for additional lower-timeframe confirming price action – see the top of this report] stop loss: dependent on where one confirms this area). 1.3814/1.38 region is an ideal place for shorts since this area requires no additional confirmation (stop loss: conservative at 1.3861).
USD/CHF:
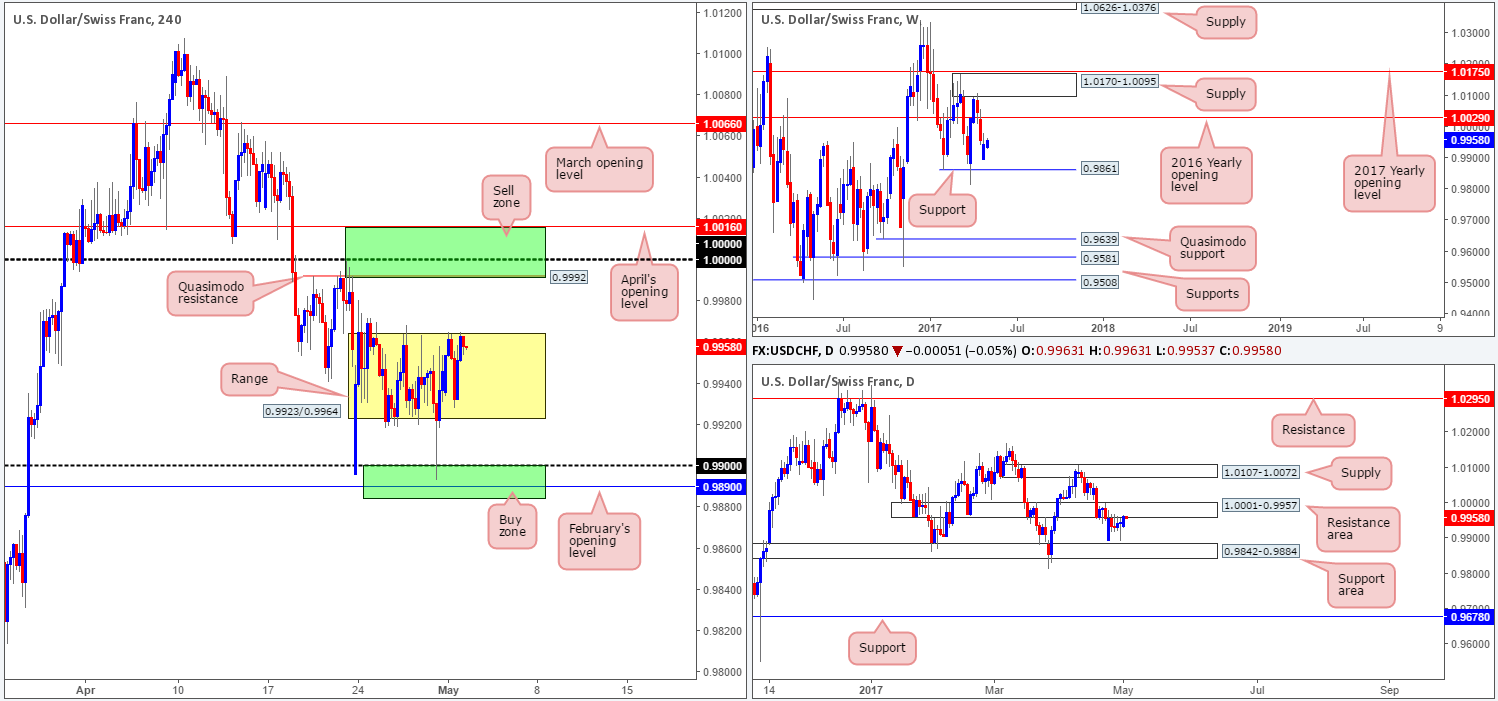
With the Swissy still seen ranging between 0.9923/0.9964 on the H4 chart, much of the following report will be similar to Monday’s analysis…
On the weekly chart, we still have the support level at 0.9861 in our sights. Price came within 30 or so pips of this barrier last week before rotating to the upside. The additional level of interest on this scale is the 2016 yearly opening line forged at 1.0029 that’s located just below a supply zone pegged at 1.0170-1.0095.
Dropping down to the daily chart, we can see that price spent the entire week clinging to the underside of a resistance area at 1.0001-0.9957, and left the nearby support area at 0.9842-0.9884 unchallenged (holds weekly support within). Any sustained move below this support zone would likely place support at 0.9678 in the spotlight. A push above the current resistance area on the other hand could lead to the Swissy attacking the supply zone plotted at 1.0107-1.0072.
Our suggestions: There’s still equal opportunity to trade this pair both long and short today. For shorts, we have the 1.0016/0.9992 region, and for longs the 0.9884/0.99 remains of interest despite it being tested on Friday (green zones on the H4 chart). Both zones, as you can see, also boast daily structure.
The only grumble we would have if we were to take a long from the said H4 area is the fact that weekly price could potentially push the market lower to shake hands with support at 0.9861. On a similar note, a short from 1.0016/0.9992 is somewhere that could be faked as price may want to connect with the 2016 yearly opening level mentioned above at 1.0029. As such, we are advising traders not to trade the above said zones blindly! Wait for additional confirmation either in the form of a H4 candle (preferably a full-bodied candle) or a lower-timeframe signal (see the top of this report).
Data points to consider: No high-impacting new events.
Levels to watch/live orders:
- Buys: 0.9884/0.99 ([waiting for a reasonably sized H4 bull candle to form before pulling the trigger is advised] stop loss: ideally beyond the candle’s tail).
- Sells: 1.0016/0.9922 ([waiting for a reasonably sized H4 bear candle to form before pulling the trigger is advised] stop loss: ideally beyond the candle’s wick).
DOW 30:
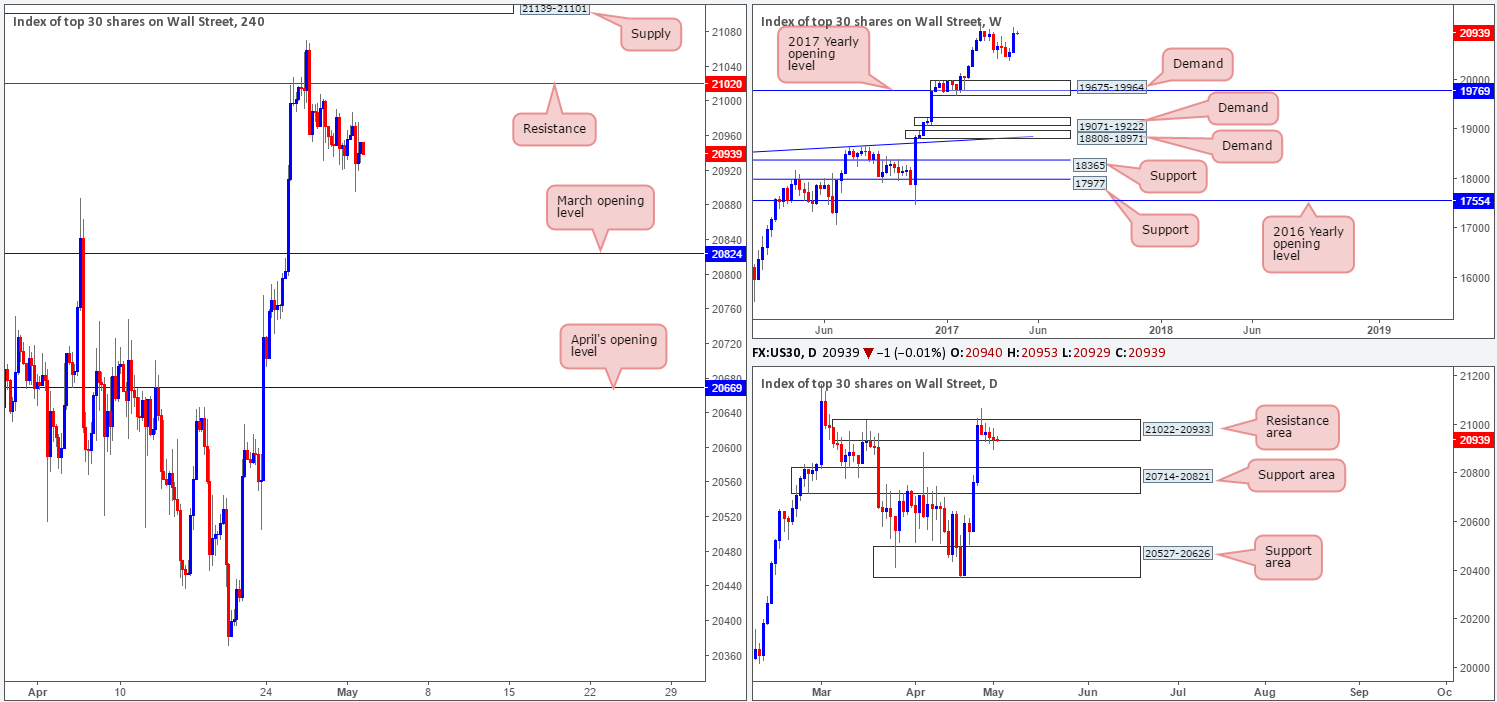
Since H4 price whipsawed through resistance at 21020, US equities have been grinding lower. The next support target on tap from here is not seen in view until March’s opening level at 20824 that sits conveniently above the daily support area at 20714-20821 (the next downside target on that timeframe). With daily price currently trading from a resistance area at 21022-20933, there’s a good chance that price may reach the above noted daily support area. However, up on the weekly candles, price looks poised to pop up to continue marching higher!
Our suggestions: Ultimately, our team’s bias is long. However, we’re finding it difficult to pin down a setup given the only support present is March’s opening level seen on the H4 chart. Therefore, unless new H4 structure forms at current price or we see a decline down to 20824, we will continue to remain flat.
Data points to consider: No high-impacting new events.
Levels to watch/live orders:
- Buys: 20824 looks an interesting level for longs. However, we would require a H4 bullish candle to present itself here (preferably a full-bodied candle) before committing (stop loss: ideally beyond the candle’s tail).
- Sells: Flat (stop loss: N/A).
GOLD:
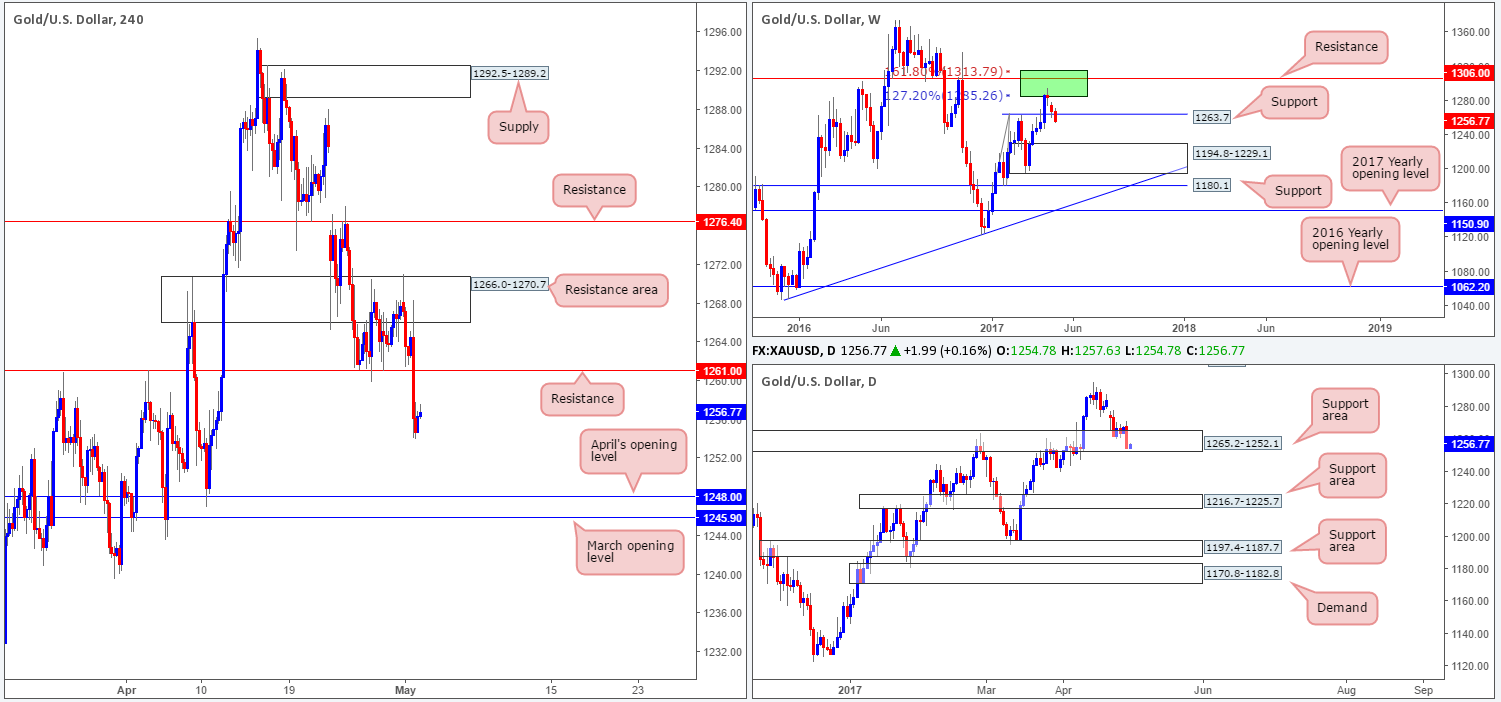
From the weekly chart this morning, we can see that the candles have edged below support coming in at 1263.7. Providing that the bears remain in control here, the demand zone plotted at 1194.8-1229.1 is likely to be the next barrier on the hit list. Whilst weekly bears appear to have a strong foothold in this market, daily price is seen trading within the lower limits of a support zone drawn from 1265.2-1252.1.
Over on the H4 candles, support at 1261.0 was taken out going into the London close yesterday. This has, as you can see, potentially opened up the path south for the unit to challenge April’s opening base line at 1248.0/March’s opening base line at 1245.9.
Our suggestions: Should H4 price retest 1261.0 as resistance today and hold, we may, given the technical picture on the weekly chart, think about selling. Of course, the only grumble we would have here is that daily price remains within a support zone (see above). Therefore, we would not consider shorts from 1261.0 UNLESS a reasonably sized H4 bearish candle forms off this line, preferably a full-bodied candle.
Levels to watch/live orders:
- Buys: Flat (stop loss: N/A).
- Sells: 1261.0 region ([waiting for a reasonably sized H4 bear candle to form before pulling the trigger is advised] stop loss: ideally beyond the candle’s wick).