A note on lower timeframe confirming price action…
Waiting for lower timeframe confirmation is our main tool to confirm strength within higher timeframe zones, and has really been the key to our trading success. It takes a little time to understand the subtle nuances, however, as each trade is never the same, but once you master the rhythm so to speak, you will be saved from countless unnecessary losing trades. The following is a list of what we look for:
- A break/retest of supply or demand dependent on which way you’re trading.
- A trendline break/retest.
- Buying/selling tails – essentially we look for a cluster of very obvious spikes off of lower timeframe support and resistance levels within the higher timeframe zone.
- Candlestick patterns. We tend to only stick with pin bars and engulfing bars as these have proven to be the most effective.
For us, lower timeframe confirmation starts on the M15 and finishes up on the H1, since most of our higher timeframe areas begin with the H4. Stops usually placed 5-10 pips beyond your confirming structures.
EUR/USD:
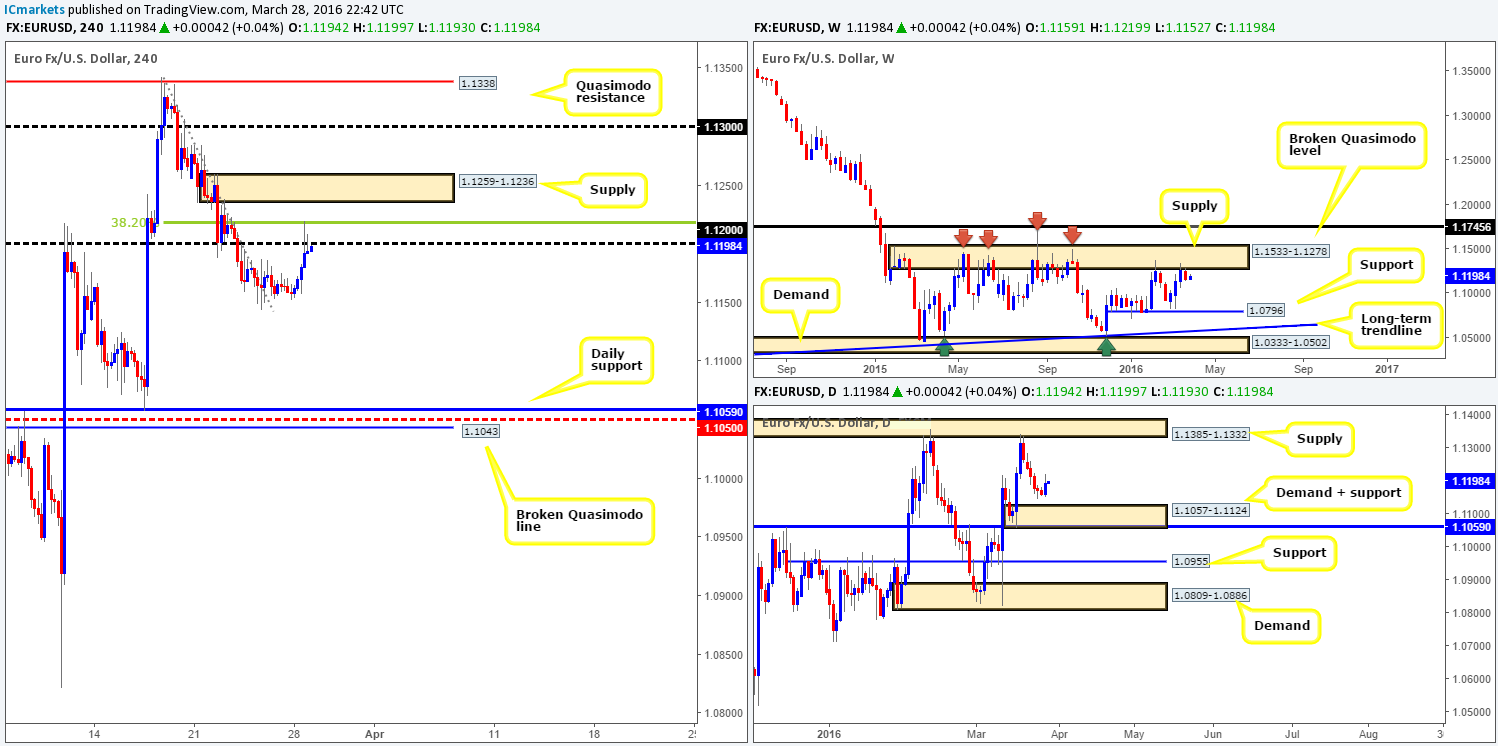
(Trade update: Stopped out at 1.1205 for a nice profit – for details see previous reports).
Following six days of consecutive losses the single currency recovered nicely from the 1.1157 region yesterday, allowing price to shake hands with the 1.1200 handle by the close 1.1194. In view of the H4 selling wicks formed around 1.1200 and the supporting 38.2% Fibonacci level lurking above at 1.1218, would our team consider this a suitable platform in which to sell from?
Well, with price currently trading from weekly supply given at 1.1533-1.1278 (managed to hold this cap upside in this market since May 2015), and daily action showing the path south is clear down towards demand drawn from 1.1057-1.1124, selling this market appears the more logical path for price to take.
Therefore, our prime focus today will be on looking for lower timeframe shorts around the 1.1200 number, targeting 1.1124 – the top-side of daily demand. Event risks for this setup, however, include the U.S. Consume confidence report at 3pm GMT and Fed Chair Yellen takes the stage at 5.20pm GMT, so trade carefully during those times!
Levels to watch/live orders:
- Buys: Flat (Stop loss: N/A).
- Sells: 1.1200 [Tentative – confirmation required] (Stop loss: dependent on where one confirms this level).
GBP/USD:
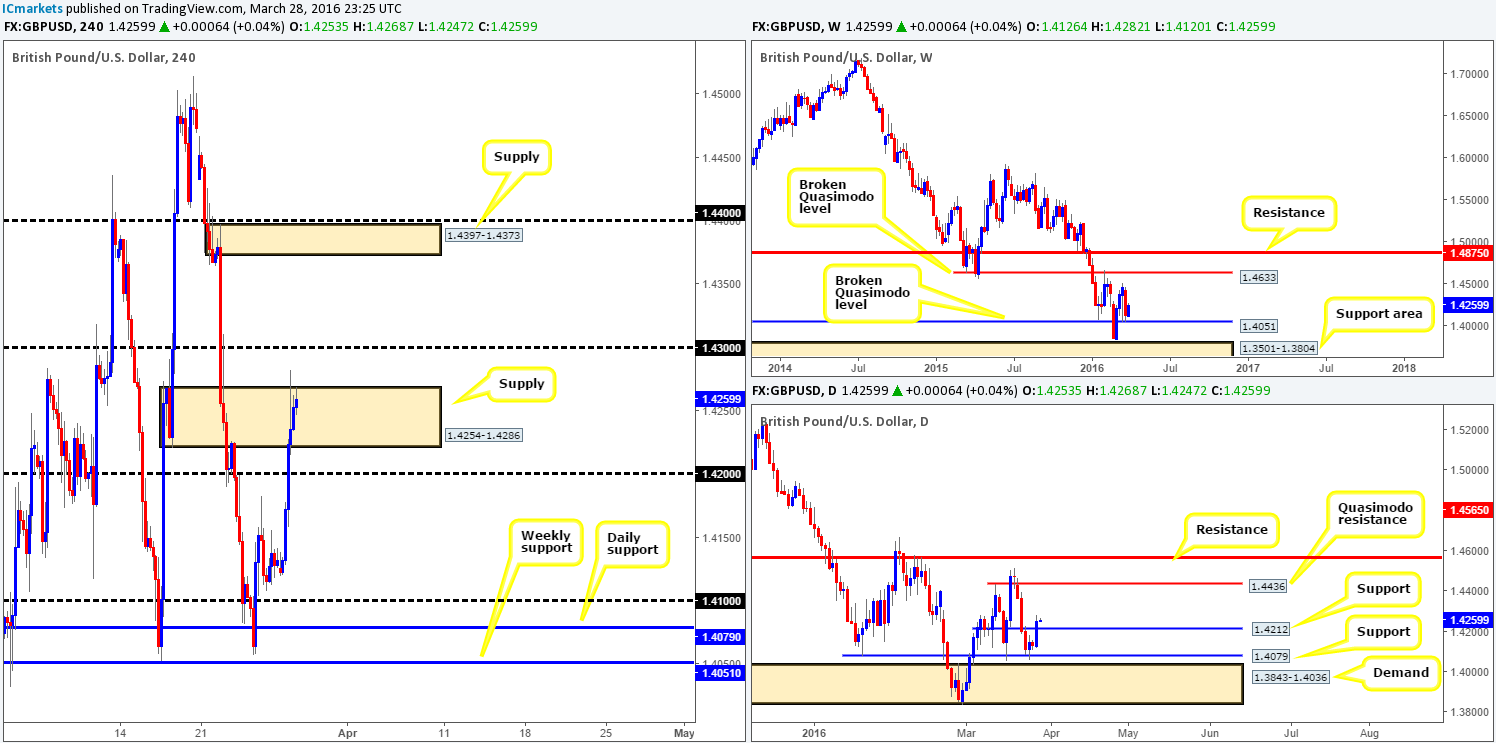
Using a top-down approach this morning, the weekly chart shows price found support from a broken Quasimodo line at 1.4051, with room being seen to continue pushing north at least until the 1.4514 region. Sliding down to the daily chart, we can see that Cable closed above resistance at 1.4212 yesterday (now acting support) and now appears free to rally higher towards 1.4436 – a strong-looking Quasimodo resistance line.
Buying right now, however, might not be the best path to take according to the H4 chart. Price is currently loitering within supply at 1.4254-1.4286, following a heavy round of buying during yesterday’s sessions off the back of poor U.S. PCE inflation. To our way of seeing things at the moment, the most logical action to take would be to WAIT until the GBP peeked above the 1.4300 barrier. This would not only open the trapdoor for a move up towards supply coming in at 1.4397-1.4373, but may also allow one the opportunity to trade any retest of this number (lower timeframe confirmation preferable).
Levels to watch/live orders:
- Buys: Watch for price to consume 1.4300 and look to trade any retest seen thereafter (lower timeframe confirmation preferred).
- Sells: Flat (Stop loss: N/A).
AUD/USD:
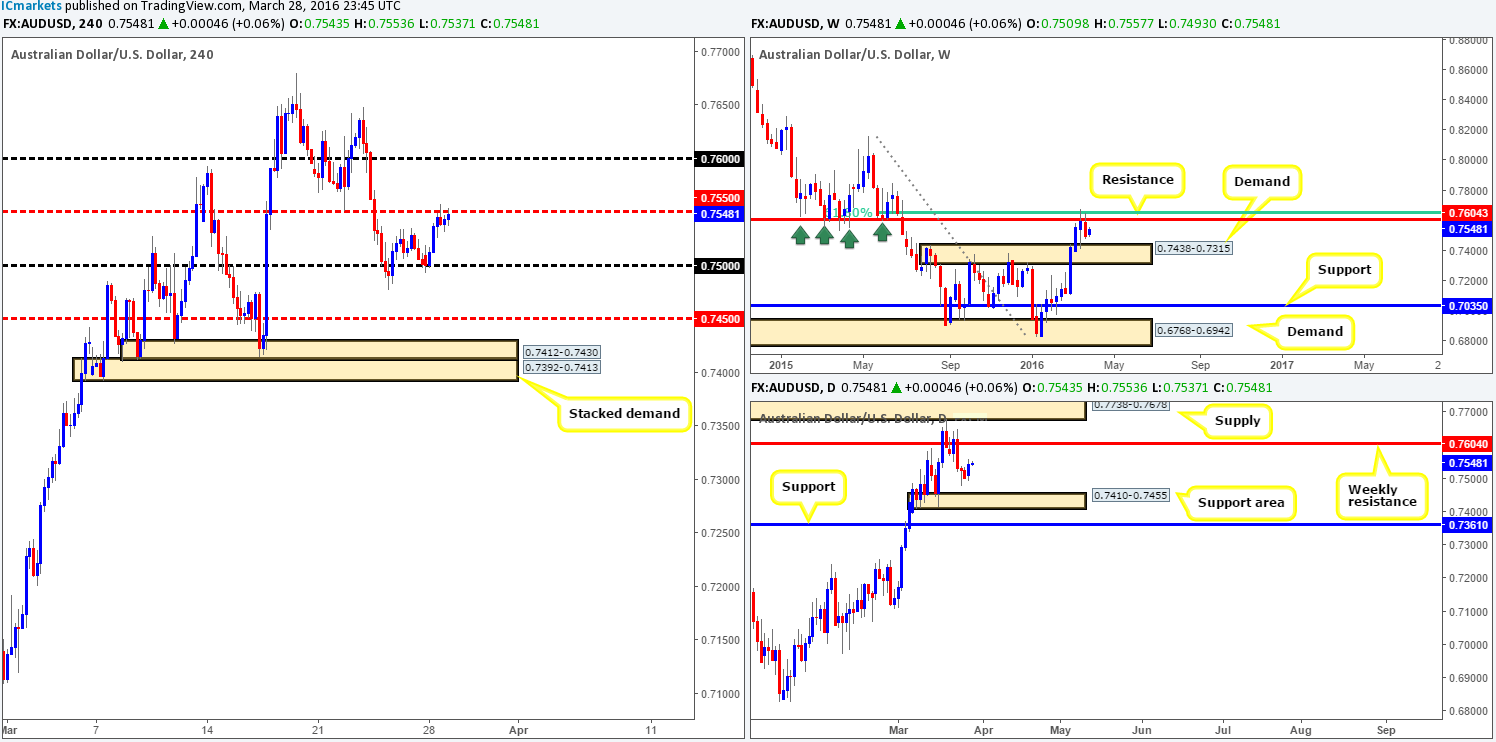
In the thick of trading action yesterday, the commodity currency pushed north from the jaws of psychological support 0.7500, reaching the H4 mid-level barrier 0.7550 by the day’s end. Judging by the H4 candle action around this number at the minute, it’s relatively clear to see that offers are weakening here.
Despite this, over on the daily chart, there’s room for prices to drive lower to test the upper boundary of a support area chalked up at 0.7410-0.7455. Looking at the weekly chart, however, we see a very neutral tone right now, as price is loitering mid-range between resistance coming in at 0.7604 and demand penciled in at 0.7438-0.7315.
Given the above points, 0.7550 will likely play a key role in our decision-making process today. Should we see a H4 close higher, it’s likely price will test weekly resistance at 0.7604 once more. Although the Aussie has been trending north, buying this breakout, knowing weekly resistance is lurking just above is not something we’d stamp high probability! Conversely, should the bears get their act together and defend 0.7550 today, this could be a solid line in which to look for (lower timeframe) confirmed shorting opportunities, targeting 0.7500, followed by 0.7450 (the top-side of the aforementioned daily support area).
Levels to watch/live orders:
- Buys: Flat (Stop loss: N/A).
- Sells: 0.7550 [Tentative – confirmation required] (Stop loss: dependent on where one confirms this level).
USD/JPY:
During the early hours of yesterday’s trading, price tested the underside of H4 supply drawn from 113.81-113.63 and managed to reach lows of 113.15 on the day. Now, there is no denying that this is an awesome-looking supply zone, but to trade this area expecting much more than an intraday bounce is not something we’d go along with. Our reasoning lies within the higher-timeframe structure…Take a peek across to both the weekly and daily charts – check out how prominent the weekly resistance barrier loitering just above the current supply at 114.12 is! This, at least from our perspective, puts the H4 supply at a disadvantage since well-funded traders may look to wipe out this area, thus taking stops (liquidity) to sell into from the higher-timeframe line.
In the event that out logic is correct, we’ll be very interested in selling from the 114.12 region today. Lower timeframe confirmation would still be needed here, nonetheless, simply to avoid any fakeouts seen through our sell line, which is highly likely to happen!
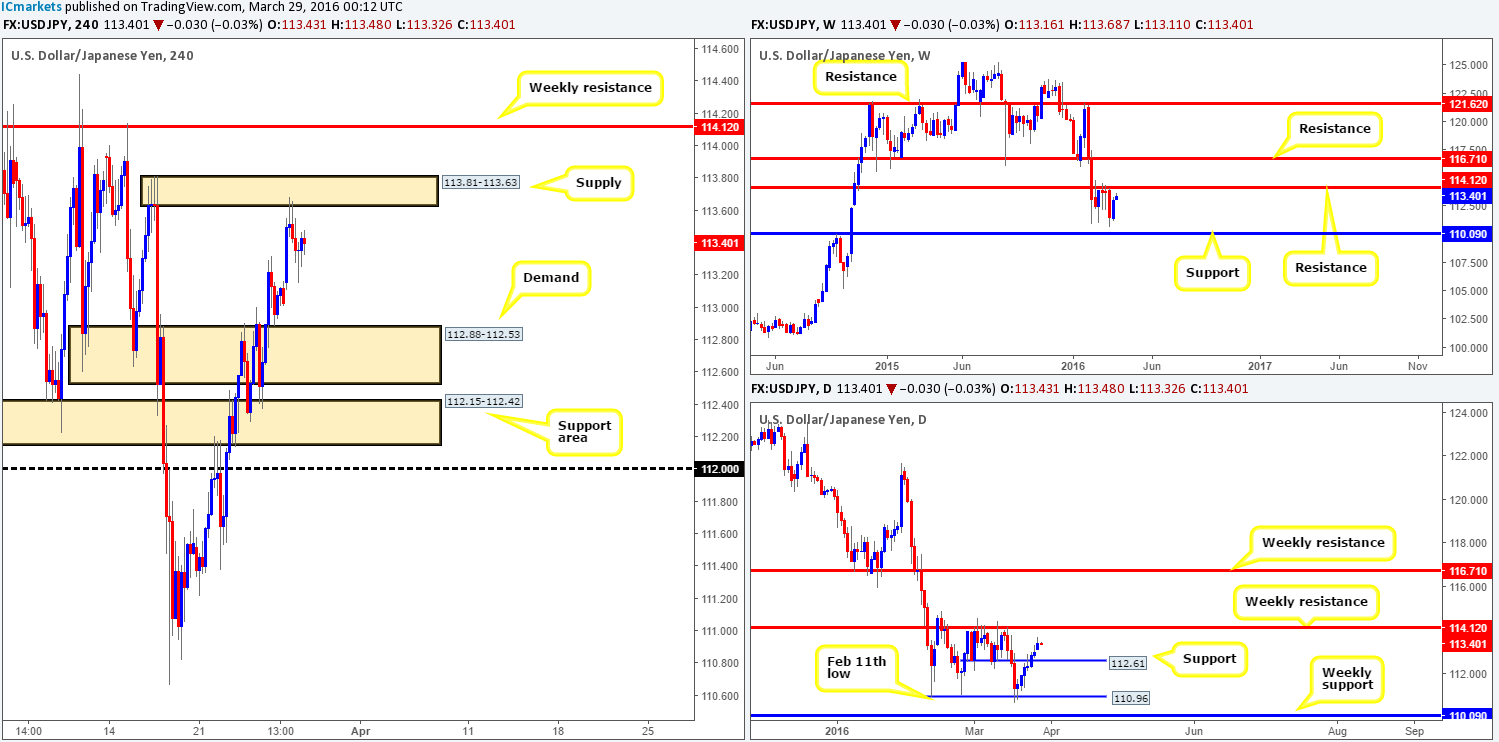
Levels to watch/live orders:
- Buys: Flat (Stop loss: N/A).
- Sells: 114.12 region [Tentative – confirmation required] (Stop loss: dependent on where one confirms this area).
USD/CAD:
The USD/CAD is trading markedly lower this morning. Yesterday’s action saw a heavy round of selling take out both the H4 mid-level hurdle 1.3250 and also the 1.3200 figure before finding support late in the day around H4 demand penciled in at 1.3140-1.3167. Well done to any of our readers who managed to get on board this train before it departed south as this was a noted area (H4 AB=CD bearish sell zone [1.3270/1.3194] Green rectangle) to sell from in our previous reports!
With a clear H4 buying tail printed from the top-side of the current H4 demand, what direction do we see this market headed today? Well, in regards to going long, one has immediate resistance from the 1.3200 figure to contend with, whilst over on the weekly chart, price is trading close to the underside of a recently broken ascending support line (1.0630). Therefore, if one must trade buy today, the more logical approach, as we see it, is to wait for a break above and retest of 1.3200, targeting 1.3250 as a first take-profit objective. Still, do trade this cautiously due to where price is positioned on the weekly chart!
On the other side of the coin, if one is to looking to sell in-line with weekly flow, you’ll be shorting into both H4 demand and daily demand at 1.3038-1.3165! Even with a break/below and retest of the current H4 demand as supply, one is left with a little over 30 pips of room to play with until the next support target – the 1.3100 figure. To that end, this is not really something we would advise attempting unless you’re able to enter short with a very small stop loss.

Levels to watch/live orders:
- Buys: Watch for price to consume 1.3200 and look to trade any retest seen thereafter (lower timeframe confirmation required).
- Sells: Flat (Stop loss: N/A).
USD/CHF:
Reporting from the weekly chart this morning, current price shows that the Swissy is retesting the underside of a recently broken trendline support extended from the low 0.9071. On the assumption that the bears defend this line, we could potentially see this pair decline down into the hands of a Quasimodo support barrier at 0.9526.
Casting our lines down to the daily chart, yesterday’s response to the weekly trendline mentioned above saw a bearish engulf of two prior daily candles. The next downside target on this scale can be seen at support drawn from 0.9660. This is, at least from this timeframe, effectively the last line of support until the weekly Quasimodo level discussed above.
Scanning across to the H4 chart, price recently plunged south from high within supply coming in at 0.9749-0.9781, and closed below the mid-level hurdle 0.9750 on the back of poor U.S. PCE inflation. This move has potentially opened up a selling opportunity in this market today on the retest of the 0.9750 figure, with 0.9700 as a first take-profit target, followed by the 0.9650 mid-level number (positioned closely to the daily support level discussed above at 0.9660).

Levels to watch/live orders:
- Buys: Flat (Stop loss: N/A).
- Sells: 0.9750 region [Tentative – confirmation required] (Stop loss: dependent on where one confirms this area).
DOW 30:
Following five consecutive weeks of buying on the DOW index, the upside momentum diminished considerably last week as price collided with both the underside of supply chalked up at 17752-17552 and a converging trendline resistance taken from the high 18365. This is likely a little concerning for traders who blindly went short at this zone without taking into consideration the lower timeframe structure.
On that note, moving across to the H4 chart price is now seen encased between demand coming in at 17456-17496 and supply drawn from 17617-17582. If price manages to breakout north here despite the weekly chart’s influence (see above), it’s likely we’re heading to the extremes of the weekly supply zone – a H4 resistance area at 17811-17736. This would NOT be a good sign for all those higher timeframe sellers! Assuming that a convincing close below the current H4 demand takes place, this would not only likely open up the path south down to the H4 support at 17275, but it will also place one in a good position to look for shorts on the retest (see black arrows).
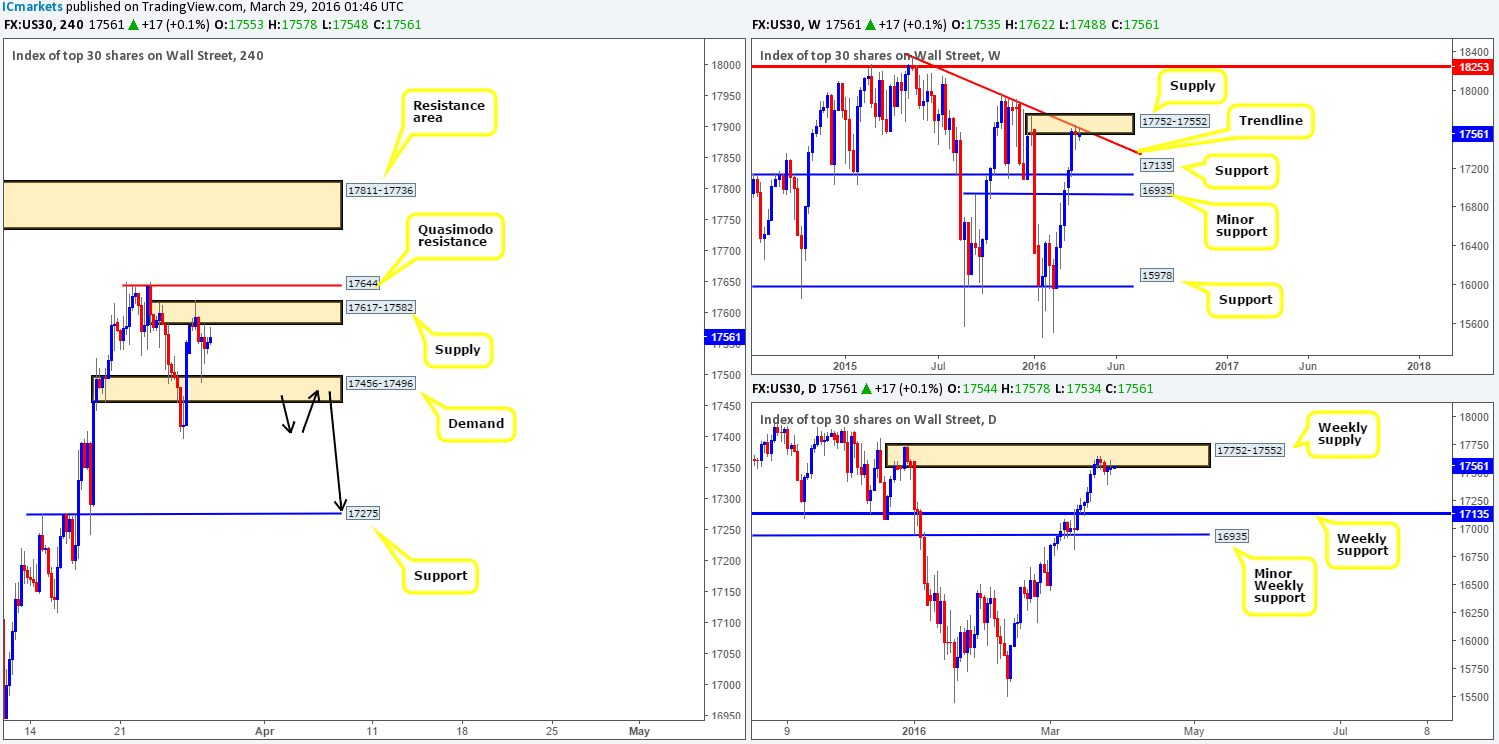
Levels to watch/live orders:
- Buys: Flat (Stop loss: N/A).
- Sells: Watch for price to consume 17456-17496 and look to trade any retest seen thereafter (lower timeframe confirmation required).
XAU/USD: (Gold)
Coming at you directly from the weekly chart this morning, the precious metal is currently trading from demand fixed at 1205.6-1181.2. However, before we all go buying Gold expecting it to rally to the moon, there is a rather strong resistance (prior support) at 1224.1 lurking just ahead!
Sliding down to the daily chart, it’s clear to see that price is trading within touching distance of supply chalked up at 1224.6-1238.3 (weekly resistance housed within the extremes of this area). A bearish reaction from this zone could force the yellow metal down to demand seen at 1181.4-1200.7, which sits deep within the weekly demand zone mentioned above at 1205.6-1181.2.
With the higher-timeframe picture placed to one side for the minute, let’s consider the H4 chart. As you can see, price rebounded beautifully from the support line 1211.3. This was a noted barrier to look for longs in our previous reports due to it also fusing with a 1:1 Harmonic correction (black arrows) and a 78.6% Fibonacci support level (taken from the low 1190.8).
Directly above current price, however, sits a small supply zone at 1224.6-1226.8, which as you can probably see, converges with the upper limit of daily supply and is located nearby weekly resistance (see above in bold). This is a KEY area for us today! Reason being is a bearish reaction from this zone could see Gold plummet to support at 1211.3, followed closely by the top-side of weekly demand at 1205.6. And a close above this area followed by a retest could spark a rally up to H4 supply at 1237.2-1243.9, which would not be a good sign for anyone short! Therefore, only trade the above mentioned key area alongside lower timeframe confirmation guys!
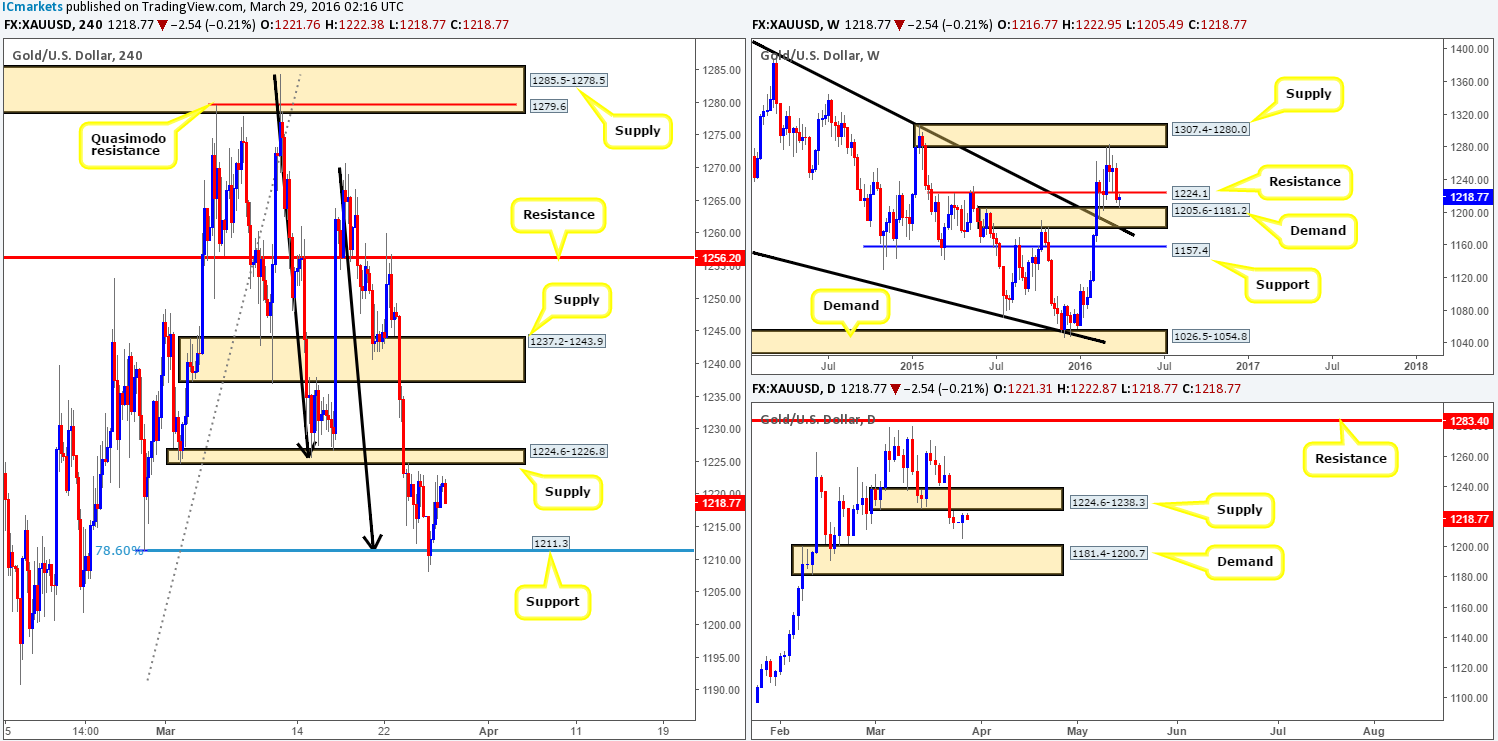
Levels to watch/live orders:
- Buys: Flat (Stop loss: N/A).
- Sells: 1224.6-1226.8 [Tentative – confirmation required] (Stop loss: dependent on where one confirms this area).