Waiting for lower timeframe confirmation is our main tool to confirm strength within higher timeframe zones, and has really been the key to our trading success. It takes a little time to understand the subtle nuances, however, as each trade is never the same, but once you master the rhythm so to speak, you will be saved from countless unnecessary losing trades. The following is a list of what we look for:
- A break/retest of supply or demand dependent on which way you’re trading.
- A trendline break/retest.
- Buying/selling tails/wicks – essentially we look for a cluster of very obvious spikes off of lower timeframe support and resistance levels within the higher timeframe zone.
We typically search for lower-timeframe confirmation between the M15 and H1 timeframes, since most of our higher-timeframe areas begin with the H4. Stops are usually placed 1-3 pips beyond confirming structures.
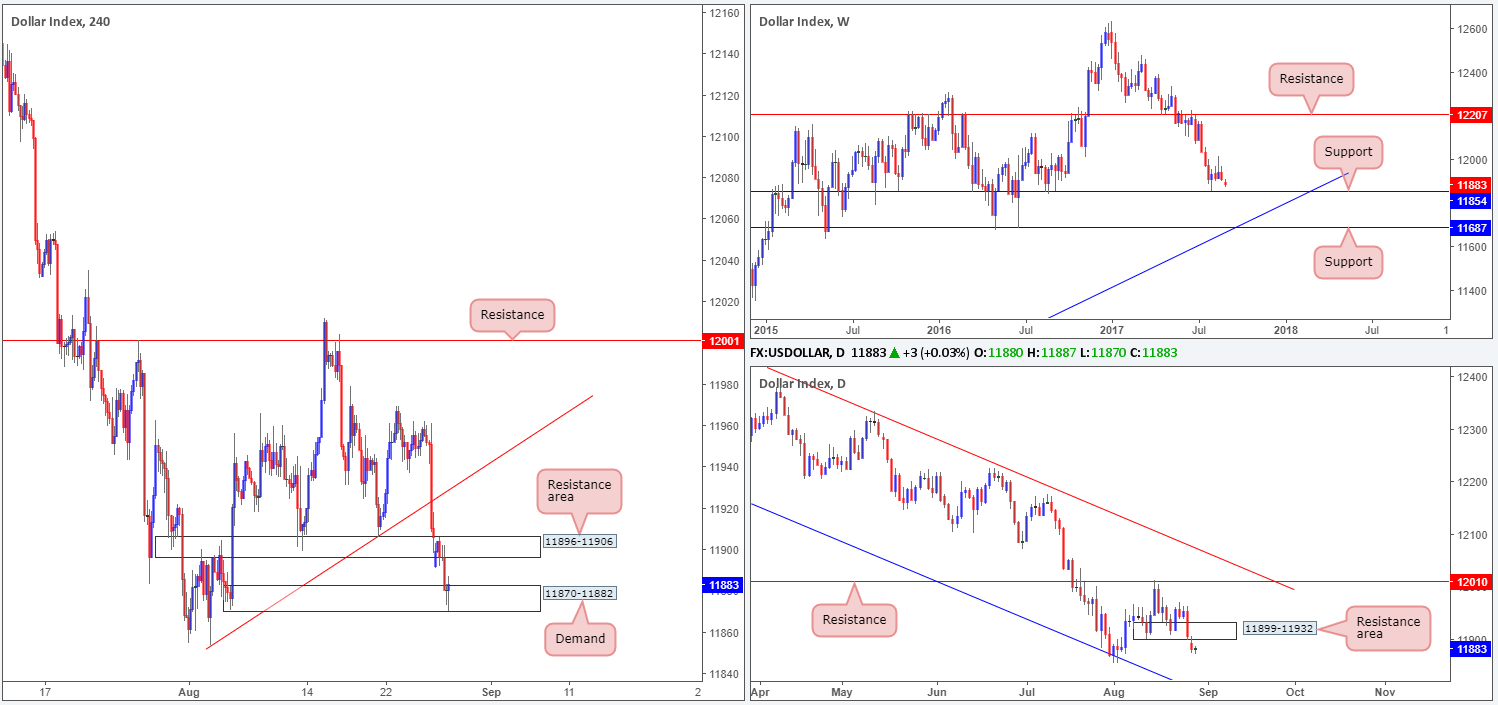
US dollar index (USDX):
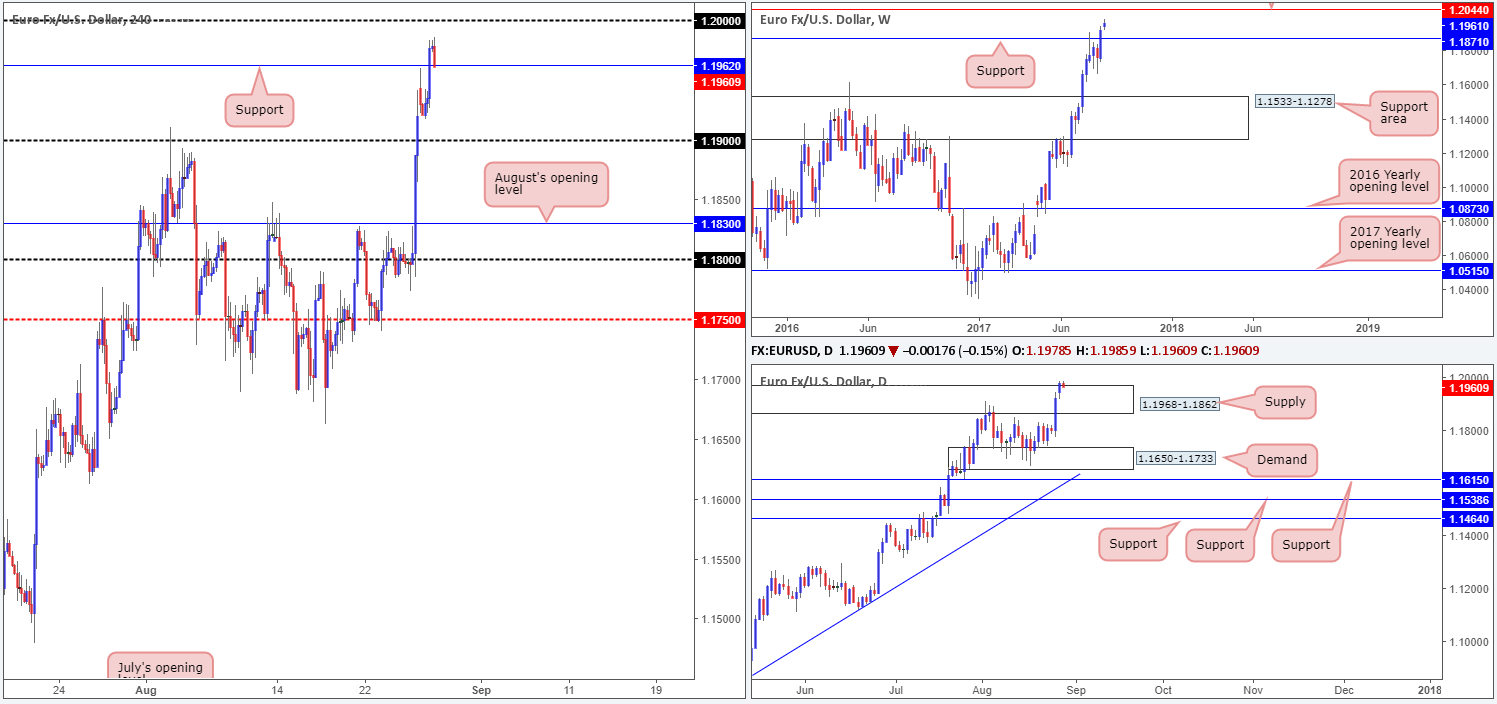
EUR/USD:
During the course of yesterday’s sessions the single currency closed beyond the H4 resistance level at 1.1962. With price now seen only inches from retesting this barrier as support, traders’ crosshairs are likely fixed on the large psychological number seen overhead at 1.20.
Over on the bigger picture, Monday’s advance lifted daily action above the supply zone coming in at 1.1968-1.1862. Given the (current) underlying trend in this market, this break would be viewed by most as a continuation move north. However, before we all buy this breakout, it might be worth noting that there is a weekly resistance line pegged just above it at 1.2044.
Suggestions: Look for shorting opportunities between 1.2044/1.20. Granted, this would entail trading countertrend, but seeing as we have a large round number and a weekly resistance in hand (see above), this will likely be sufficient enough to bounce prices lower.
To be on the safe side though, waiting for a H4 bearish candle to form within the area (preferably a full, or near-full-bodied candle) is advised. This will not guarantee a winning trade, but what it will do is show seller intent within a high-probability sell zone.
Data points to consider: US Consumer confidence at 3pm GMT+1.
Levels to watch/live orders:
- Buys: Flat (stop loss: N/A).
- Sells: 1.2044/1.20 ([waiting for a reasonably sized H4 bearish candle to form – preferably a full, or near-full-bodied candle – is advised] stop loss: ideally beyond the candle’s wick).
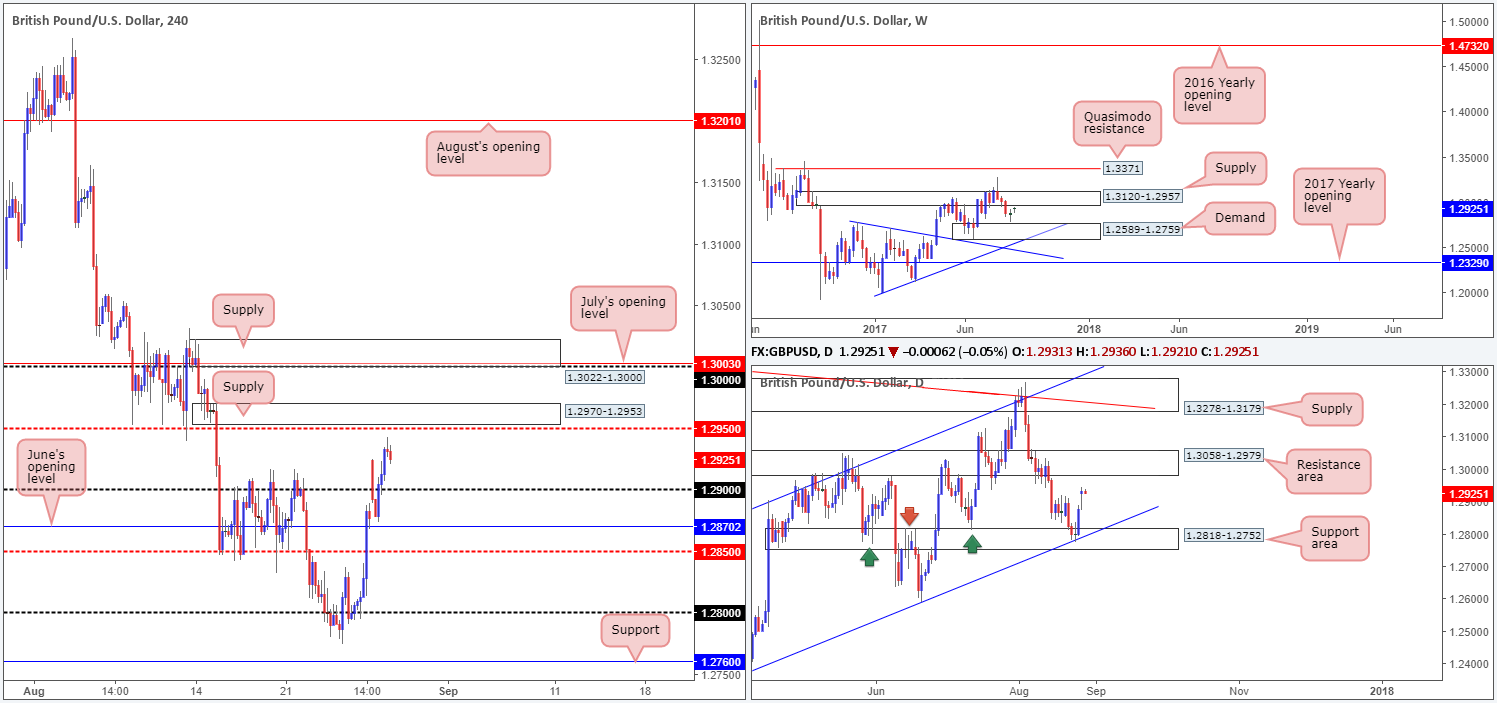
GBP/USD:
From the daily timeframe, we can see that the British pound recently extended Friday’s recovery from the support zone at 1.2818-1.2752 and channel support line etched from the low 1.2365. The next upside target on this scale can be seen at 1.3058-1.2979 (a resistance area). Along similar lines, weekly flow is seen trading just ahead of a supply zone drawn from 1.3120-1.2957. Moving across to the H4 candles, near-term resistance stands at 1.2950.
With the above in mind, we have absolutely no interest in buying this market right now. However, we do have two areas on the sell-side that you may find interesting:
- H4 supply positioned directly above 1.2950 at 1.2970-1.2953. This area encapsulates the lower edge of the weekly supply mentioned above at 1.2957.
- A H4 supply located at 1.3022-1.3000. Not only does this area boast the large 1.30 handle and July’s opening level at 1.3003, it’s also sited within both of the above noted higher-timeframe resistances.
Suggestions: Should H4 price chalk up a bearish candle (preferably a full, or near-full-bodied candle) at either of the aforesaid H4 supply zones, a sell trade could be an option today.
Data points to consider: US Consumer confidence at 3pm GMT+1.
Levels to watch/live orders:
- Buys: Flat (stop loss: N/A).
- Sells: 1.3022-1.3000 ([waiting for a reasonably sized H4 bearish candle to form – preferably a full, or near-full-bodied candle – is advised] stop loss: ideally beyond the candle’s wick). 1.2970-1.2953 ([waiting for a reasonably sized H4 bearish candle to form – preferably a full, or near-full-bodied candle – is advised] stop loss: ideally beyond the candle’s wick).
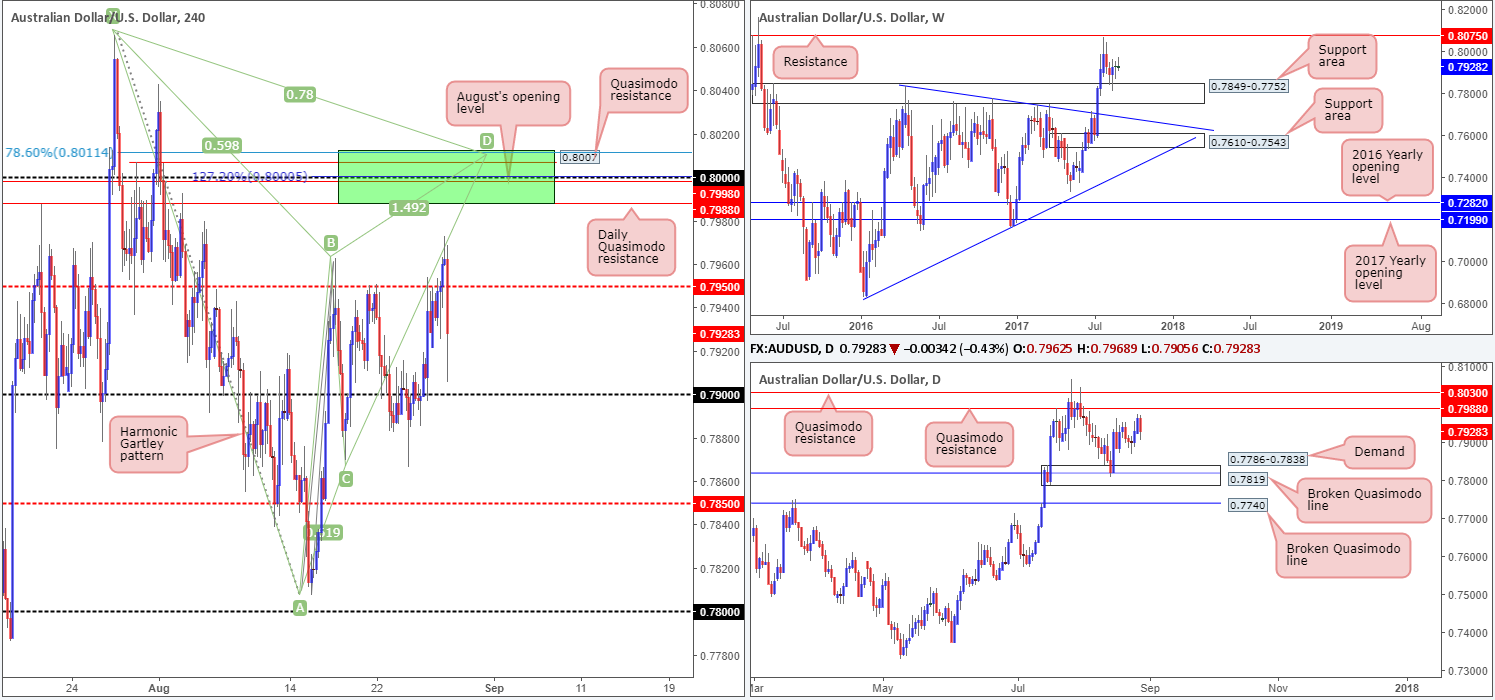
AUD/USD:
In recent hours, we’ve seen the commodity currency aggressively trade back below the H4 mid-level support at 0.7950. As far as we can see, this move was triggered by the latest North Korean and Japanese news. Tensions between the two countries have increased due to North Korea’s missile launch that fell into waters off Japan’s Hokkaido.
For those who read Monday’s report you will likely recall that our desk were eyeing the 0.80 boundary for shorting opportunities. Disappointingly, this recent turn of events has unfortunately thrown a spanner in the works!
Our reasoning behind liking 0.80 so much, apart from 0.80 being a watched round number, are the several nearby structures:
- The daily Quasimodo resistance level at 0.7988.
- A H4 Quasimodo resistance level at 0.8007.
- A H4 127.2% Fib ext. point at 0.80 taken from the low 0.7807.
- August’s opening level at 0.7998.
- A H4 Harmonic Gartley reversal point at the 78.6% Fib resistance line drawn from 0.8011.
Suggestions: While the above structures (H4 green sell zone) boast attractive confluence, one must take into account the possibility that a fakeout may be seen up to the daily Quasimodo resistance level at 0.8030 sited just above the green zone. Traditionally, when trading the Gartley Harmonic pattern the stop-loss order should go beyond the X point (0.8065). If you were to follow this, a fakeout up to the daily Quasimodo resistance is not a concern. It is more for the aggressive traders who will likely look to position stops just beyond the green zone. Should you be one of those traders, you may want to consider waiting for the H4 candles to prove seller intent from the sell zone (in the form of either a full, or near-full-bodied bearish candle), before pulling the trigger. This will help avoid a fakeout should it occur.
Should Aussie bulls find their feet today and push back above the 0.7950 area, we will once again be watching 0.80 for selling opportunities. Until then, however, we have absolutely no interest in trading this market.
Data points to consider: US Consumer confidence at 3pm GMT+1.
Levels to watch/live orders:
- Buys: Flat (stop loss: N/A).
- Sells: 0.8011/0.7988 (stop loss: either wait for a H4 bearish candle to form in the shape of a full, or near-full-bodied candle, and place stops above the candle’s wick. Another option is to simply enter at 0.80 and place stops above the H4 Harmonic X point at 0.8067).
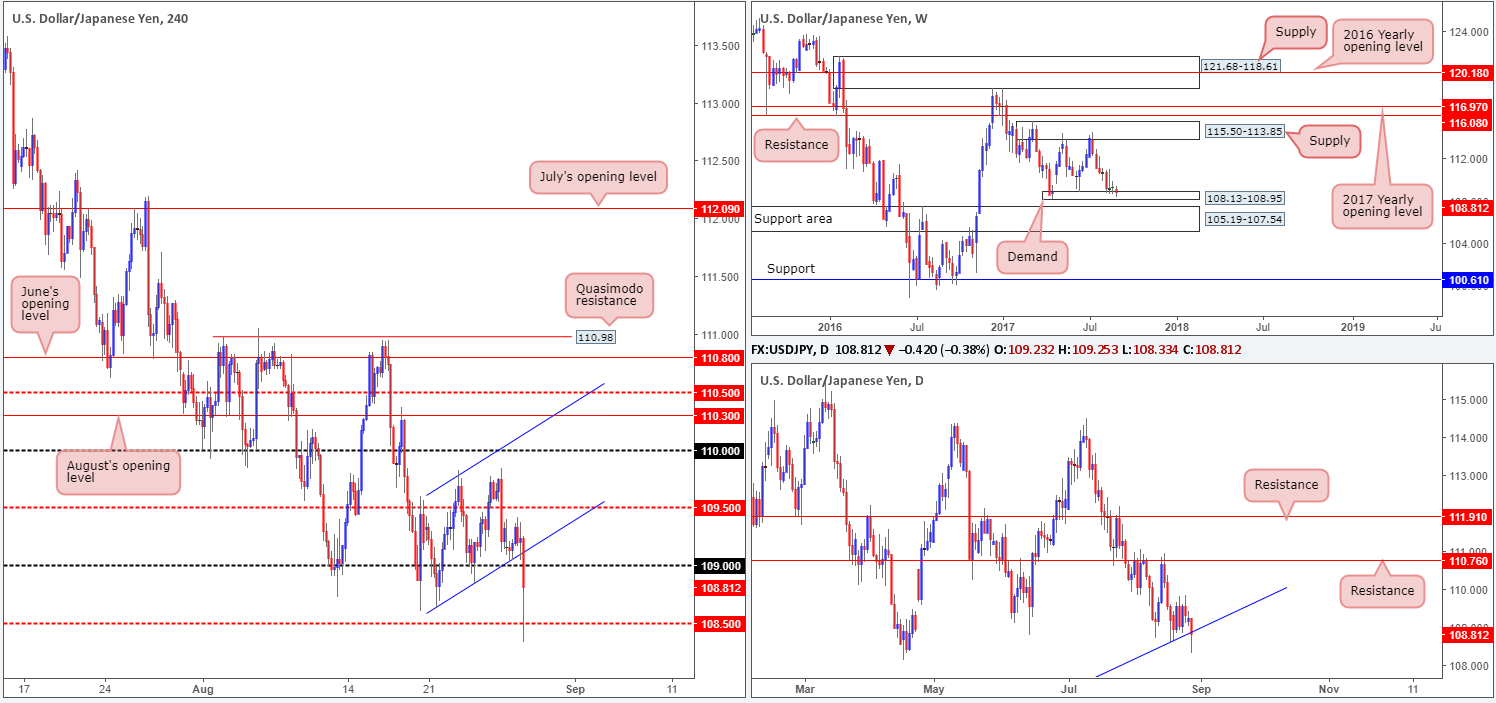
USD/JPY:
The USD/JPY sported a rather lackluster session on Monday, bolstered by a H4 channel support line etched from the low 108.63. In recent hours, however, the pair plunged lower as investors seek the safe-haven yen following North Korea/Japanese news. North Korea launched a missile that passed over Japan’s airspace in the early hours of Tuesday, before landing in the Pacific. This has, as you’d expect, caused tension between the two countries and that is being reflected on the charts!
From a technical perspective, the pair remains trading around the weekly demand at 108.13-108.95. However, the recent down move has placed daily price beneath the trendline support extended from the low 100.08. In addition to this, the H4 candles ran through bids at 109 and challenged the 108.50 line as support, which, for now, is holding ground.
Suggestions: Personally speaking, until the North Korea/Japanese news cools down, we will not be initiating any trades on this pair.
Data points to consider: US Consumer confidence at 3pm GMT+1.
Levels to watch/live orders:
- Buys: Flat (stop loss: N/A).
- Sells: Flat (stop loss: N/A).
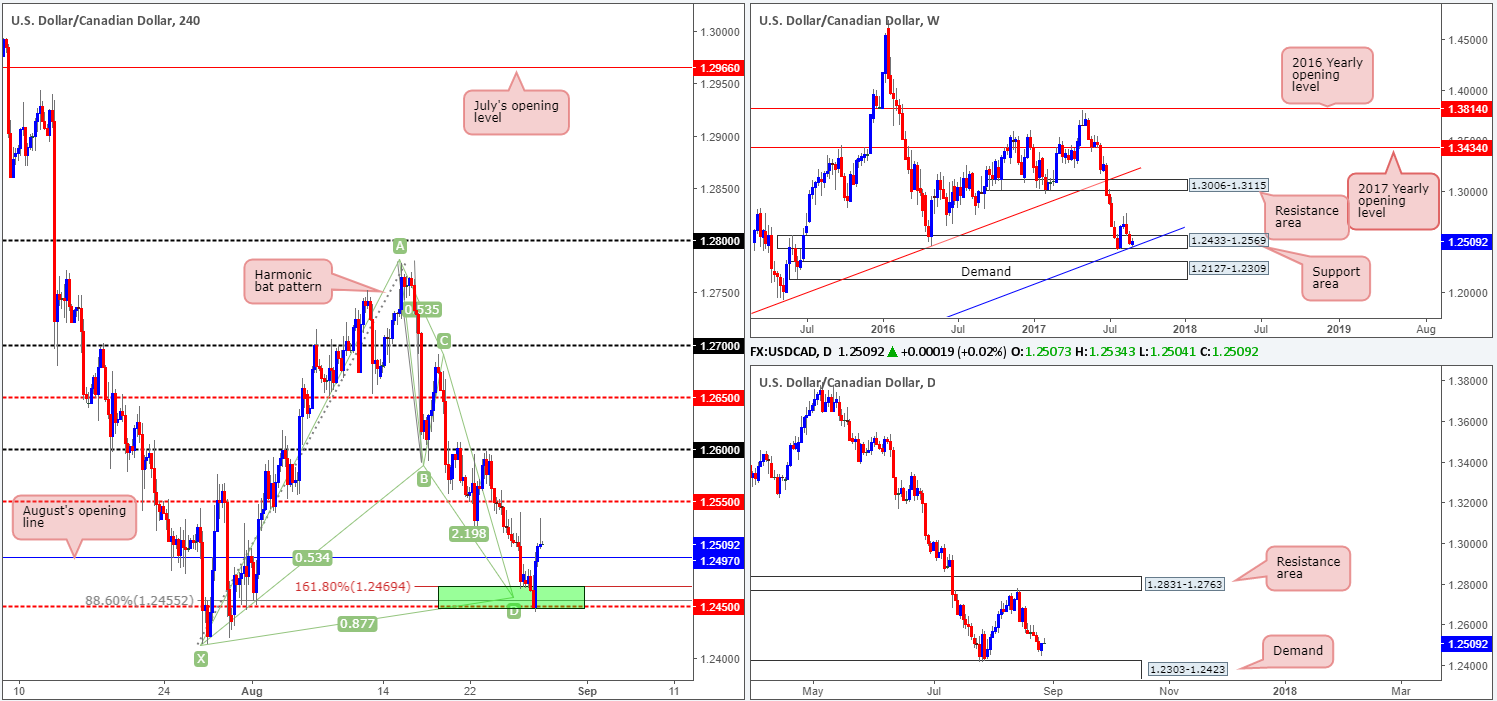
USD/CAD:
For those who read Monday’s report you may recall our team stating that should the H4 Harmonic bat pattern complete at 1.2455, we will be interested buyers here. As you can see, price tested the 1.2450 region beautifully and rallied higher. Well done to any of our readers who jumped on board alongside us here.
We executed a trade at 1.2455 and initially had our stop at 1.2411. Once price struck August’s opening level at 1.2497 (one times the risk), we moved the stop to breakeven. Ultimately, we’re looking for 1.2497 to hold as support and eventually push up to the 1.2550 neighborhood to take partial profits.
Suggestions: For those who missed the initial buy at 1.2455, you may, seeing that weekly price is bouncing from a support area coming in at 1.2433-1.2569 (unites with a trendline support etched from the low 0.9633), want to consider buying from 1.2497.
Data points to consider: US Consumer confidence at 3pm GMT+1.
Levels to watch/live orders:
- Buys: 1.2455 9 ([live] stop loss: breakeven).
- Sells: Flat (stop loss: N/A).
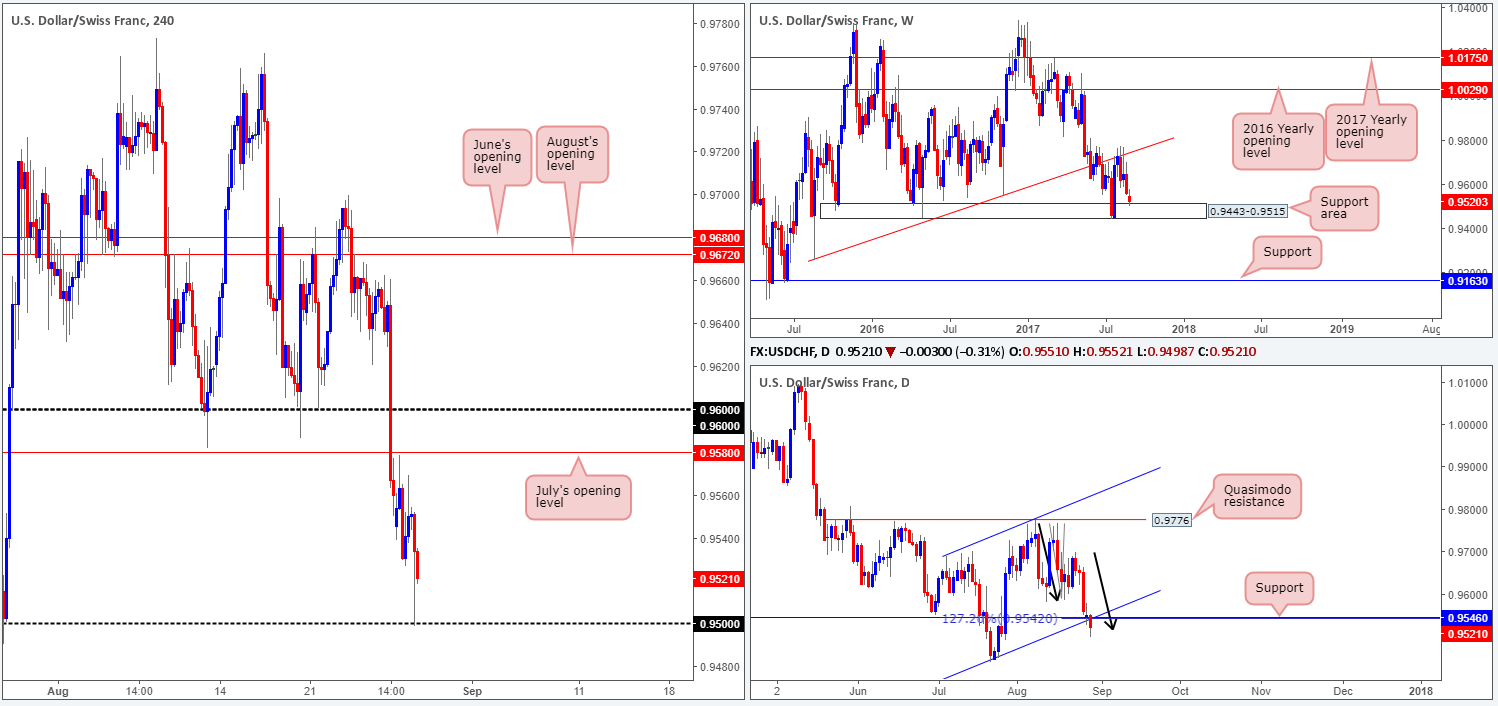
USD/CHF:
USD/CHF prices fell in recent trade after North Korea fired a ballistic missile over Japan. This forced the pair to touch gloves with the 0.95 handle, which has so far remained intact. On a more bearish note, however, daily price recently crossed below support at 0.9546, which happens to unite with a channel support etched from the low 0.9438 and an AB=CD (black arrows) 127.2% ext. point at 0.9542. Despite this though, the technical picture up on the weekly timeframe shows price shaking hands with a support area coming in at 0.9443-0.9515.
With the above notes taken onboard, neither a long nor short seems attractive at this time. A buy in this market places you against potential daily sellers and a sell would unfortunately position one against possible weekly buyers!
Suggestions: Personally, we feel the best path to take here is to remain on the sidelines and reassess structure going into tomorrow’s open.
Data points to consider: US Consumer confidence at 3pm GMT+1.
Levels to watch/live orders:
- Buys: Flat (stop loss: N/A).
- Sells: Flat (stop loss: N/A).
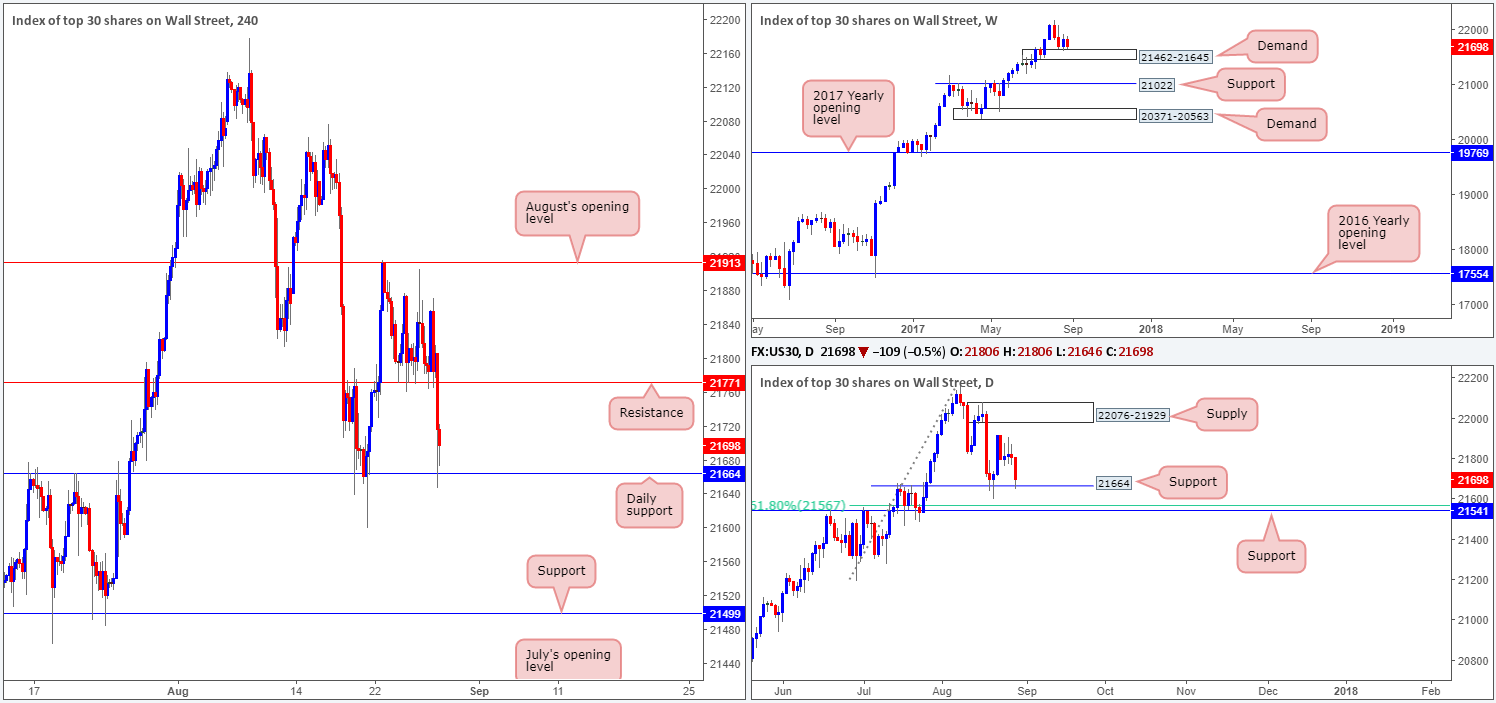
DOW 30:
In recent hours US equities slipped below support at 21771, allowing the unit to tag bids at the daily support level carved form 21664.We believe this move was triggered by recent tensions between North Korea and Japan, as North Korea launched a missile that passed over Japan’s airspace in the early hours of Tuesday, before landing in the Pacific.
Looking at this market form a technical perspective, weekly buyers still remain afloat above demand at 21462-21645. And, as already mentioned, daily price is seen interacting with a support level pegged at 21664. Apart from a move being seen down to the daily support at 21541 (converging with a 61.8% Fib support at 21567), we feel this market will eventually head north.
Our suggestions: With additional confirmation in the form of a H4 bullish candle (preferably a full, or near-full-bodied candle), we feel a buy from 21664 may be viable, targeting 21771 as an initial take-profit zone.
Data points to consider: US Consumer confidence at 3pm GMT+1.
Levels to watch/live orders:
- Buys: 21664 region ([waiting for a reasonably sized H4 bullish candle to form – preferably a full, or near-full-bodied candle – is advised] stop loss: ideally beyond the candle’s tail).
- Sells: Flat (stop loss: N/A).
GOLD:
Gold snapped higher this morning after North Korea launched a ballistic missile over Japan in the early hours of Tuesday, boosting demand for the safe-haven metal. According to the weekly timeframe, this has placed price within striking distance of a resistance level drawn from 1337.3. Before reaching this level though, it’s possible we may see price retest the daily support level at 1308.4, as per the black arrows.
For those interested in buying from here, we would strongly recommend waiting for additional confirmation to help avoid a possible fakeout. A reasonably sized H4 bullish candle, preferably a full, or near-full-bodied candle, would be ideal here. This would, in our view, show that we have interested buyers at this level.
Our suggestions: Watch for buying opportunities on any retest seen at 1308.4 today.
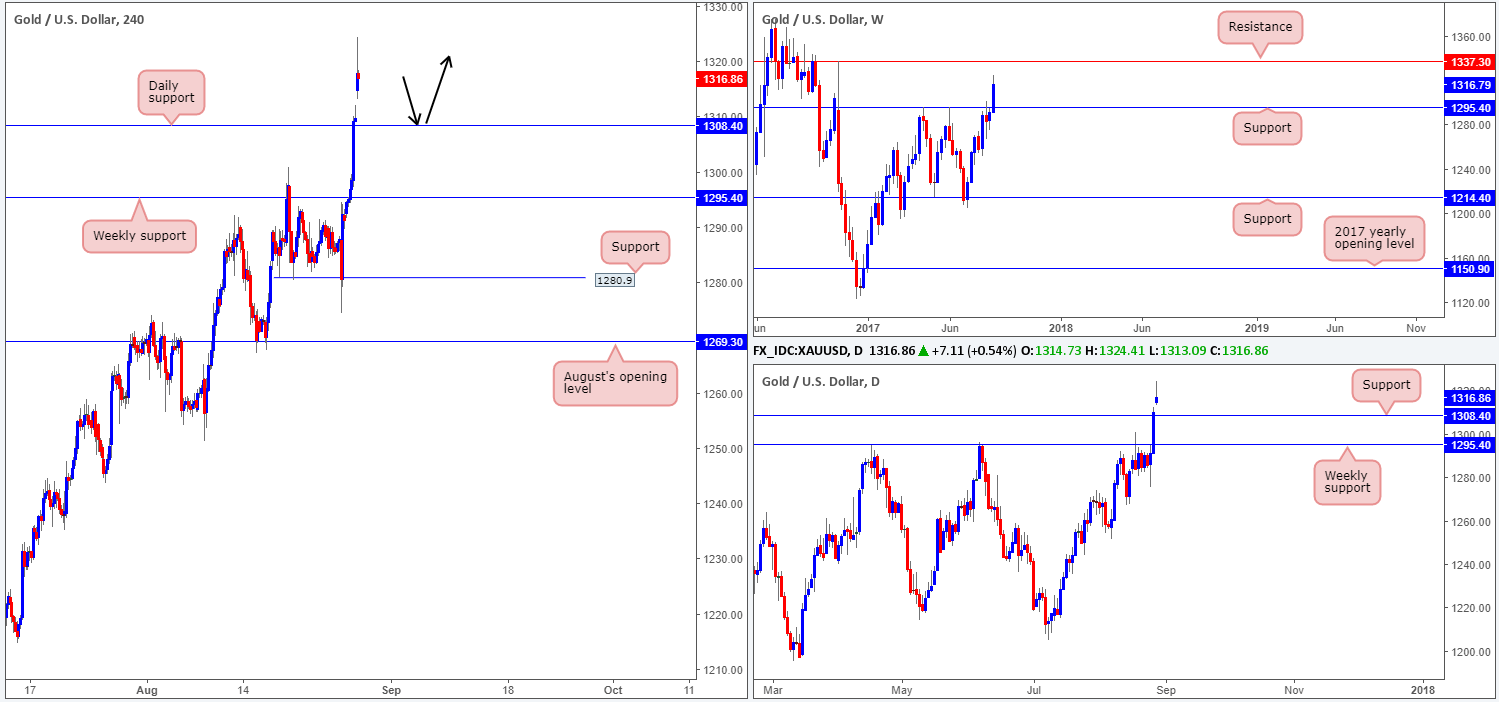
Levels to watch/live orders:
- Buys: 1308.4 region ([waiting for a reasonably sized H4 bullish candle to form – preferably a full, or near-full-bodied candle – is advised] stop loss: ideally beyond the candle’s tail).
- Sells: Flat (stop loss: N/A).


