A note on lower timeframe confirming price action…
Waiting for lower timeframe confirmation is our main tool to confirm strength within higher timeframe zones, and has really been the key to our trading success. It takes a little time to understand the subtle nuances, however, as each trade is never the same, but once you master the rhythm so to speak, you will be saved from countless unnecessary losing trades. The following is a list of what we look for:
- A break/retest of supply or demand dependent on which way you’re trading.
- A trendline break/retest.
- Buying/selling tails – essentially we look for a cluster of very obvious spikes off of lower timeframe support and resistance levels within the higher timeframe zone.
- Candlestick patterns. We tend to only stick with pin bars and engulfing bars as these have proven to be the most effective.
EUR/USD:
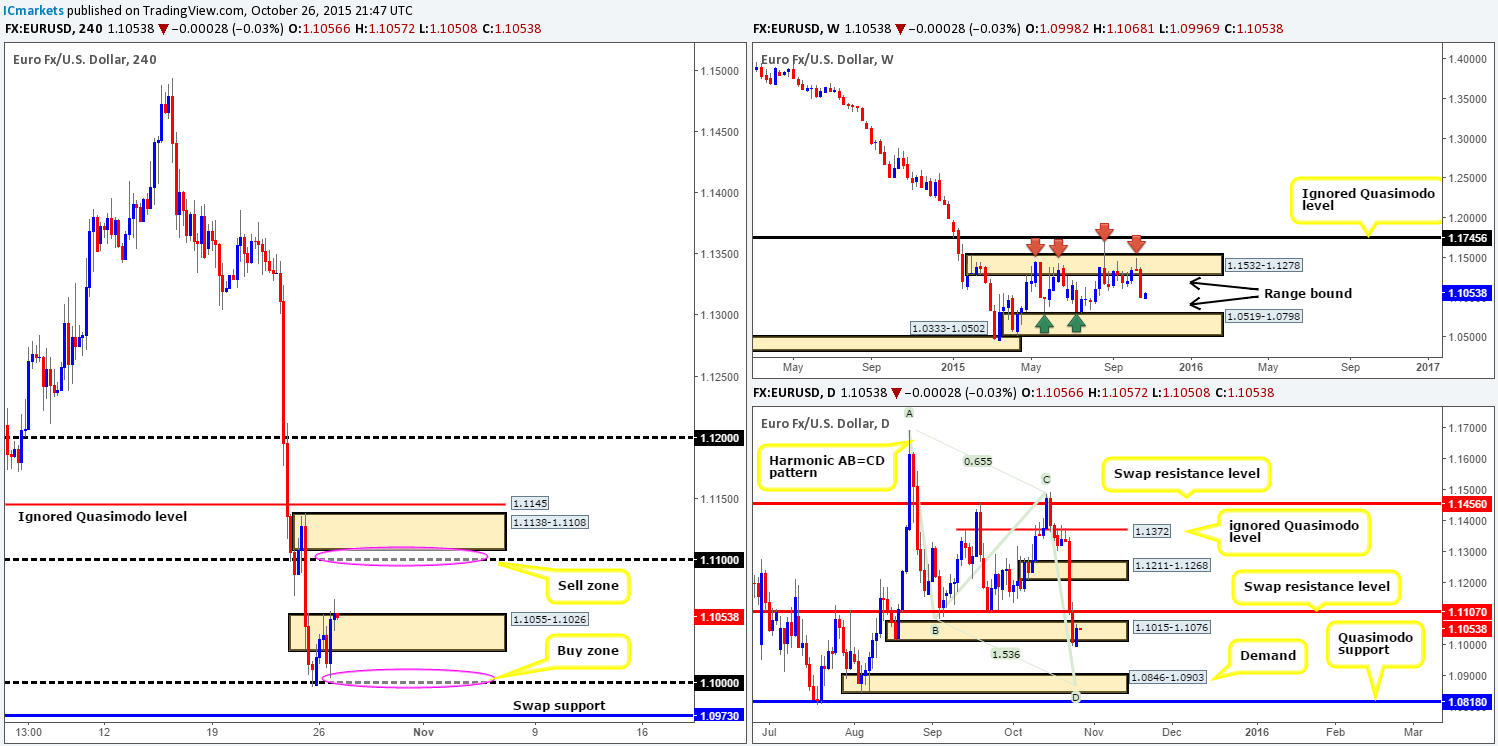
There was not much action seen in the EUR/USD market yesterday with price moving a lethargic 55 pips or so. During this quiet period, however, we did see trade bounce from psychological support 1.1000 and pierce above near-term supply sitting at 1.1055-1.1026. This, in itself, could suggest further upside today towards psychological resistance 1.1100, followed closely by supply at 1.1138-1.1108.
Despite this, one needs to remain aware that the weekly is offering no supporting structure to a buy here as it is trading mid-range between 1.1532-1.1278/1.0519-1.0798. In addition to this, recent daily action took out demand drawn from 1.1015-1.1076, potentially clearing the path south for further selling down to demand seen at 1.0846-1.0903 (converging with a nice-looking Harmonic AB=CD bull pattern).
Given the above points, we have two zones that we’d like to highlight for today’s sessions:
- The first is a buy zone seen back down at 1.1000. Should there be a retrace from current prices back down to this number, we would, dependent on how attractive the lower timeframe response is, enter long targeting psychological resistance 1.1100. The reason for requiring lower timeframe confirmation here is because, as we mentioned above, there is no supporting structure seen from the higher timeframes making it a potentially risky trade, so do be careful guys!
- Our second area of interest is a sell zone in the form of supply coming in at 1.1138-1.1108. Should price reach as high as 1.1100 today, we’re expecting to see a fakeout above here to tag in offers sitting within this supply. Reason being is the underside of this area ties in perfectly with a daily swap (resistance) level at 1.1107. To be on the safe side here though traders, should one manage to pin point a lower timeframe sell, we would recommend placing your stops above the ignored Quasimodo level lurking just above supply at 1.1145 to avoid any fakeout!
Levels to watch/live orders:
- Buys: 1.1000 [Tentative – confirmation required] (Stop loss: dependent on where one confirms this level).
- Sells: 1.1138-1.1108 [Tentative – confirmation required] (Stop loss: dependent on where one confirms this area).
GBP/USD:
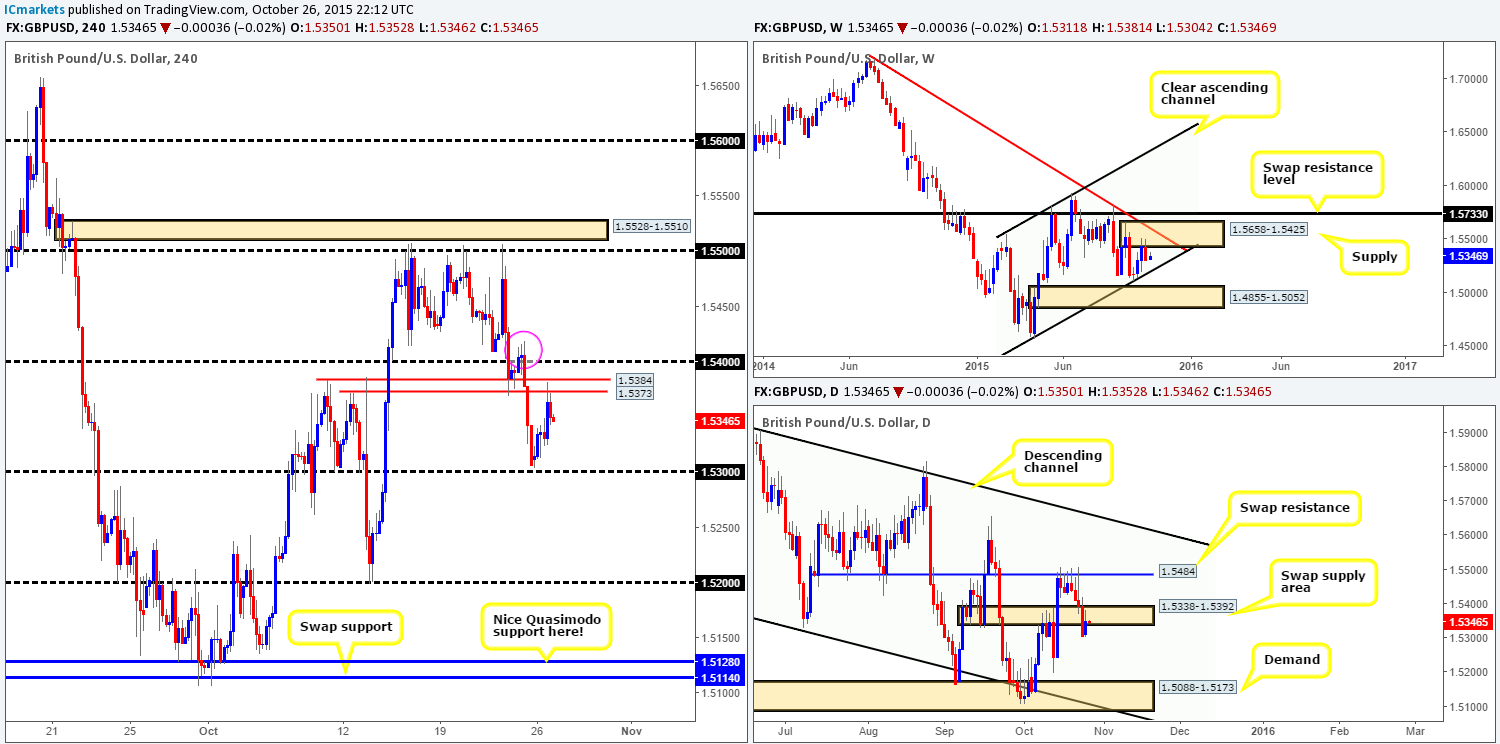
Following the open 1.5311, Cable remained relatively well-bid against the U.S. dollar throughout the day pulling price up to the underside of two closely-knit swap resistance levels at 1.5384/1.5373. Seeing that market action is currently being held lower from these two hurdles, where do we see this market heading today?
Ultimately, we believe this pair is looking to go lower! Our reasoning lies within the higher timeframe structure. From the weekly, we can see price has recently rebounded from supply coming in at 1.5658-1.5425, and shows room to move south down to channel support taken from the low 1.4564. Daily action also took out bids around a near-term swap demand zone falling in at 1.5338-1.5392. As a result, this may have opened up the doors to further selling this week down to the 13th October low 1.5199, followed closely by demand at 1.5088-1.5173.
Entering short at current prices, nonetheless, is out of the question for us. With that being said, we have two areas in mind for potential shorts today:
- 1.5384/1.5373. Should we see price reconnect with this area we’ll begin watching for lower timeframe resistance to hold firm. However, we’re prepared to see a fakeout higher here up to psychological resistance 1.5400, which, as you can see, coincides with a small 4hr supply circled in pink at 1.5419-1.5404. So do be patient here guys and let the fakeout do its thing first before looking to short.
- Supposing the GBP continues to tumble lower from current prices, nevertheless, we’ll then be looking for 1.5300 to be consumed. Following this, we’d then need to see price retest to the underside of this level with confirmed selling from the lower timeframes in order for us to be permitted to short this broken level.
Levels to watch/ live orders:
- Buys: Flat (Stop loss: N/A).
- Sells: 1.5384/1.5373 [Tentative – confirmation required] (Stop loss: dependent on where one confirms this area – fakeout above to 1.5400 possible) watch for bids to be consumed around 1.5300 and then look to trade any retest seen at this level (confirmation required).
AUD/USD:
Trading the AUD/USD has become a little tricky for us in recent times. Here’s why… Weekly action is showing price holding below supply at 0.7438-0.7315 right now, albeit, not the greatest response, but, nonetheless, still holding firm. Down on the daily chart, however, the buyers are seen defending 0.7204, which is now considered a swap support barrier. Therefore, before even looking at the 4hr chart, we know there is somewhat of a tug-of war going on between these two heavy-weight timeframes.
Turning our attention to the 4hr timeframe reveals price is actually encased within a descending channel fixed between a high of 0.7306 and a low drawn from 0.7197. Trading either extreme is viable as long as one is patient enough to wait for the lower timeframes to prove buying/selling interest exists.
The reason for needing confirmation when looking to go long within demand at 0.7165-0.7188 which ties in nicely with the channel extreme is simply because by entering long here puts you in the firing line of weekly sellers (see above).
Conversely, if one is considering shorting the extreme of the channel resistance today, remain vigilant to the fact that a fakeout above to both psychological resistance 0.7300 and even the underside of weekly supply 0.7315 could be seen, hence the need for confirmation at both extremes!

Levels to watch/ live orders:
- Buys: 0.7165-0.7188 [Tentative – confirmation required] (Stop loss: dependent on where one confirms this area).
- Sells: 0.7300 region [Tentative – confirmation required] (Stop loss: dependent on where one confirms this level).
USD/JPY:
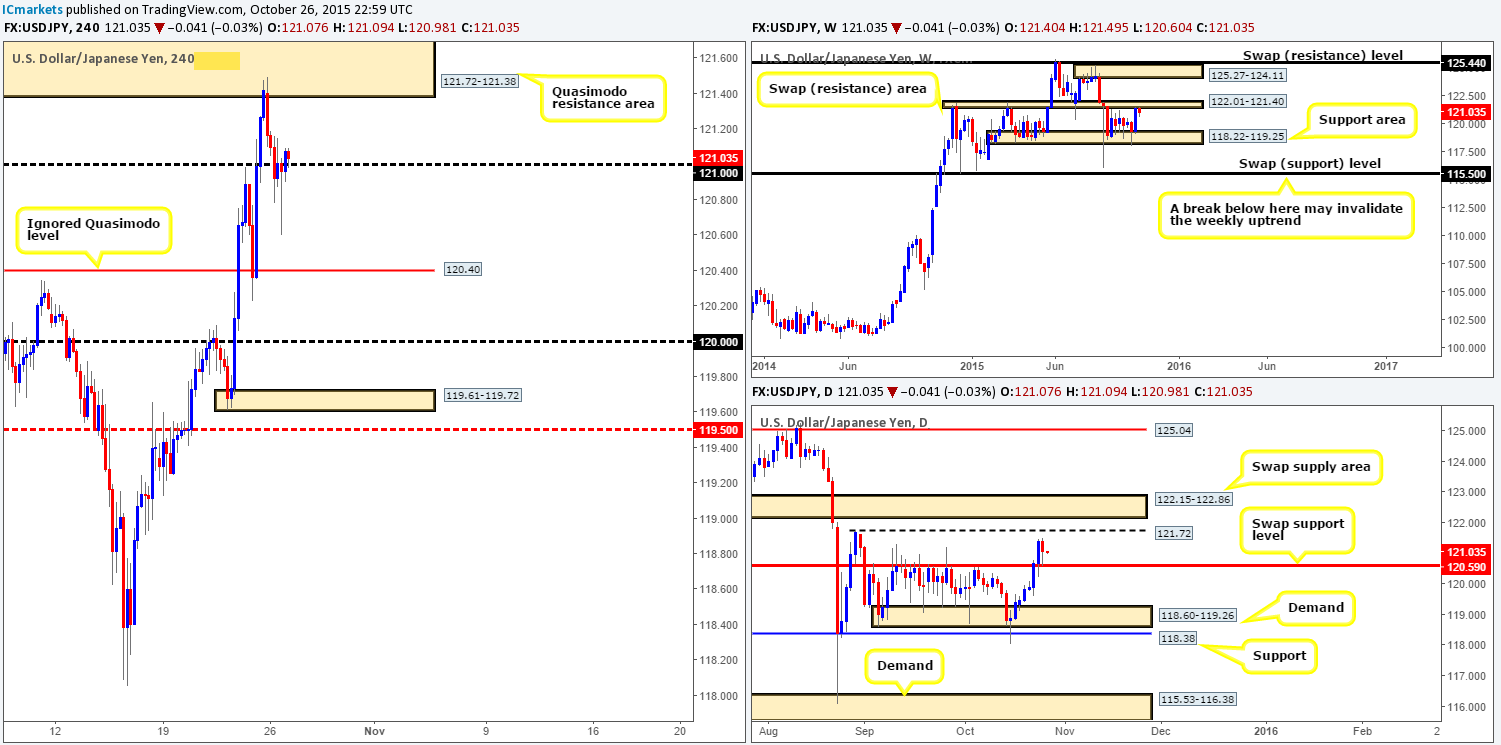
Using a top-down approach this morning shows us that selling interest is currently being seen from the underside of the weekly range resistance area at 122.01-121.40. On the other side of the ledger, candle action on the daily timeframe is seen holding above the recently broken range resistance at 120.59 as support.
Moving down to the 4hr chart shows price sold off beautifully from the Quasimodo resistance area at 121.72-121.38, which was noted to watch for in our previous report (http://www.icmarkets.com/blog/monday-26th-october-weekly-technical-outlook-and-review/). The sell-off from here took out bids around psychological support 121.00 and reached lows of 120.60 on the day.
In view of price now flirting with 121.00 right now, this market could go either way in our opinion. Should bids defend this number, we may see a push north back up to the aforementioned Quasimodo resistance area. A short from here is still valid in our book, only this time, we expect price to drive a little higher, even possibly faking above this area. On the other side of the coin, if sellers decide to take things lower from 121.00 today, we see price heading for the ignored Quasimodo level drawn at 120.40.
Just to be clear here traders, we have no plan to buy or sell 121.00 today, instead, we’re looking to short (with confirmation) at the above said Quasimodo resistance area, and enter long (with confirmation) at the aforementioned ignored Quasimodo level.
Levels to watch/ live orders:
- Buys: 120.40 [Tentative – confirmation required] (Stop loss: dependent on where one confirms this level).
- Sells: 121.72-121.38 [Tentative – confirmation required] (Stop loss: dependent on where one finds confirmation with this area since a fakeout above is possible).
USD/CAD:
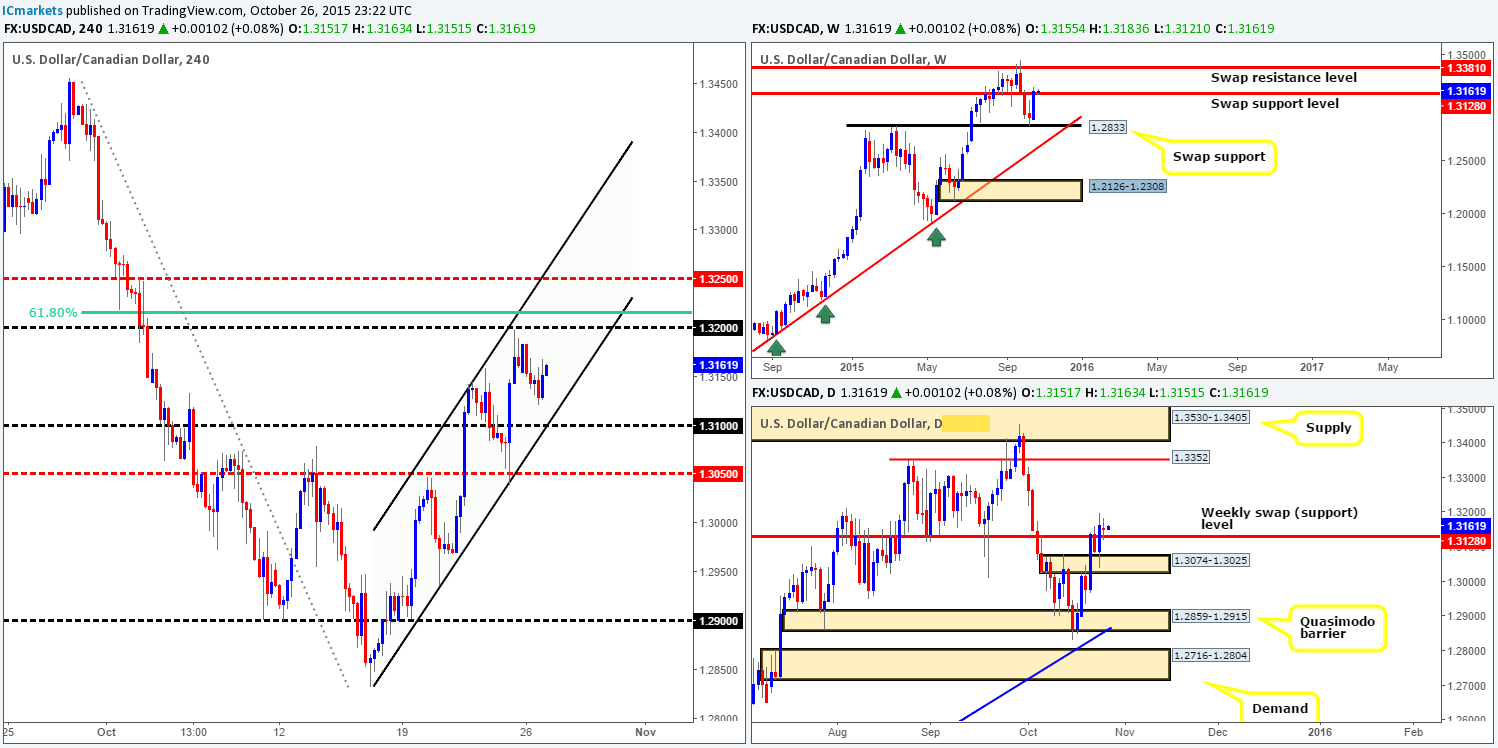
The USD/CAD was an extremely monotonous pair to watch yesterday. Session lows were recorded at 1.3121, whilst the high for the day came in in at 1.3183. As price still remains lodged within the current upward channel (1.2832/1.3142), how are things now looking on the higher timeframes? Overall, this market continues to hold above the recently broken weekly swap (resistance) level at 1.3128 as support. This is clearly seen on the daily timeframe as an indecision candle printed off the back of this level yesterday.
Given the above, it would, at least in our opinion, be impractical to consider shorting this pair for the time being as you’d be selling into higher timeframe support! However, looking to buy this pair on the 4hr timeframe is difficult as psychological resistance 1.3200 is looming forty pips above, followed closely by the 61.8% Fibonacci level at 1.3216. Therefore, our team has come to a general consensus that buying this market will only be permitted should a break above and retest of 1.3200 take place. Until this is seen, we’re going to remain flat.
Levels to watch/ live orders:
- Buys: Flat (Stop loss: N/A).
- Sells: Flat (Stop loss: N/A).
USD/CHF:
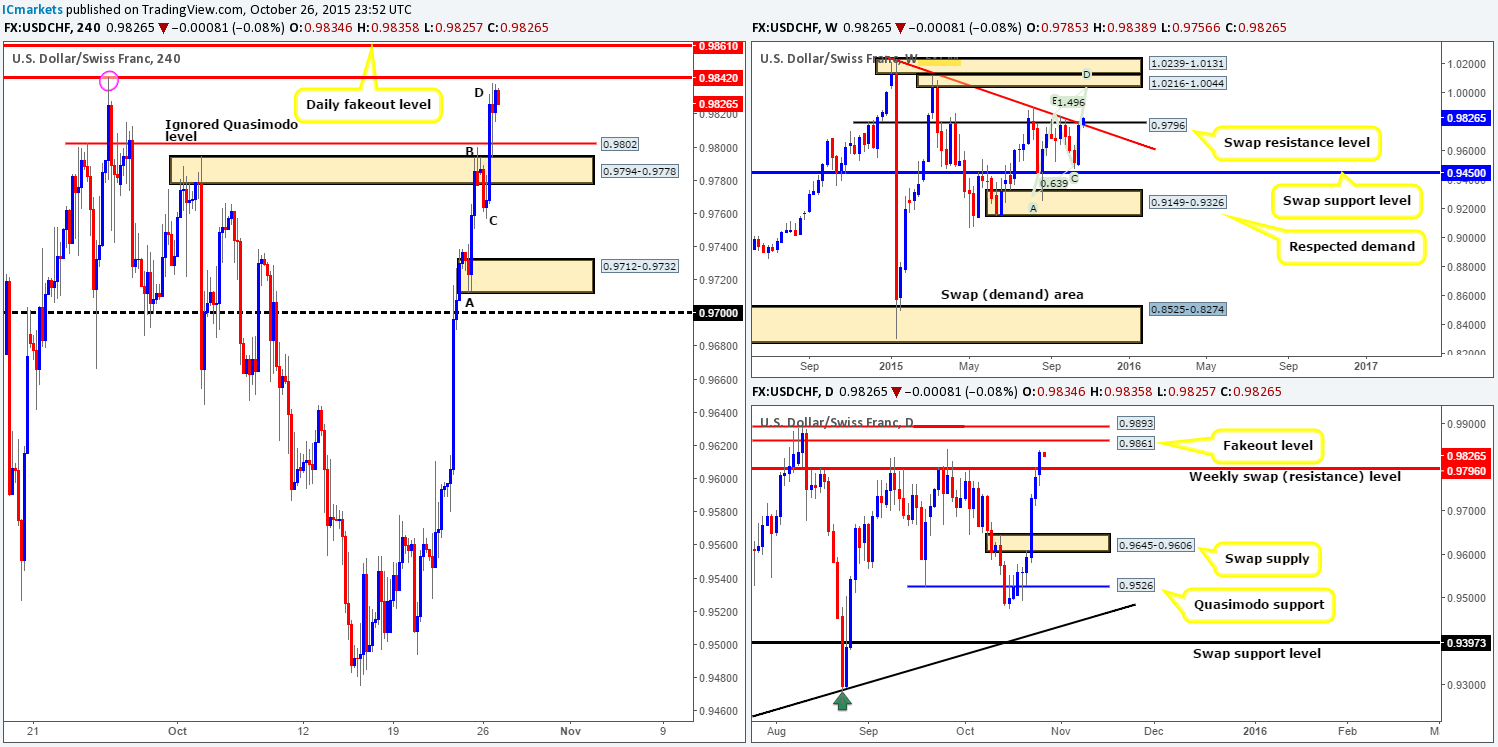
Coming at you directly from the weekly timeframe this morning shows that price is now trading above both the swap resistance level 0.9796 and also the trendline resistance taken from the high 1.0239. Scrolling a page lower to the daily scale, we can see that the buyers printed yet another bull candle during yesterday’s session, painting a clean close above the aforementioned weekly level. From this timeframe, the next upside targets to keep an eye on fall in at 0.9861 – a fakeout level, followed closely by a resistance barrier coming in at 0.9893.
Moving down one lower to the 4hr timeframe, the recent buying broke above both supply at 0.9794-0.9778 and a Quasimodo resistance level at 0.9802, reaching highs of 0.9838 on the day. Given how close price is trading now to the extreme high seen (circled) to the left at 0.9842, and the fact that market action approached this level forming a symmetrical AB=CD pattern, this could be a potential area to look for confirmed shorts today.
However, caution is advised here guys! Not only has there been a daily close above a weekly level (see above), but there is a fairly good chance that price will fake this extreme 4hr high to connect with the daily fakeout hurdle (also a level we have on our watchlist to sell) above at 0.9861.
Levels to watch/ live orders:
- Buys: Flat (Stop loss: N/A).
- Sells: 0.9842 [Tentative – confirmation required] (Stop loss: dependent on where one confirms this level) daily levels 0.9861 [Tentative – confirmation required] (Stop loss: dependent on where one confirms this level).
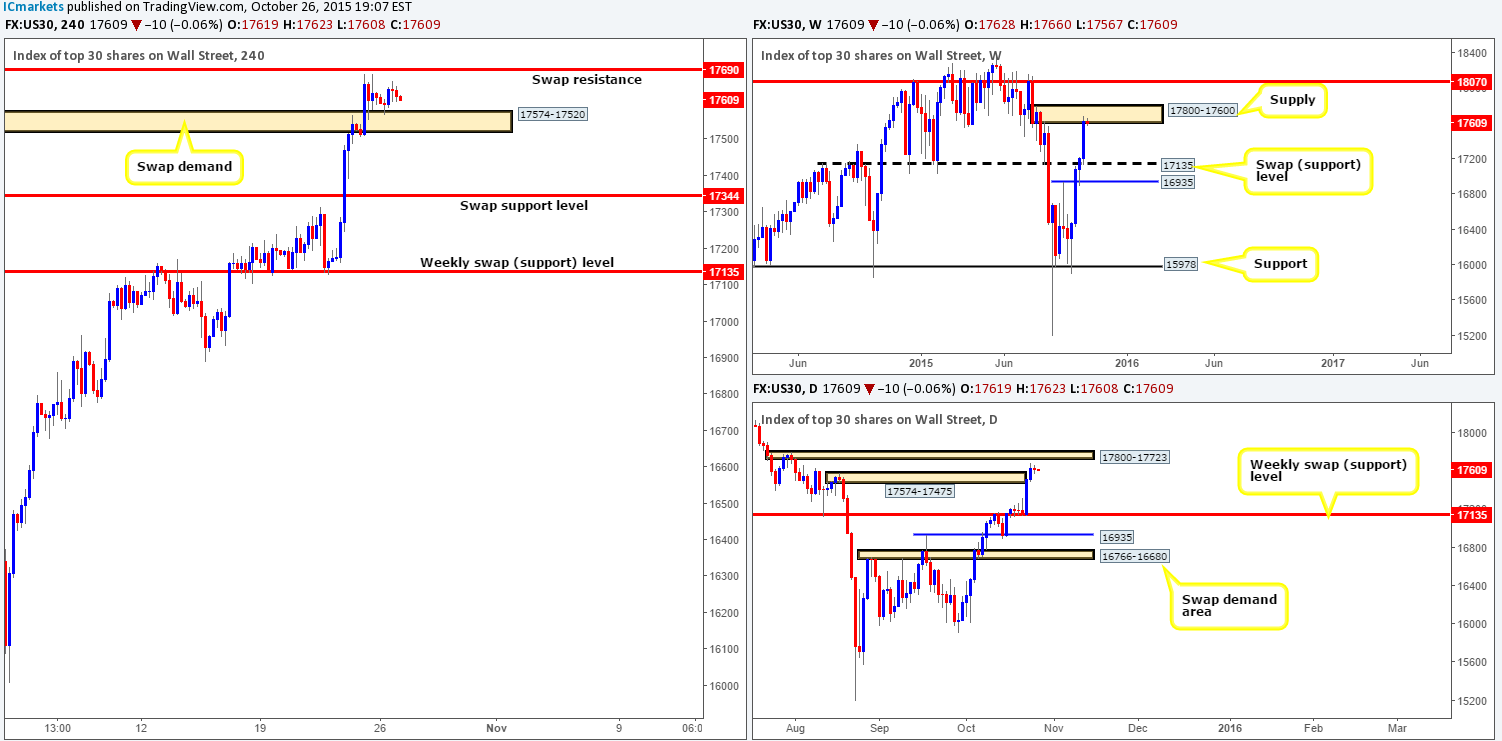
DOW 30: (We still have a LIVE short in the market from 17527 with our stop at 17830 [above weekly supply]).
The DOW, as you can see, was relatively sluggish during the course of yesterday’s sessions. Overall, we saw price stab into the swap demand zone coming in at 17574-17520, managing to record a session high of 17660. Consequent to yesterday’s rather lackluster performance, much of the following analysis will remain similar to the previous.
As we write, weekly action still resides at the underside of supply drawn from 17800-17600, whilst on the daily timeframe, there is room for price to appreciate a little further up to supply coming in at 17800-17723 (located deep within the aforementioned weekly supply).
Taking all of the above into consideration, here is what we have jotted down so far:
- It is very possible price will attack the 4hr swap (resistance) level at 17690 today seen directly above the aforementioned swap demand zone. However, placing a pending sell order here is very risky indeed. Reason being is that above this hurdle sits the daily supply zone mentioned above at 17800-17723. Therefore, do expect a fakeout above this 4hr level before considering a short!
- In the event that price closes below the 4hr swap demand area at 17574-17520 today, we feel the DOW will likely head lower to at least the swap support level at 17344 (a nice target for any intraday shorts). That being the case, should price retest the underside of this barrier and show some form of lower timeframe selling strength here, we may consider shorting this market, adding to our current position from 17527.
Levels to watch/ live orders:
- Buys: Flat (Stop loss: N/A).
- Sells: 17527 [LIVE] (Stop loss: 17830) 17690 [Tentative – confirmation required] (Stop loss: dependent on where one confirms this level since a fakeout up to daily supply at 17800-17723 is highly possible) watch for bids to be consumed around 17574-17520 and then look to trade any retest seen at this area (confirmation required).
XAU/USD: (Gold)
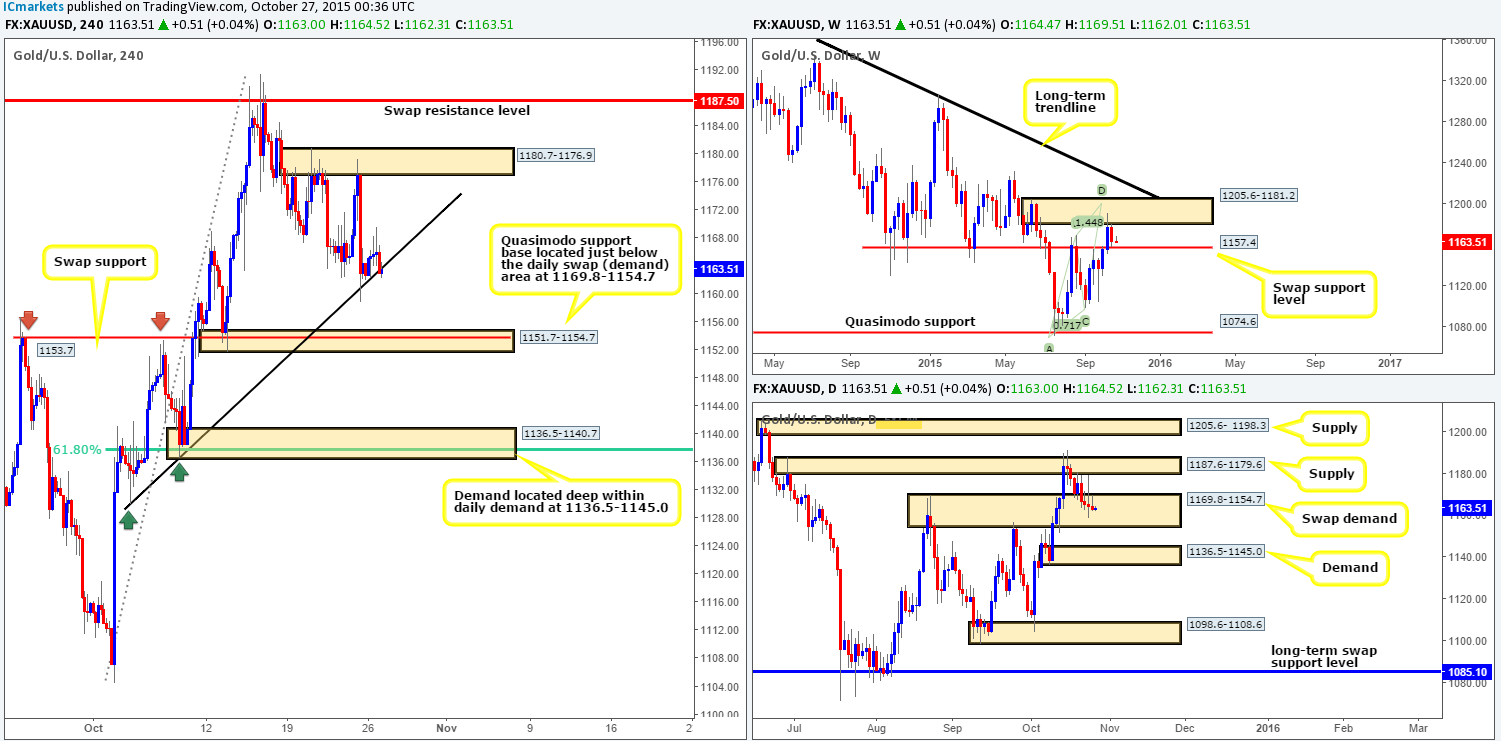
Throughout the course of yesterday’s sessions, we can see that Gold bounced from trendline support (extended from the low 1130.0), stretching to highs of 1169.9 on the day, before crashing lower and slightly closing below this line by the day’s end.
Whether the close below this trendline is legit or not is very difficult to say at this time. Be that as it may, if the sellers do manage to hold prices lower, here are the areas we’ll be watching for trades:
- The Quasimodo support base at 1151.7-1154.7 is an interesting zone. Not only does it have strong momentum from the base back on the 13th October, it also converges nicely with a swap support level at 1153.7 and is located just below the daily swap (demand) area at 1169.8-1154.7. We would consider an intraday long from here should lower timeframe confirmation also form.
- Demand at 1136.5-1140.7. This area is a beauty! It is located deep within daily demand mentioned above at 1136.5-1145.0, and also coincides nicely with the 61.8% Fibonacci level at 1137.7. Dependent on the time of day, we would consider a market buy here!
In the event that the close below the 4hr trendline was simply a fakeout to move higher, however, we’ll then be eyeing the resistance area at 1180.7-1176.9, followed closely by the swap resistance level above it at 1187.5. Although both areas are located within the boundaries of daily supply at 1187.6-1179.6, entering at market here would be risky in our opinion. Notice that daily supply area has already been breached (15/10/15) thus indicating potential weakness. This is not to say a reaction will not be seen from either of the above said 4hr areas, it is just we’d feel more comfortable shorting WITH lower timeframe confirmation than blindly entering short at market and hoping for the best.
Levels to watch/ live orders:
- Buys: 1151.7-1154.7 [Tentative – confirmation required] (Stop loss: dependent on where one confirms this area) 1136.5-1140.7 [Tentative – confirmation required] (Stop loss: dependent on where one confirms this area).
- Sells: 1180.7-1176.9 [Tentative – confirmation required] (Stop loss: dependent on where one confirms this area) 1187.5 [Tentative – confirmation required] (Stop loss: dependent on where one confirms this level).


