EUR/USD:
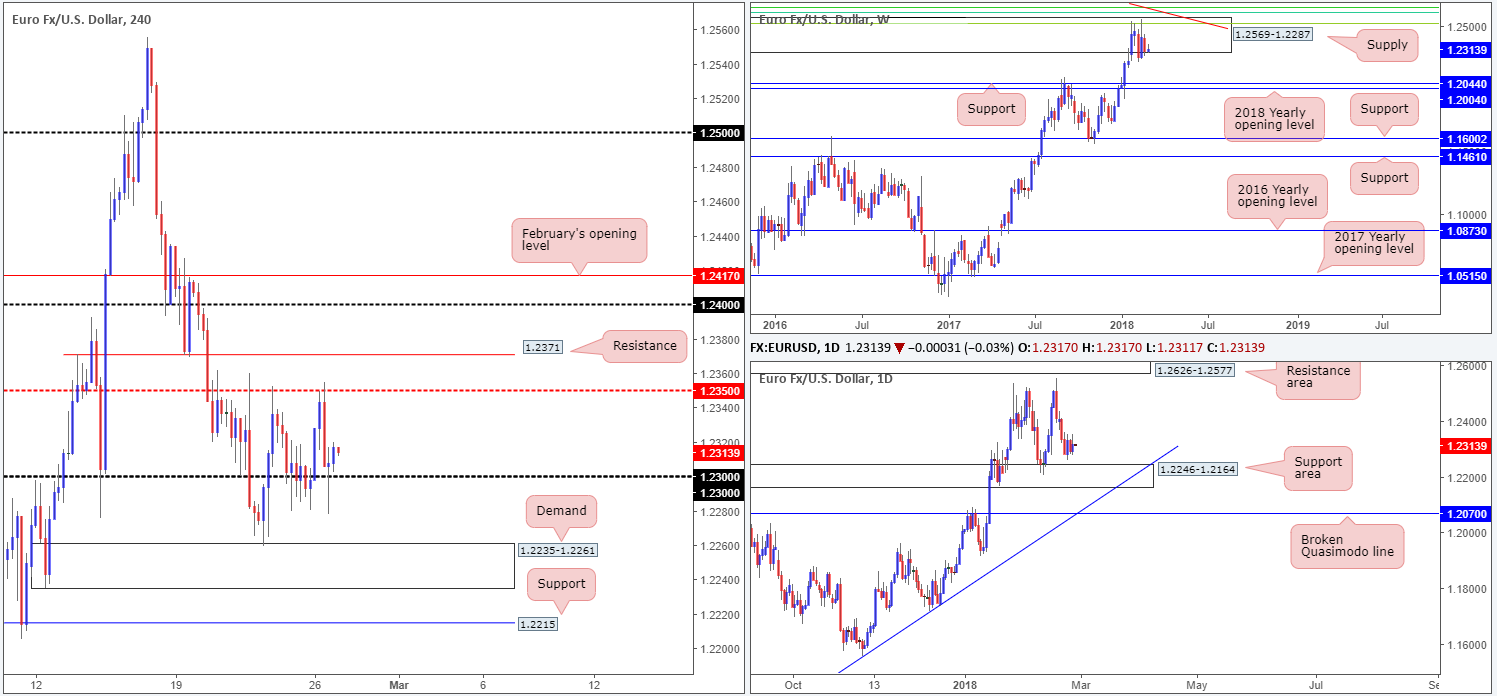
Since last Tuesday, the single currency has been carving out a range amid the H4 mid-level resistance barrier at 1.2350 and the 1.23 handle. Overhead, we have a nearby H4 resistance planted at 1.2371, whereas below there’s a H4 demand zone at 1.2235-1.2261 (tested last Thursday).
Mondays are notorious for being slow. This – coupled with Draghi’s testimony being a non-event – there was little to shout about in terms of movement.
Weekly price remains trading around the lower limits of a major weekly supply area coming in at 1.2569-1.2287, and indicates that there’s room to push as far south as weekly support plugged in at 1.2044. Meanwhile, looking down to the daily candles we can see that price continues to hover a few pips ahead of a daily support area registered at 1.2246-1.2164. Given that this zone dates back to as far as Dec 2014 and has already proved its worth on two occasions this year; this is not an area to overlook.
Potential trading zones:
With weekly sellers looking to punch lower and daily buyers likely to try and defend the nearby support zone, this remains a tricky market to trade at the moment, especially for those looking for medium to long-term positions. In addition to this, as we hope we demonstrated above and on the chart, H4 movement is also somewhat restricted at this time.
So, given the above, we have labeled this market a limited mover for now. Hopefully with Powell taking to the stage for the first time as Fed Chair, this could stir things up and disrupt current structure.
Data points to consider: German Buba President Weidmann speaks at 10am; Fed Chair Powell testifies at 1.30pm; US consumer confidence at 3pm GMT.
Areas worthy of attention:
Supports: 1.23 handle; 1.2235-1.2261; 1.2246-1.2164; 1.2044.
Resistances: 1.2350; 1.2371.
GBP/USD:
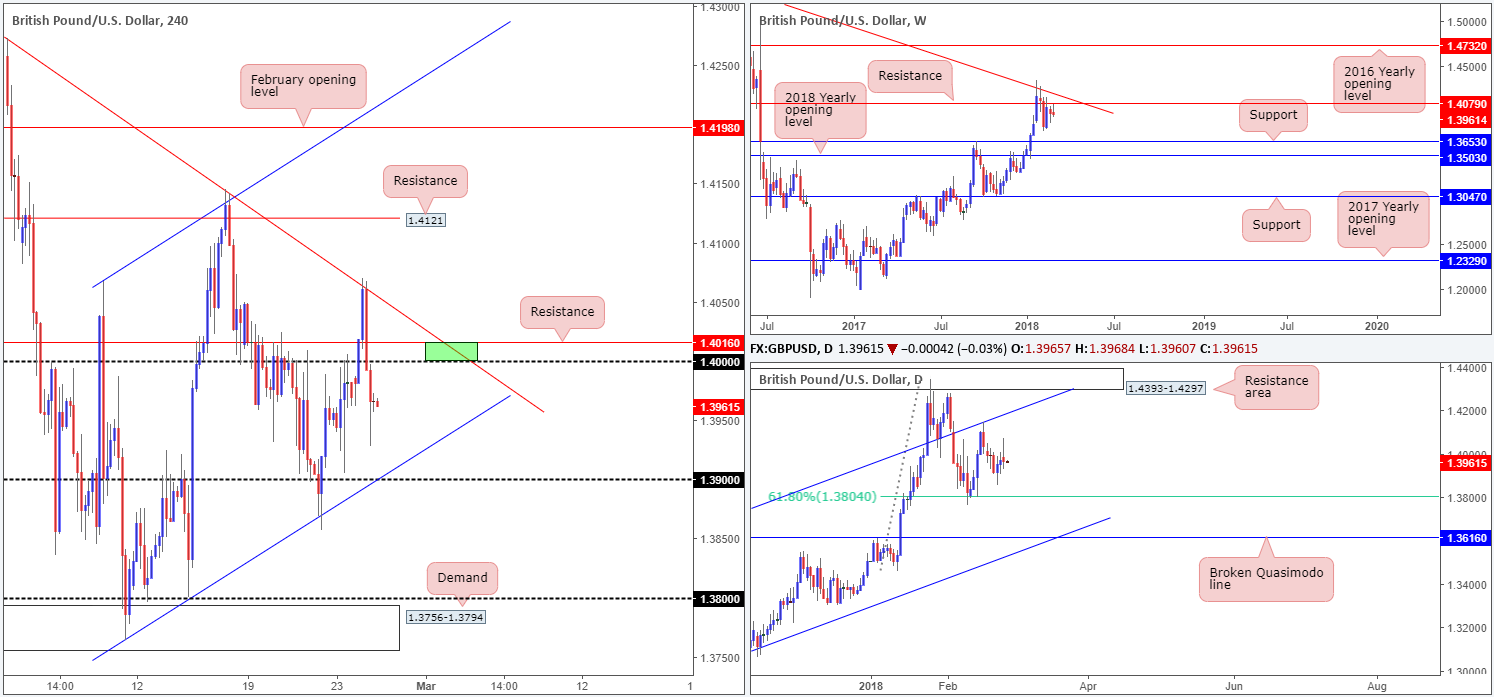
In recent sessions, the GBP/USD rushed through offers at the 1.40 handle on hopes of an orderly Brexit. However, things quickly took a turn for the worse as H4 price shook hands with a nice-looking H4 trendline resistance extended from the high 1.4345. In the shape of a near-full-bodied H4 bearish candle, the pair aggressively retook 1.40 and clocked lows of 1.3928. Also worth noting is that recent movement came within a few pips of connecting with a weekly resistance level seen at 1.4079. Daily price, nevertheless, did not appear to have much involvement yesterday from a technical standpoint, as the candles continue to trade mid-range between a daily channel resistance taken from the high 1.2903 and a 61.8% daily Fib support at 1.3804.
Potential trading zones:
We really like the look of the small H4 area between 1.4016 (a H4 resistance) and the 1.40 band marked in green, since it merges with the aforementioned H4 trendline resistance. The rationale behind this setup comes from the assumption that stop-loss orders and breakout buyers’ orders are positioned a few pips above 1.40. Once these orders are filled they become buys (liquidity for those looking to short).
The H4 resistance, alongside the H4 trendline resistance, therefore, could be an area bigger players look to short from given the available liquidity!
As such, make sure to keep an eyeball on 1.4016/1.40 today, traders.
Data points to consider: Fed Chair Powell testifies at 1.30pm; US consumer confidence at 3pm GMT.
Areas worthy of attention:
Supports: 1.39 handle; H4 trendline support; 1.3804.
Resistances: 1.4079; 1.40 handle; 1.4016; daily channel resistance; H4 trendline resistance.
AUD/USD:
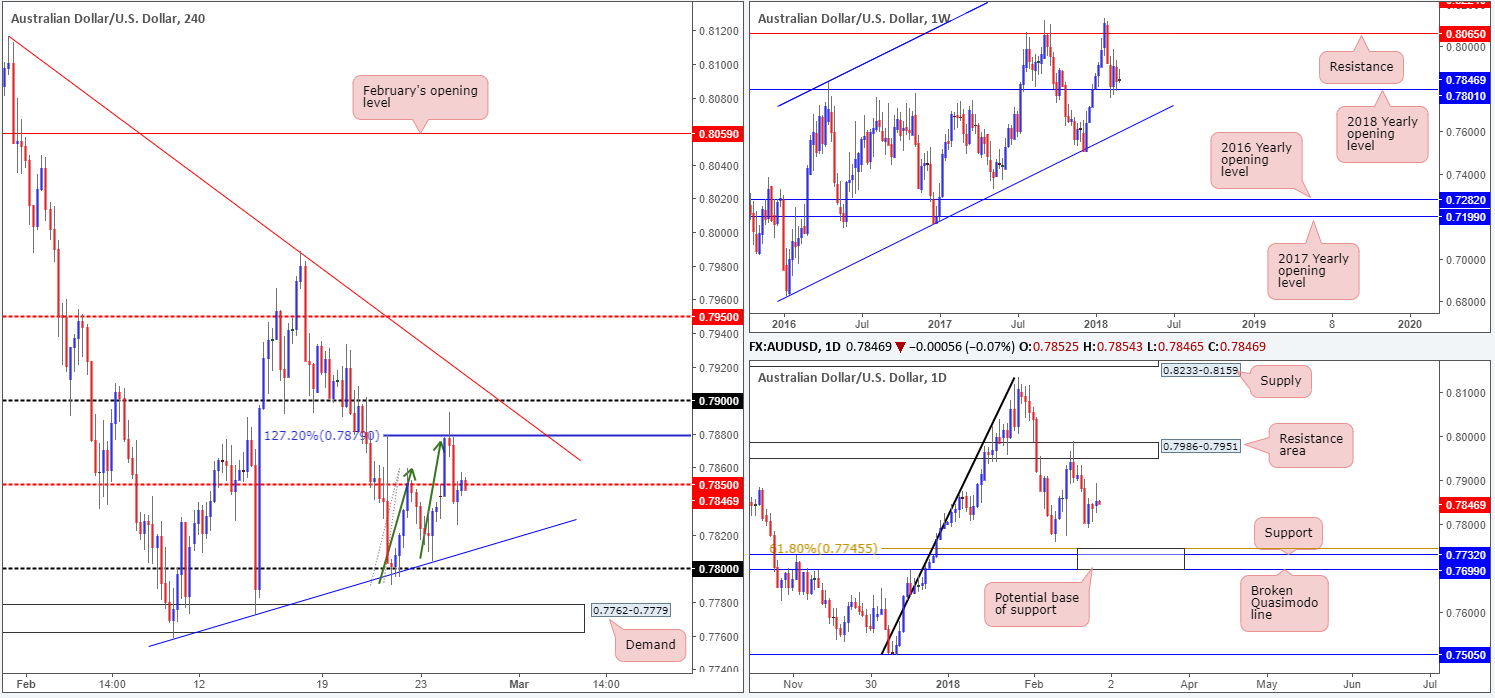
The buyers managed to find their feet early on in the day yesterday, conquering a H4 mid-level resistance barrier at 0.7850. As you can see, though, H4 price failed to reach the 0.79 boundary. Selling pressure from the H4 AB=CD (see green arrows) 127.2% Fib ext. point at 0.7879 proved to be too much, capping upside and eventually forcing the H4 candles back beneath the 0.7850 mark.
With 0.7850 looking somewhat fragile at the moment, there’s a chance that the H4 trendline support etched from the low 0.7758/0.78 handle could be brought into the fray today. The important thing to consider here is that 0.78 also represents a key level on the weekly timeframe: the 2018 yearly opening level at 0.7801. A break below 0.7801 likely opens the gates for weekly price to challenge a weekly channel support taken from the low 0.6827. Before this area is achieved, though, daily price will need to chomp through a daily support area at 0.7699/0.7745.
Potential trading zones:
A short beneath 0.7850 is not a trade we’d expect much from, given how close we’re trading to a major weekly support!
A long from the 0.78 band could be an option, but one would need to be prepared for a potential fakeout down to a H4 demand at 0.7762-0.7779, or an even deeper push down to the top edge of the noted daily support area at 0.7745!
For now, we do not have much to highlight in terms of trading opportunities. Well, not any that offers strong confluence, that is.
Data points to consider: Fed Chair Powell testifies at 1.30pm; US consumer confidence at 3pm GMT.
Areas worthy of attention:
Supports: 0.78 handle; H4 trendline support; 0.7801; 0.7699/0.7745.
Resistances: 0.7850; 0.7879; 0.79 handle.
USD/JPY:
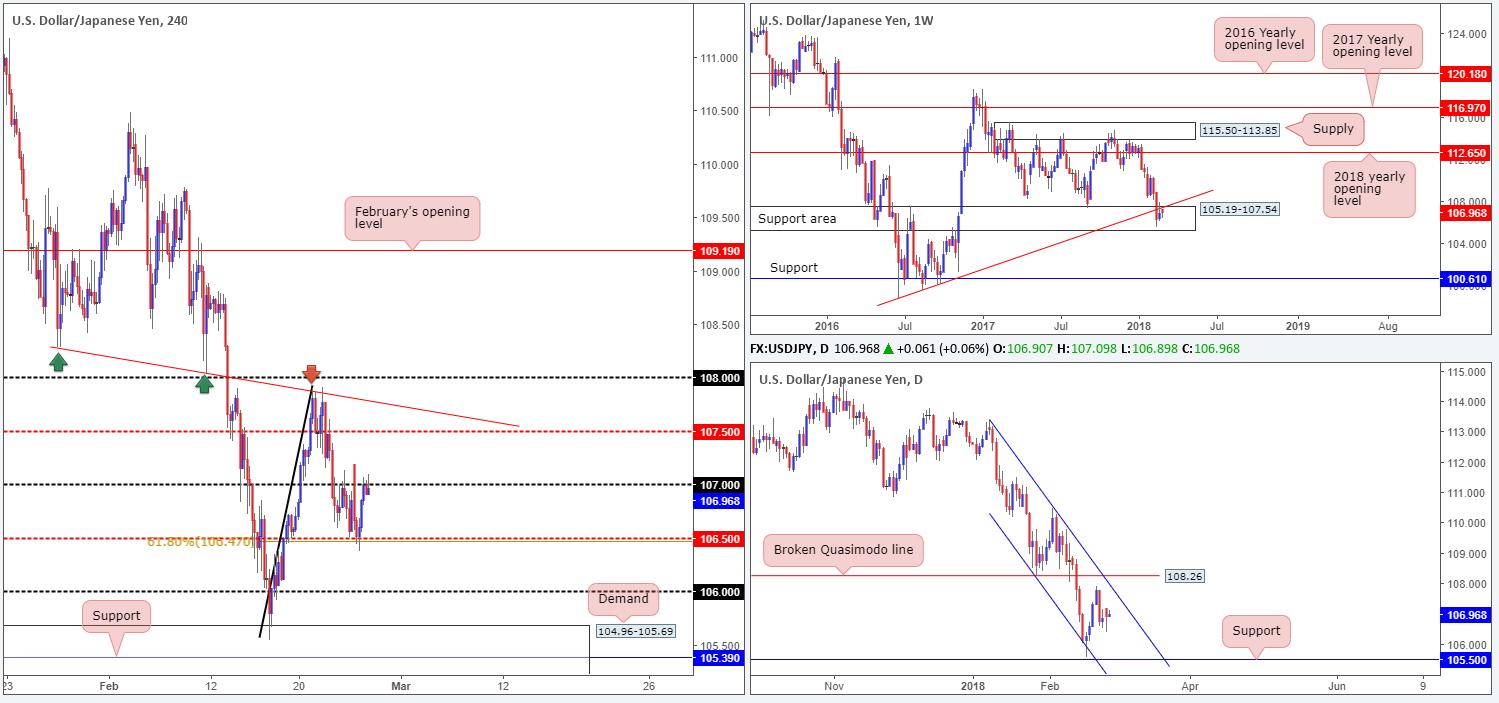
In the opening hours of trade on Monday, the USD/JPY gapped to a high of 107.19 but was quickly met with an onslaught of sellers, following talking points from the BoJ Gov. Kuroda. The move filled the weekend gap and saw the H4 candles challenge (and respect) the mid-level H4 support at 106.50, which happens to align beautifully with a H4 Fib 61.8% support at 106.47.
With Monday’s session concluding around the underside of the 107 handle, and H4 price not really showing much intent to push lower from here, we could see a pop up to the 107.50ish mark sometime today. A few points to keep in mind here regarding 107.50:
- Although weekly price is seen trading from a weekly support area at 105.19-107.54, there is clear bearish interest being seen thanks to a weekly trendline support-turned resistance extended from the low 98.78, which converges with 107.50.
- Directly above 107.50 is a H4 trendline resistance taken from the low 108.28.
- On the daily picture, a move higher would bring the unit to within striking distance of a daily channel resistance extended from the high 113.38. This channel line is positioned reasonably close to 107.50.
Potential trading zones:
The 107.50 region is a nice-looking sell zone, in our opinion. Besides being located nearby a H4 trendline resistance, a weekly trendline resistance and a daily channel resistance, the trend is clearly pointing in a southerly direction. While looking for shorts may seem a little unwise given the current weekly support area, the confluence surrounding 107.50 is incredibly attractive and, therefore, worthy of attention.
Data points to consider: Fed Chair Powell testifies at 1.30pm; US consumer confidence at 3pm GMT.
Areas worthy of attention:
Supports: 106.50; 105.19-107.54.
Resistances: 107 handle; 107.50; H4 trendline resistance; weekly trendline resistance; daily channel resistance.
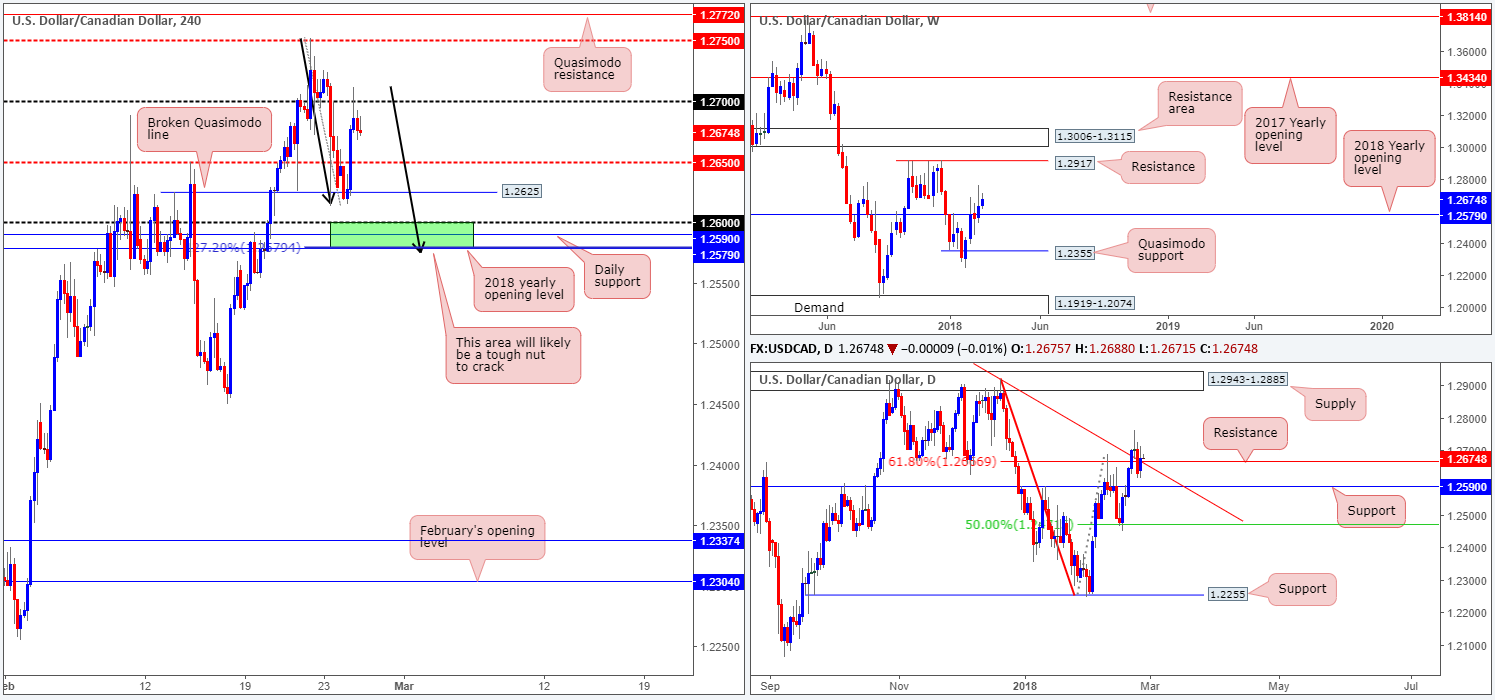
USD/CAD:
Coming in from the top this morning, the pair is seen making headway above the 2018 yearly opening level at 1.2579 on the weekly timeframe. The next port of call seen overhead comes in at 1.2917: a weekly resistance level that’s shadowed closely by a weekly resistance area at 1.3006-1.3115. Down on the daily timeframe, however, the unit is seen teasing a daily resistance band at 1.2674 that happens to merge nicely with a long-term daily trendline resistance taken from the high 1.3793. Although a marginal close above the resistance was seen yesterday, the team has yet to voice concern over this.
Thanks to the recent bout in buying from the H4 support level at 1.2625, the 1.27 handle was brought into the fray on Monday, which, as you can see, has so far held firm. Should further selling from this angle take place, our focus will remain on the green H4 zone at 1.2579/1.26 (1.26 handle, daily support at 1.2590, 2018 yearly opening level at 1.2579 and a H4 AB=CD 127.2% Fib ext. point at 1.2579).
Potential trading zones:
As already highlighted above, continued selling will place the 1.2579/1.26 area in view. This is certainly a zone one should consider as a potential platform for longs. Despite the strong confluence this area offers, traders still need to be prepared for a fakeout lower, due to the large amount of stops these levels will likely attract. Therefore, try to avoid entering on a pending order here. Waiting for additional candle confirmation is advised.
Data points to consider: Fed Chair Powell testifies at 1.30pm; US consumer confidence at 3pm GMT.
Areas worthy of attention:
Supports: 1.2625; 1.2650; 1.2579/1.26.
Resistances: 1.2666; 1.2917.
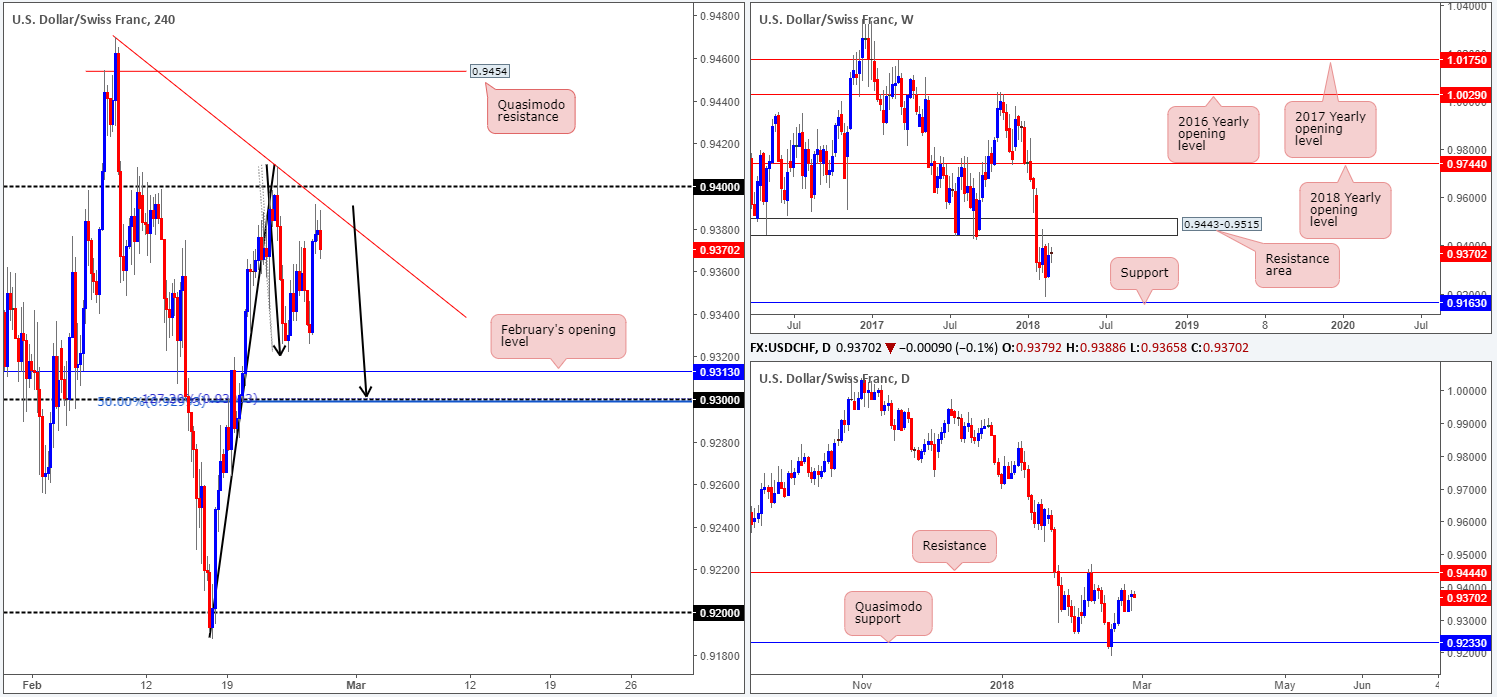
USD/CHF:
The USD/CHF, as you can see, struck highs of 0.9391 – a few pips ahead of a H4 trendline resistance extended from the high 0.9470 and 0.94 handle – following a jump from lows of 0.9325.
With H4 price seen mildly paring recent gains, our attention is drawn to the 0.93 handle seen positioned just beneath February’s opening level at 0.9313. As you can probably see from our chart, 0.93 also boasts a 50.0% support value and a H4 AB=CD (black arrows) 127.2% Fib ext. point. Therefore, this is a level to keep a tab on today should the unit continue pushing lower.
Meanwhile, over on the bigger picture, weekly price shows room to stretch up to the weekly resistance area plotted at 0.9443-0.9515. On the daily chart, the underside of the noted weekly resistance area is represented in the form of a daily resistance level coming in at 0.9444. Do keep an eyeball on these higher-timeframe areas should 0.94 be taken out.
Potential trading zones:
For longs: we have the 0.93 handle in view. Traders thinking of entering a pending buy order at this number may want to exercise caution since psychological bands are prone to fakeouts. An ideal scenario would be a fakeout through February’s opening level at 0.9313 into 0.93 (think bullish pin bar here). This, in our view, would be considered a strong bullish cue.
For shorts: we have eyes on the H4 Quasimodo resistance level marked at 0.9454. Why we like this level is simply because of where it’s positioned on the bigger picture: within the aforesaid weekly resistance area and a few pips above the current daily resistance.
Data points to consider: Fed Chair Powell testifies at 1.30pm; US consumer confidence at 3pm GMT.
Areas worthy of attention:
Supports: 0.93 handle; 0.9313.
Resistances: 0.94 handle; H4 trendline resistance; 0.9454; 0.9444; 0.9443-0.9515.
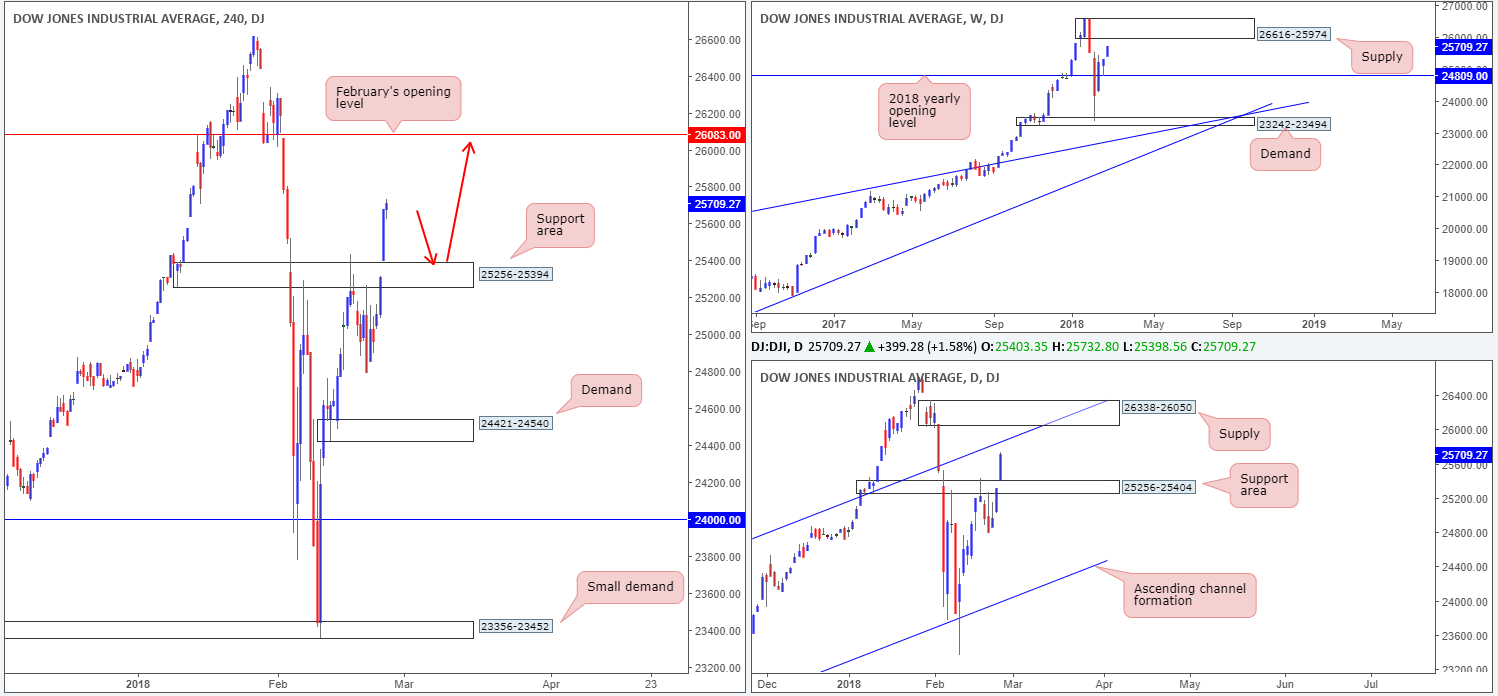
DOW 30:
US equities printed a strong near-full-bodied daily bull candle on Monday, placing the index above a daily resistance area at 25256-25404 (now acting support area). What this latest run also accomplished was placing the unit within striking distance of a daily channel resistance extended from the high 21169. Along similar lines, H4 price now shows room to push as far north as February’s open level at 26083 (after engulfing a H4 resistance area – now acting support) and weekly price shows upside is free until we reach the weekly supply zone printed at 26616-25974.
Potential trading zones:
Put simply, buying the dip on a retest of the recently broken H4 resistance area at 25256-25394 should be something to consider today given upside is free on all three timeframes we monitor. A retest of the H4 zone, followed up with a H4 full or near-full-bodied bull candle would, in our technical book, be enough to warrant a long trade in this market, targeting February’s opening level mentioned above at 26803.
Data points to consider: Fed Chair Powell testifies at 1.30pm; US consumer confidence at 3pm GMT.
Areas worthy of attention:
Supports: 25256-25394; 25256-25404.
Resistances: 26083; 26616-25974; daily channel resistance.
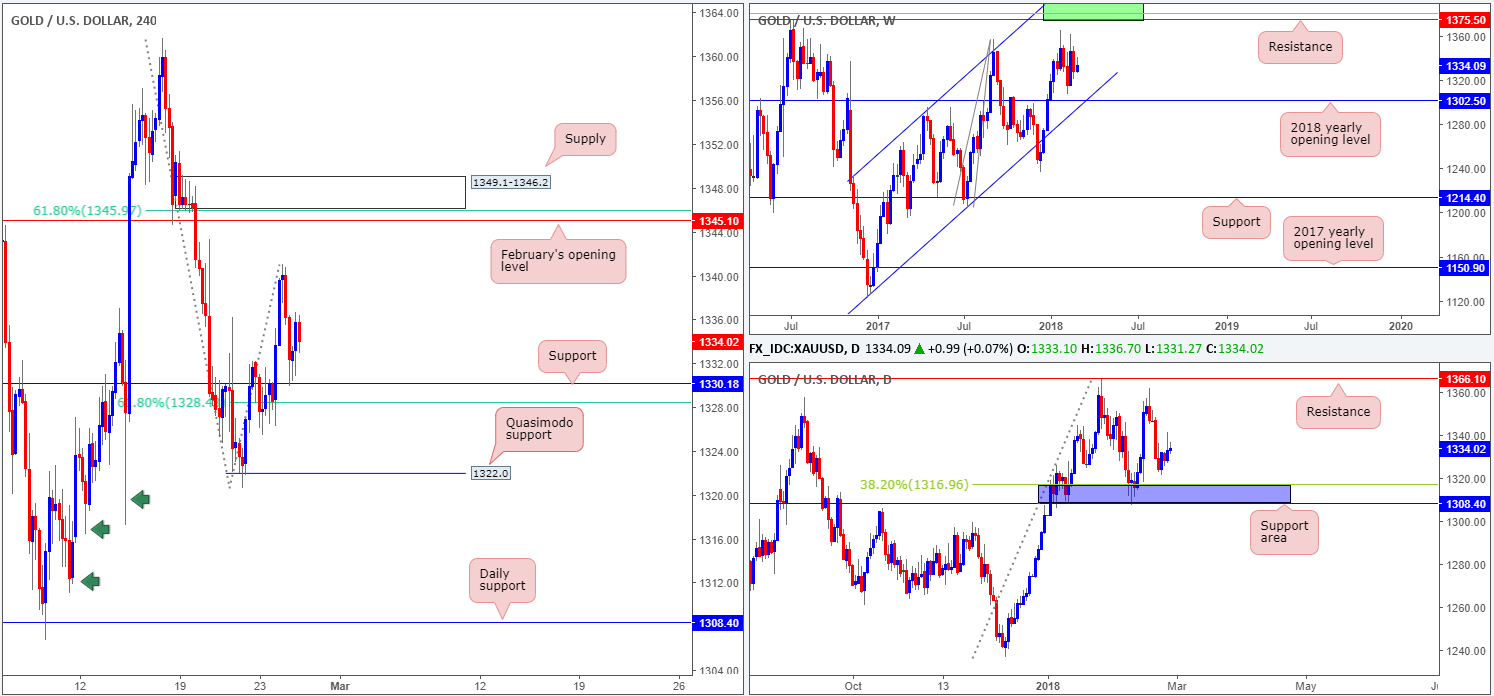
GOLD:
During the course of Monday’s segment, the yellow metal broke through H4 resistance at 1330.1 and later retested the line as support. With the piece holding firm at this level, it is possible that we may see a move up to February’s opening level seen on the H4 timeframe at 1345.1, which happens to align nicely with a H4 61.8% Fib resistance at 1346.0 and a H4 supply base at 1349.1-1346.2. Overall, though, the current H4 support band accommodates very little confluence other than a nearby H4 61.8% Fib support at 1328.4.
Higher-timeframe action shows us that weekly price remains hovering ahead of the 2018 yearly opening level at 1302.5, which combines with a weekly channel support extended from the low 1122.8. Daily action, despite an attempt to push higher yesterday, boasts limited support until we reach the daily support area painted in blue at 1308.4/1316.9 (comprised of a daily support and 38.2% Fib support level).
Potential trading zones:
The team places little weight on the current H4 support, despite positioned nearby a 61.8% Fib level. This is simply due to there being little higher-timeframe support located here.
February’s opening level mentioned above at 1345.1, on the other hand, could be somewhere to consider shorting for a bounce, given it has an additional base of resistance in the form of a H4 supply at 1349.1-1346.2. Though, do keep in mind that like above, this area lacks higher-timeframe backing, so waiting for additional candle confirmation may be something to consider.
Areas worthy of attention:
Supports: 1328.4/1330.1; 1308.4/1316.9; 1302.5; weekly channel support.
Resistances: 1345.1; 1345.9; 1349.1-1346.2.
This site has been designed for informational and educational purposes only and does not constitute an offer to sell nor a solicitation of an offer to buy any products which may be referenced upon the site. The services and information provided through this site are for personal, non-commercial, educational use and display. IC Markets does not provide personal trading advice through this site and does not represent that the products or services discussed are suitable for any trader. Traders are advised not to rely on any information contained in the site in the process of making a fully informed decision.
This site may include market analysis. All ideas, opinions, and/or forecasts, expressed or implied herein, information, charts or examples contained in the lessons, are for informational and educational purposes only and should not be construed as a recommendation to invest, trade, and/or speculate in the markets. Any trades, and/or speculations made in light of the ideas, opinions, and/or forecasts, expressed or implied herein, are committed at your own risk, financial or otherwise.
The use of the site is agreement that the site is for informational and educational purposes only and does not constitute advice in any form in the furtherance of any trade or trading decisions.
The accuracy, completeness and timeliness of the information contained on this site cannot be guaranteed. IC Markets does not warranty, guarantee or make any representations, or assume any liability with regard to financial results based on the use of the information in the site.
News, views, opinions, recommendations and other information obtained from sources outside of www.icmarkets.com.au, used in this site are believed to be reliable, but we cannot guarantee their accuracy or completeness. All such information is subject to change at any time without notice. IC Markets assumes no responsibility for the content of any linked site. The fact that such links may exist does not indicate approval or endorsement of any material contained on any linked site.
IC Markets is not liable for any harm caused by the transmission, through accessing the services or information on this site, of a computer virus, or other computer code or programming device that might be used to access, delete, damage, disable, disrupt or otherwise impede in any manner, the operation of the site or of any user’s software, hardware, data or property.


