Waiting for lower timeframe confirmation is our main tool to confirm strength within higher timeframe zones, and has really been the key to our trading success. It takes a little time to understand the subtle nuances, however, as each trade is never the same, but once you master the rhythm so to speak, you will be saved from countless unnecessary losing trades. The following is a list of what we look for:
- A break/retest of supply or demand dependent on which way you’re trading.
- A trendline break/retest.
- Buying/selling tails/wicks – essentially we look for a cluster of very obvious spikes off of lower timeframe support and resistance levels within the higher timeframe zone.
We typically search for lower-timeframe confirmation between the M15 and H1 timeframes, since most of our higher-timeframe areas begin with the H4. Stops are usually placed 1-3 pips beyond confirming structures.
EUR/USD:
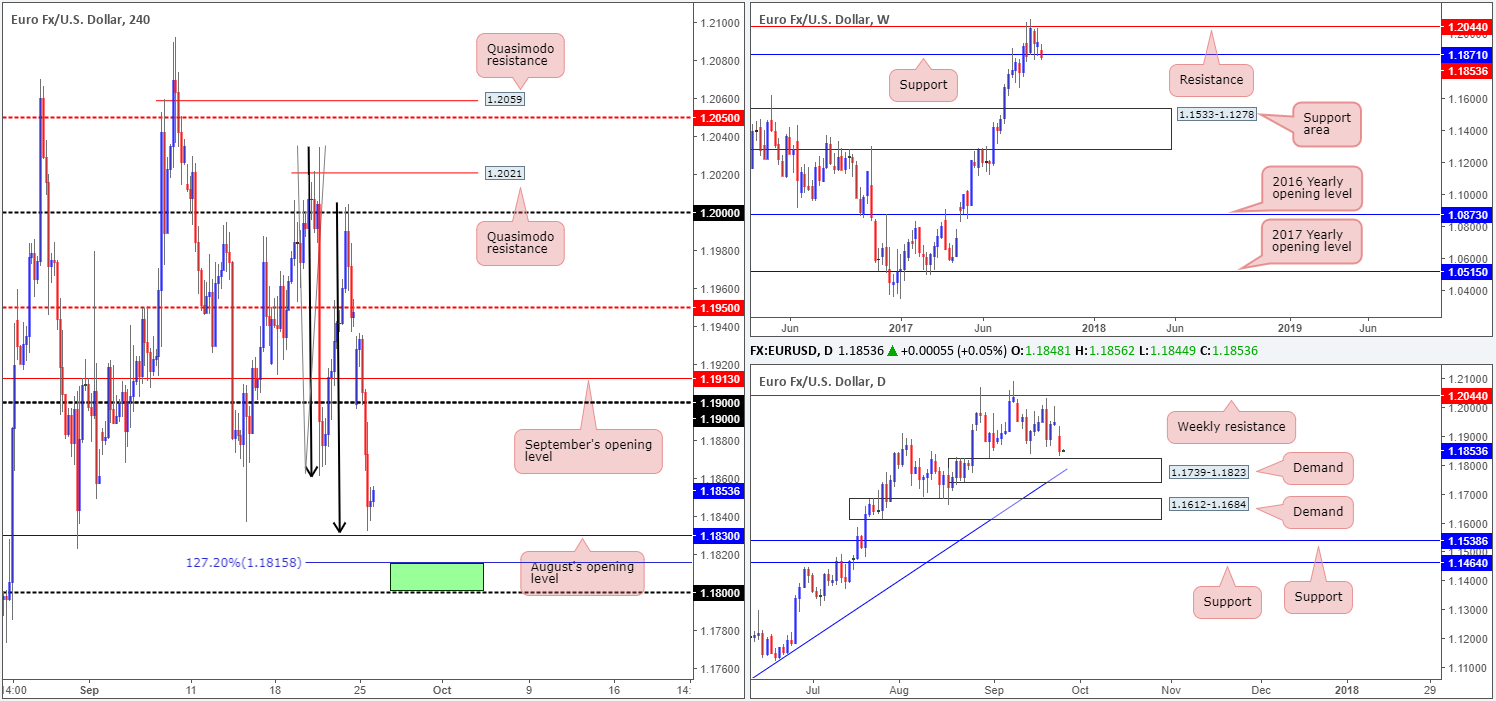
Despite a strong bounce materializing from the 1.19 handle in opening trade on Monday, the single currency remained under pressure from the results of the German elections. After H4 price conquered the 1.19 support in early London the unit aggressively tumbled lower, consequently ending the day bottoming just ahead of August’s opening level at 1.1830. Also noteworthy here is the H4 AB=CD symmetry denoted by the black arrows, the nearby daily demand zone pegged at 1.1739-1.1823 and current weekly support marked at 1.1871.
Suggestions: On the whole, we do believe the EUR is likely headed higher. Not only because of the clear technical support in place, but also due to the strong uptrend the major has been in since the beginning of the year. However, before this we may see the pair surpass August’s opening level to test the top edge of the noted daily demand base (between the H4 AB=CD 127.2% mark at 1.1815 and the 1.18 handle looks a nice reversal point [green zone]).
Should price challenge the green H4 buy zone today and chalk up a reasonably sized H4 bull candle, preferably in the shape of a full, or near-full-bodied candle, the odds of price rallying back up to 1.1850/1.19 are high, in our view.
Data points to consider: US CB Consumer confidence along with New home sales at 3pm; FOMC member Brainard speaks at 3.30pm, followed by Fed Chair Yellen at 5.45pm GMT+1.
Levels to watch/live orders:
- Buys: 1.18/1.1815 ([waiting for a reasonably sized H4 bullish candle to form – preferably a full, or near-full-bodied candle – is advised] stop loss: ideally beyond the candle’s tail).
- Sells: Flat (stop loss: N/A).
GBP/USD:
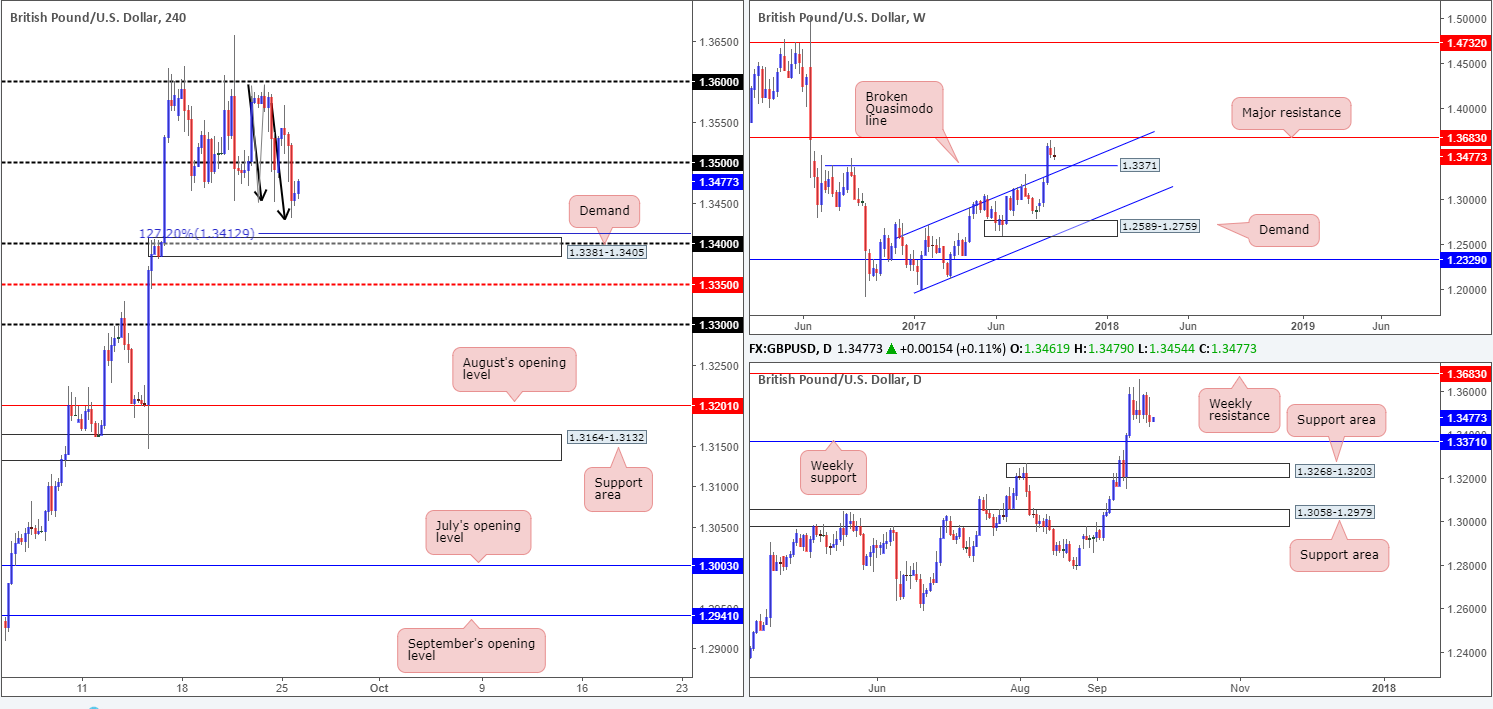
Sizing up the weekly chart this morning, we can see that the candles remain trading between a major resistance coming in at 1.3683 and a broken Quasimodo line at 1.3371/channel resistance-turned support extended from the high 1.2706.
On the H4 timeframe, recent events show the 1.35 handle was taken out amid yesterday’s US open, forcing price to clock a session low of 1.3431. In a similar fashion to the EUR/USD, the GBP has also chalked up a reasonably nice-looking AB=CD bullish structure (black arrows). From this angle, it’d be difficult to rule out the possibility of an upside attempt to retest 1.35 today, but we feel that the unit may want the H4 demand base seen below at 1.3381-1.3405 before serious buyers step in. Not only does the area converge with the AB=CD’s 127.2% extension at 1.3413, it has a round number lodged within at 1.34 and sits directly above the noted broken weekly Quasimodo line.
Suggestions: Put simply, we will not be looking to long this market UNTILL H4 price has shook hands with the aforesaid H4 demand. A word of caution though, there is a strong possibility that this area may suffer a fakeout given the weekly support lurking just below it. For that reason, we would advise waiting for additional H4 candle confirmation before pulling the trigger.
Data points to consider: US CB Consumer confidence along with New home sales at 3pm; FOMC member Brainard speaks at 3.30pm, followed by Fed Chair Yellen at 5.45pm GMT+1.
Levels to watch/live orders:
- Buys: 1.3381-1.3405 ([waiting for a reasonably sized H4 bullish candle to form – preferably a full, or near-full-bodied candle – is advised] stop loss: ideally beyond the candle’s tail).
- Sells: Flat (stop loss: N/A).
AUD/USD:
Working our way down from the top this morning, the commodity currency clearly remains under pressure, which could force the unit in the direction of a support area carved from 0.7849-0.7752. Meanwhile, daily action shows the recently engulfed support at 0.7955 is holding ground as resistance. Provided that the bears continue to defend this line, daily demand at 0.7786-0.7838 is likely going to be the next port of call on this scale (seen plotted within the walls of the noted weekly support area).
The story on the H4 timeframe, nevertheless, is somewhat restricted. In recent trading, the candles breached September’s opening level at 0.7939 and potentially opened up the river south down to nearby Quasimodo support at 0.7917, shadowed closely by the 0.79 handle.
Suggestions: Although both weekly and daily charts indicate further selling may be on the cards, shorting H4 price is risky according to structure. Just 22 pips down from September’s opening level is the first area of concern (the H4 Quasimodo). Therefore, it would take an incredibly small stop to accommodate suitable risk/reward here! For this reason, our desk will refrain from taking any short positions at this time.
Data points to consider: US CB Consumer confidence along with New home sales at 3pm; FOMC member Brainard speaks at 3.30pm, followed by Fed Chair Yellen at 5.45pm GMT+1.

Levels to watch/live orders:
- Buys: Flat (stop loss: N/A).
- Sells: Flat (stop loss: N/A).
USD/JPY:
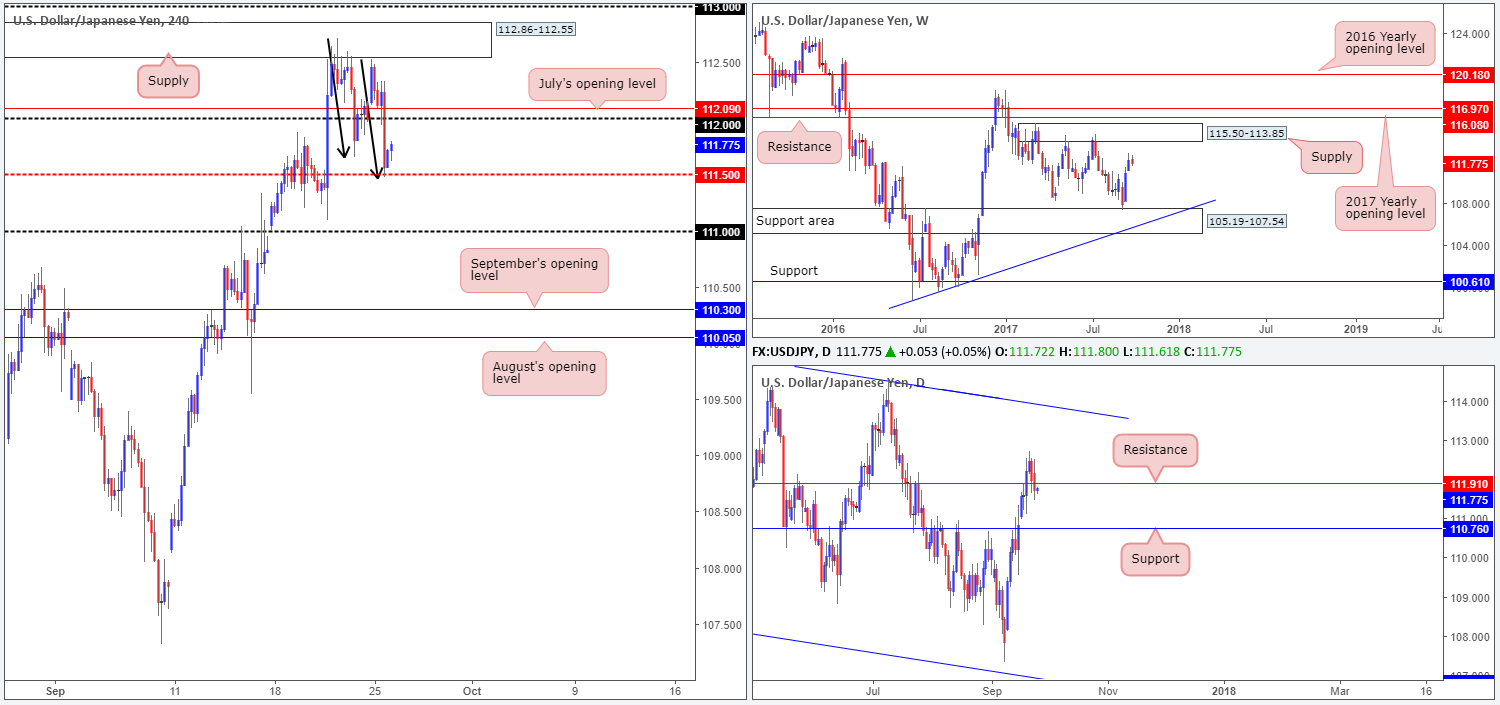
As can be seen from the H4 chart this morning, the USD/JPY stabilized around the mid-way support 111.50 (fuses with AB=CD bullish structure taken from the high 112.71 [black arrows]) after aggressively storming through the 112 handle.
Over on the bigger picture, weekly flow continues to reflect a bullish stance. In the event that this remains the case, the next upside target can be seen at a supply area drawn from 115.50-113.85. Conversely, however, the daily candles recently crossed below support at 111.91 and show potential to move down as far as support pegged at 110.76.
Suggestions: Entering long is a tricky beast right now. As of current price, we have only 25 pips of space to extend north until we collide with 112, followed closely by July’s opening level at 112.09. In addition to this, daily price portends further selling, while weekly price shows that further upside may be on the horizon.
On account of the above notes, there is not really much to hang our hat on at the moment and we feel it is best we remain on the sidelines for the time being.
Data points to consider: US CB Consumer confidence along with New home sales at 3pm; FOMC member Brainard speaks at 3.30pm, followed by Fed Chair Yellen at 5.45pm GMT+1.
Levels to watch/live orders:
- Buys: Flat (stop loss: N/A).
- Sells: Flat (stop loss: N/A).
USD/CAD:
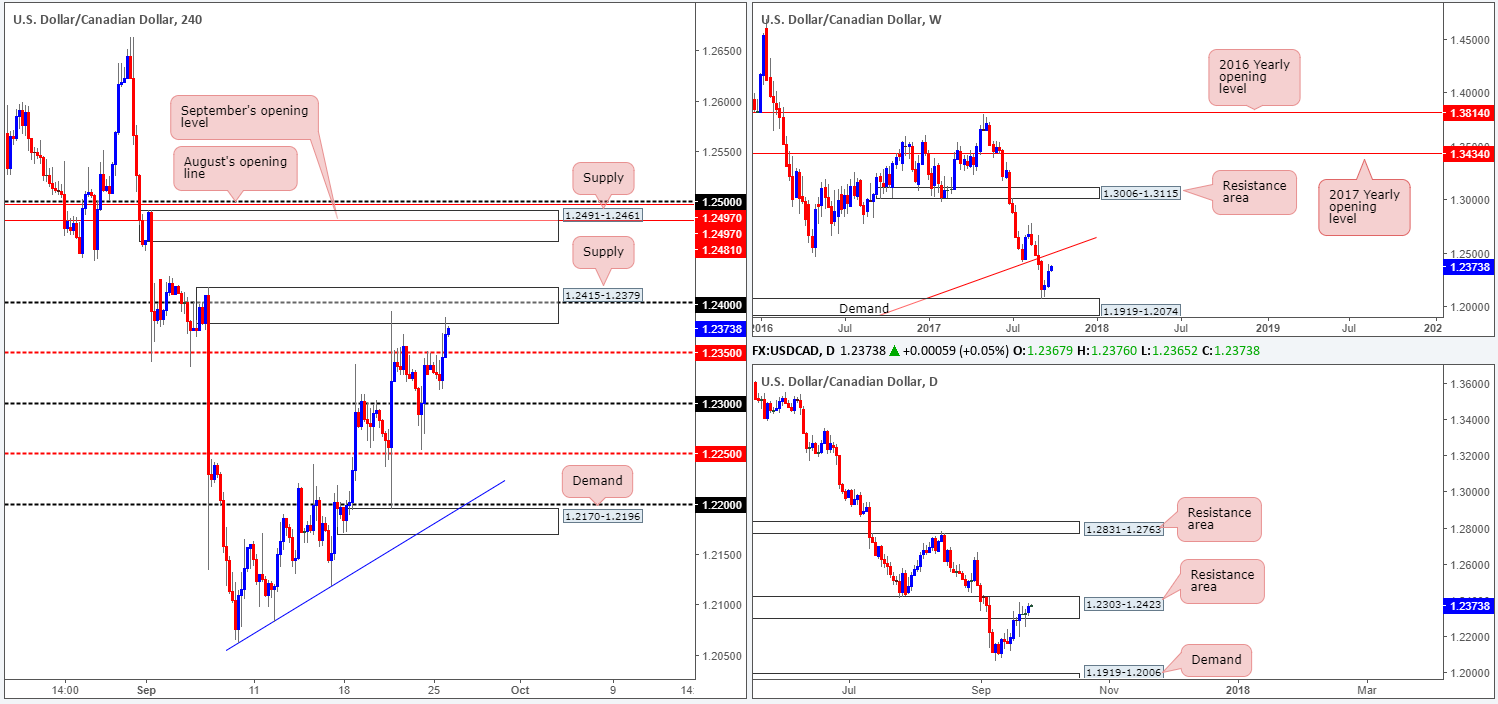
The USD/CAD, as you can see, switched tracks in early US trading yesterday. Offers at the H4 mid-level resistance 1.2350 were engulfed, allowing price to challenge H4 supply at 1.2415-1.2379 which fuses with the 1.24 handle, despite a rally in oil prices. Also of particular interest should be the fact that both of these areas are sited within a daily resistance area pegged at 1.2303-1.2423.
Be that as it may, before we all get too excited and punch the sell button, it might be worth noting that weekly price shows room to extend above the daily area to a long-term weekly trendline resistance extended from the low 0.9633.
Suggestions: Given the threat of further upside on the weekly scale, the team remains reluctant to sell at current prices. An area we would be interested in selling, however, is the H4 supply seen at 1.2491-1.2461. Not only is it surrounded by both September/August’s opening levels at 1.2497/1.2481 and the 1.25 handle, it also intersects nicely with the noted weekly trendline resistance.
As H4 price could potentially fake above 1.2491-1.2461 to attack offers at 1.25, we would advise waiting for a reasonably sized H4 bear candle to take shape from here (preferably a full, or near-full-bodied candle), before pulling the trigger.
Data points to consider: US CB Consumer confidence along with New home sales at 3pm; FOMC member Brainard speaks at 3.30pm, followed by Fed Chair Yellen at 5.45pm GMT+1.
Levels to watch/live orders:
- Buys: Flat (stop loss: N/A).
- Sells: 1.2491-1.2461 area ([waiting for a reasonably sized H4 bearish candle to form – preferably a full, or near-full-bodied candle – is advised] stop loss: ideally beyond the candle’s wick).
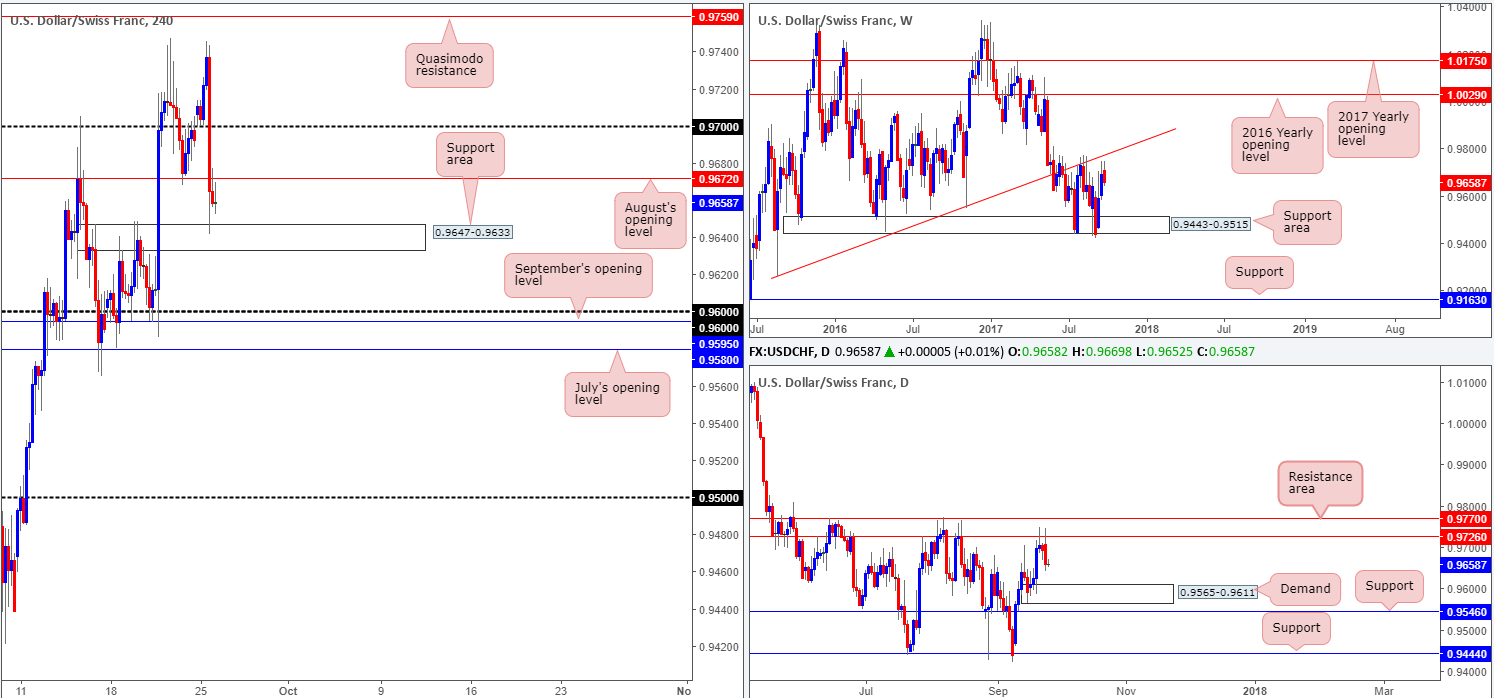
USD/CHF:
The value of the USD/CHF weakened in aggressive fashion on Monday after tapping a session high of 0.9745. Running through bids at the 0.97 handle and August’s opening level at 0.9672, the safe-haven pair was able to conclude the day shaking hands with a H4 support area at 0.9647-0.9633.
Although there were various fundamental drivers behind this latest move, the technicals likely had their part to play as well! Weekly price came within striking distance of connecting with a trendline resistance taken from the low 0.9257. Alongside this, we can also see that daily price is trading from a resistance area pegged at 0.9770/0.9726 and shows room to decline down to at least demand located at 0.9565-0.9611.
Suggestions: While the higher timeframe’s bias clearly points south right now, selling into the current H4 support area is not something we’d label as a high-probability move. Typically, what we would do in this case is wait for a H4 close to form beyond the current H4 support area and then look to trade any retest seen thereafter. Unfortunately, this is not possible here since not only do we have the top edge of the noted daily demand positioned at 0.9611 to contend with, we also have the 0.96 handle and September/July’s opening levels at 0.9595/0.9580 seen nearby as well.
Data points to consider: US CB Consumer confidence along with New home sales at 3pm; FOMC member Brainard speaks at 3.30pm, followed by Fed Chair Yellen at 5.45pm GMT+1.
Levels to watch/live orders:
- Buys: Flat (stop loss: N/A).
- Sells: Flat (stop loss: N/A).
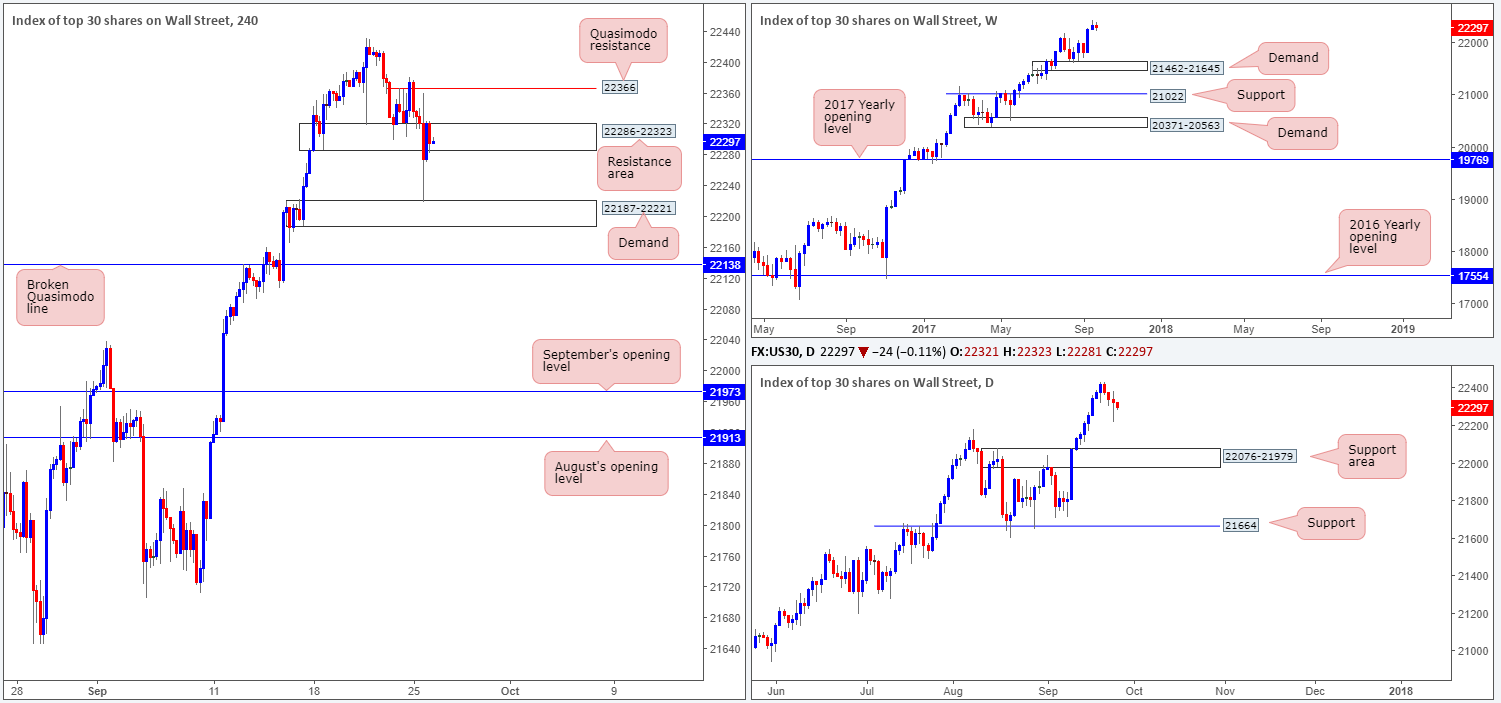
DOW 30:
Trade update: stopped out for a loss at 22279.
During the course of yesterday’s segment, US equities breached H4 demand at 22286-22323 and went on to challenge the H4 demand seen beneath it at 22187-22221. As you can see, the bounce from this area was strong enough to rotate the market back up to the recently broken H4 demand, which is now acting as resistance. Should H4 bulls overcome the current resistance area, nonetheless, the next port of call will likely be the minor Quasimodo resistance planted at 22366.
The key thing to remember here is this market remains entrenched within a strong uptrend, and is trading from record highs as we write i.e. there is absolutely no resistance seen on the higher timeframes!
Suggestions: A decisive H4 push above the aforesaid H4 Quasimodo resistance is, in our opinion, a strong indication that the bulls are ready to press to fresh record highs. And this is something we want to be a part of! Therefore, what we’re looking for is a H4 close beyond 22366, followed by a retest and a reasonably strong H4 bull candle in the shape of a full, or near-full-bodied candle.
Data points to consider: US CB Consumer confidence along with New home sales at 3pm; FOMC member Brainard speaks at 3.30pm, followed by Fed Chair Yellen at 5.45pm GMT+1.
Levels to watch/live orders:
- Buys: Watch for H4 price to close beyond 22366 and then look to trade any retest seen thereafter ([waiting for a H4 bullish rotation candle to form following the retest is advised] stop loss: ideally beyond the candle’s tail).
- Sells: Flat (stop loss: N/A).
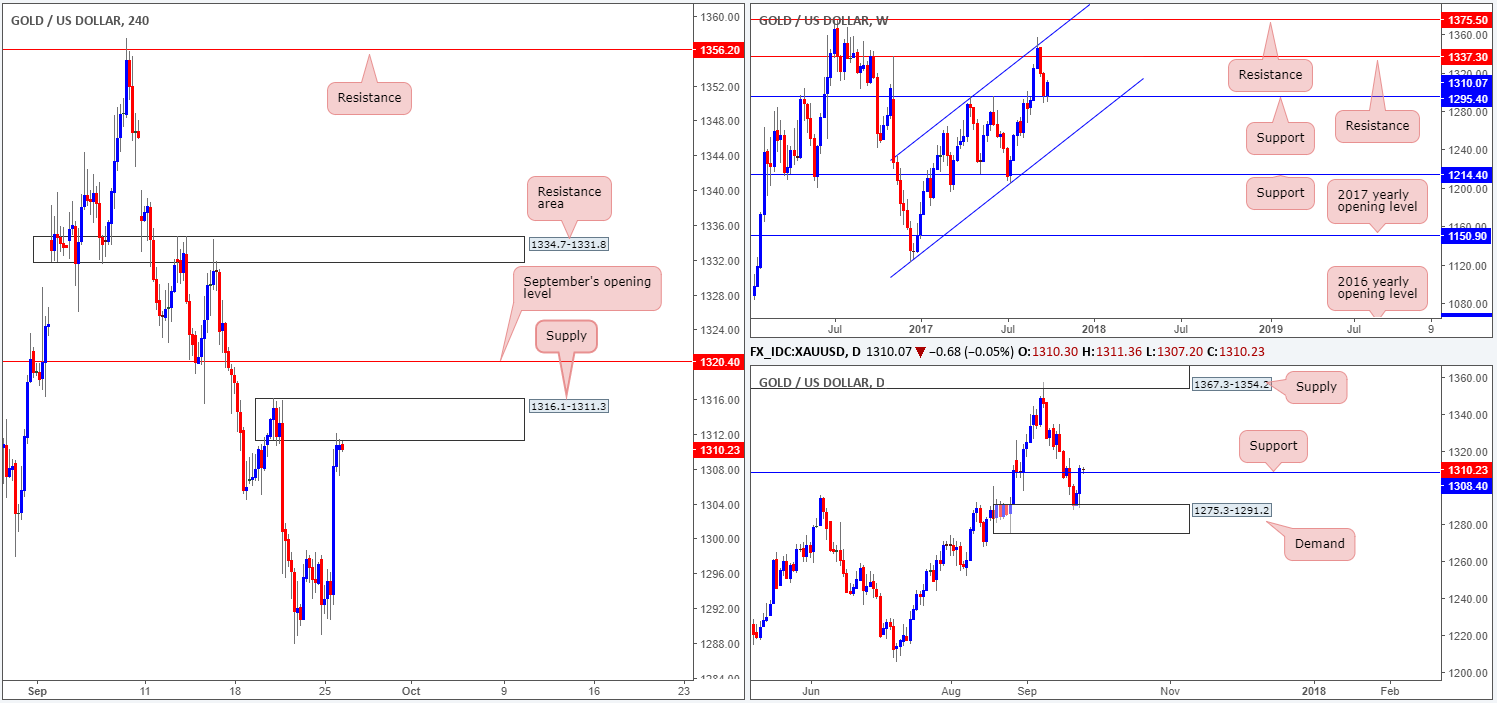
GOLD:
Eyeballing the weekly timeframe this morning, it’s clear to see that the bulls are beginning to show signs of a recovery from support penciled in at 1295.4. Assuming that the market continues to bid higher from here, the next area of interest can be seen at 1337.3: a resistance level. In conjunction with weekly flow, daily price extended Friday’s bounce from demand at 1275.3-1291.2 on Monday and ended the day marginally closing beyond resistance at 1308.4 (now acting support).
Sliding across to the H4 timeframe, nevertheless, things do not look quite as bullish as the bigger picture does right now. In current view, we have a strong-looking H4 supply zone at 1316.1-1311.3 in play, followed closely by September’s opening level at 1320.4. From our perspective, it will only be once these two H4 hurdles are consumed will the yellow metal be free to rally north up to a resistance area plugged at 1334.7-1331.8.
Suggestions: Keeping it Simple Simon this morning, we’re going to wait and see if H4 price can print a decisive close above both the current supply and September’s opening level. After this, and assuming that price retests 1320.4 as support, we would consider entering long and targeting 1334.7-1331.8.
Levels to watch/live orders:
- Buys: Watch for H4 price to close above 1320.4 and then look to trade any retest seen thereafter ([waiting for a H4 bullish candle to form following the retest is advised] stop loss: ideally beyond the candle’s tail).
- Sells: Flat (stop loss: N/A).


