Waiting for lower timeframe confirmation is our main tool to confirm strength within higher timeframe zones, and has really been the key to our trading success. It takes a little time to understand the subtle nuances, however, as each trade is never the same, but once you master the rhythm so to speak, you will be saved from countless unnecessary losing trades. The following is a list of what we look for:
- A break/retest of supply or demand dependent on which way you’re trading.
- A trendline break/retest.
- Buying/selling tails/wicks – essentially we look for a cluster of very obvious spikes off of lower timeframe support and resistance levels within the higher timeframe zone.
We typically search for lower-timeframe confirmation between the M15 and H1 timeframes, since most of our higher-timeframe areas begin with the H4. Stops are usually placed 1-3 pips beyond confirming structures.
EUR/USD:
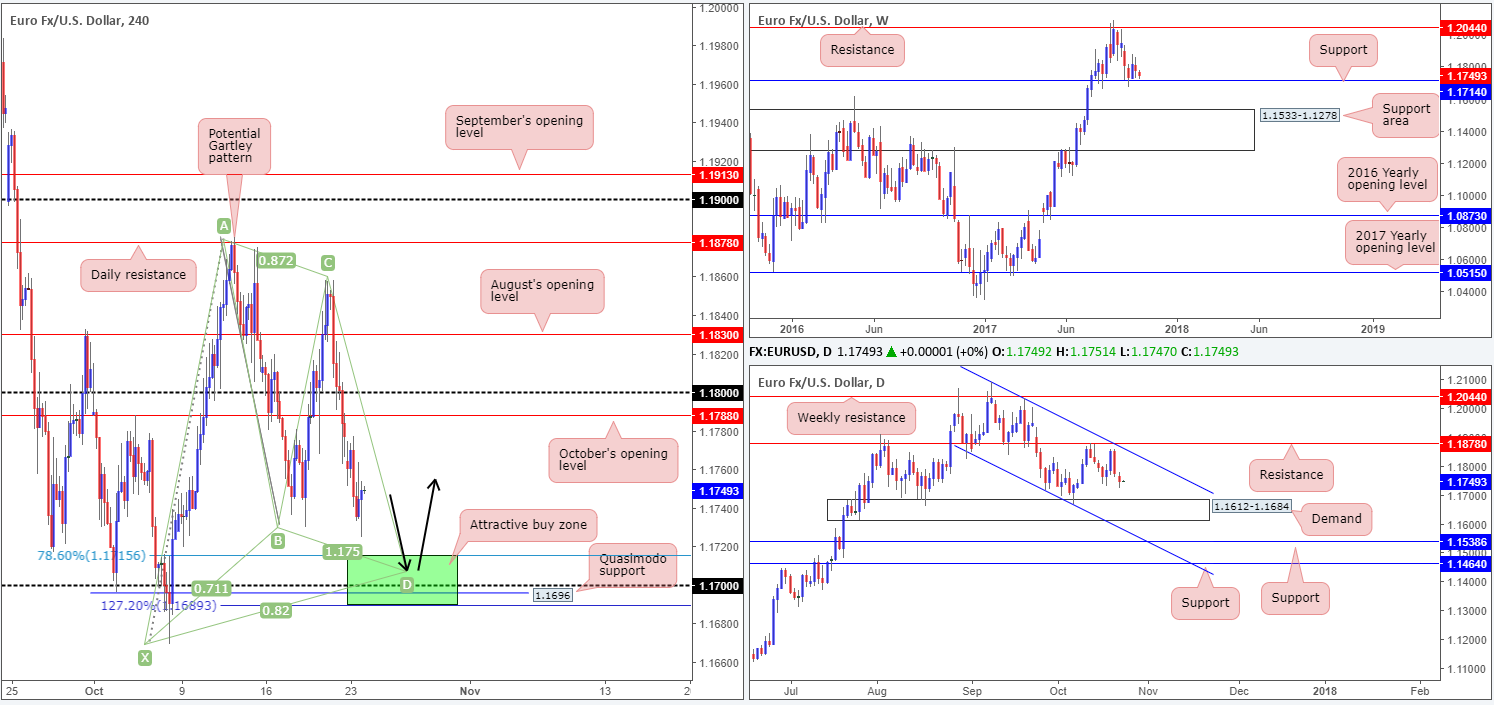
The value of the euro weakened for a second consecutive daily session on Monday, down -0.25% on the day. This has, as can be seen on the H4 timeframe, transported the candles down to just ahead of 1.1689/1.1715: a nice-looking buy zone (marked in green) which was underlined in Monday’s report.
Structures supporting the buy zone are as follows:
- A H4 Harmonic Gartley completion point at around 1.1708/1.1715.
- The 1.17 handle.
- A H4 Quasimodo support at 1.1696.
- A H4 127.2% Fib ext. at 1.1689 taken from the high 1.1880.
- Weekly support seen at 1.1714.
- Located just above the top edge of daily demand at 1.1612-1.1684.
Suggestions: Assuming that one enters inside the green area (the 1.17 handle looks nice) and sets stops below the X point of the H4 Harmonic Gartley pattern (1.1669), this, in our humble view, is a high-probability setup, and certainly one that we would have no qualms in taking should the opportunity arise. Unfortunately, it’s a little too early to determine take-profit targets as H4 price has yet to complete its approach.
Data points to consider: Eurozone manufacturing between 8-9am GMT+1.
Levels to watch/live orders:
- Buys: 1.1689/1.1715 (stop loss: 1.1667).
- Sells: Flat (stop loss: N/A).
GBP/USD:
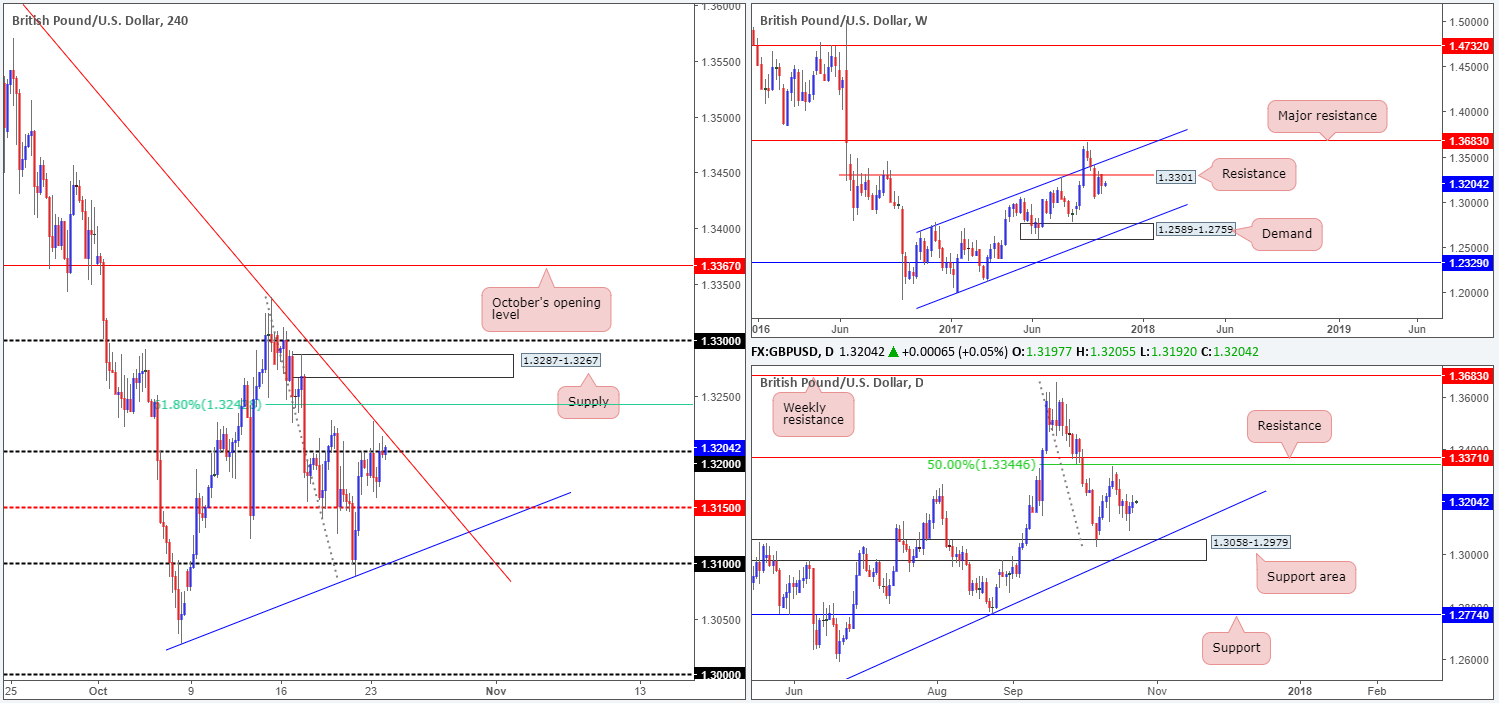
Despite H4 bulls failing to outmuscle the bears around the 1.32 handle on Monday, the session ended marginally in the green (+0.11%). Stop-loss orders above the psychological band have already likely been filled. Still, this technically only opens the doors a few pips up to a H4 trendline resistance drawn from the high 1.3657, which, as you can see, has already provided resistance.
Over on the bigger picture, weekly bears established reasonably firm resistance from the 1.3301 point. Further losses from this region would likely place weekly demand at 1.2589-1.2759 in the spotlight, along with a merging weekly channel support drawn from the low 1.1986. Moving down to the daily timeframe, movement remains hovering just above a support area at 1.3058-1.2979 that converges with a trendline support taken from the low 1.2108.
Suggestions: Given Monday’s somewhat lackluster performance, our outlook remains the same…
This market does not offer any noticeable confluence worthy of trading, as far as we can see. Of course, the unit could very well selloff from the 1.32 handle today, seeing as how weekly price is trading from resistance and daily price shows room to trade as far south as the support area mentioned above at 1.3058-1.2979. Still, this is not a high-probability setup, in our book. H4 price could just as easily push above 1.32 now and head for the H4 61.8% Fib resistance at 1.3243 taken from the high 1.3338 (seen plotted just above the aforesaid H4 trendline resistance).
Data points to consider: No high-impacting news events scheduled today.
Levels to watch/live orders:
- Buys: Flat (stop loss: N/A).
- Sells: Flat (stop loss: N/A).
AUD/USD:
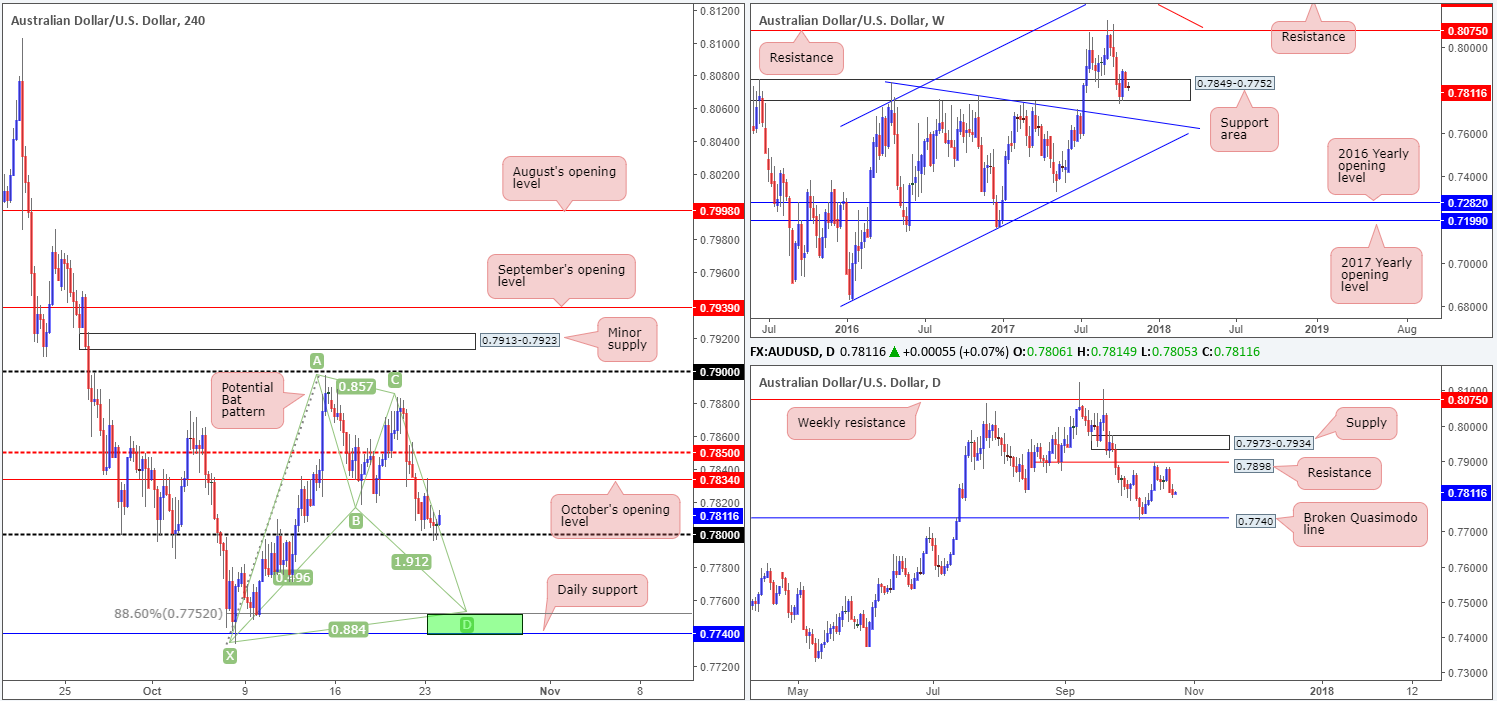
During the course of yesterday’s sessions, the commodity currency probed the underside of October’s opening level at 0.7834, consequently forcing price down to the 0.78 handle into the closing bell. Supporting this psychological band is a weekly support area coming in at 0.7849-0.7752. On the other side of the coin, however, we see the unit under pressure from daily resistance at 0.7898. In addition to this, there’s little daily support on the radar until the broken daily Quasimodo line at 0.7740 enters the fray.
So, in light of the above notes, our position in this market remains unchanged.
Suggestions: Long story short, we have absolutely no intention of buying 0.78. Instead, our focus is on the daily support mentioned above at 0.7740 for longs. This is largely down to it fusing nicely with a H4 Harmonic bat completion point (or potential reversal zone) sited just above at 0.7752 (see green area).
A long from the H4 green zone, with stops planted below the Harmonic pattern’s X point (0.7733), is, in our technical view, a high probability buy zone.
Data points to consider: No high-impacting news events scheduled today.
Levels to watch/live orders:
- Buys: 0.7740/0.7752 (stop loss: 0.7730).
- Sells: Flat (stop loss: N/A).
USD/JPY:
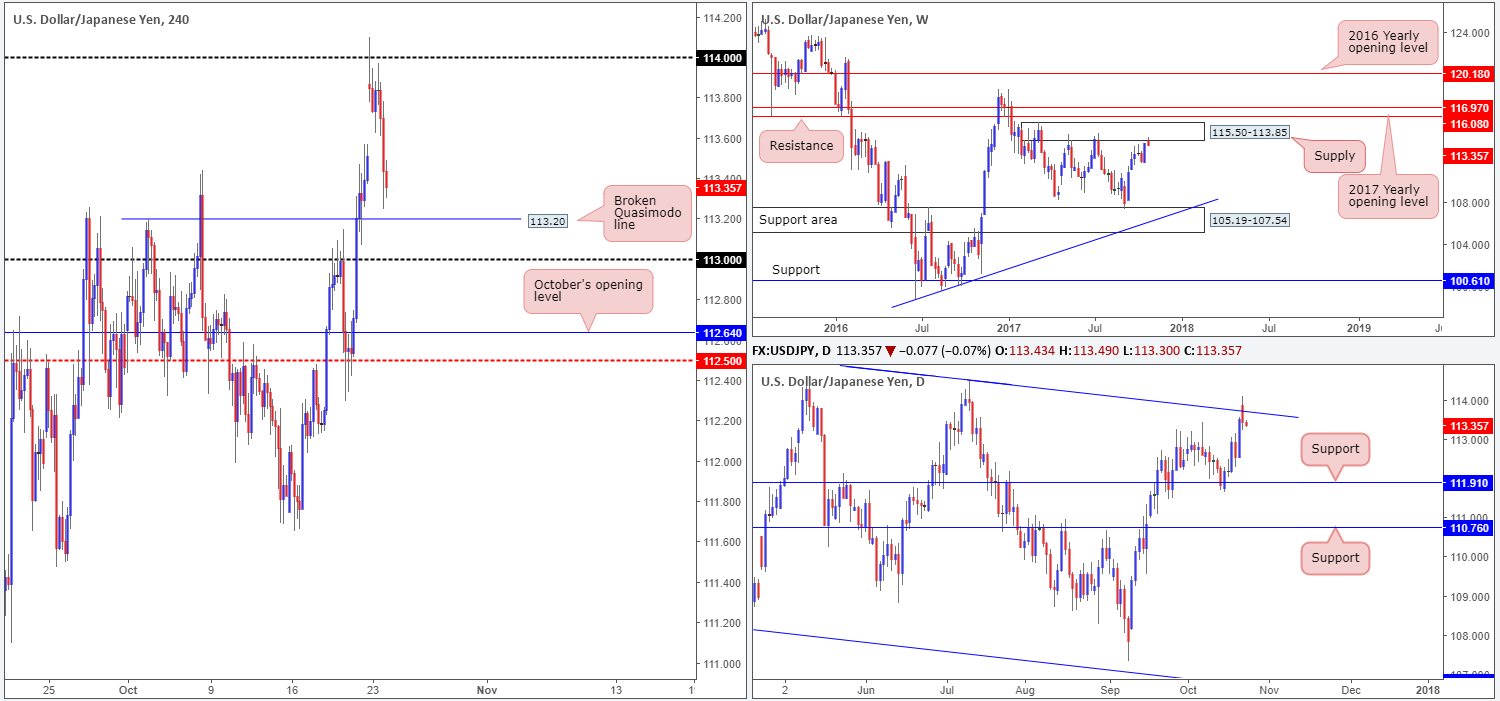
For those who read Monday’s report you may recall that our desk underscored the 114 handle as a high-probability level to sell from. As you can see, price gapped north at the open, following the expected win by Japanese Prime Minister Shinzō Abe, immediately transporting H4 price up to 114.
Well done to any of our readers that managed to catch the selloff from 114. Why we favored a sell from here simply comes down to weekly price touching gloves with a supply at 115.50-113.85, and daily price seen trading around a channel resistance line extended from the high 115.50.
Suggestions: Those who are currently short this market, there is likely going to be active buyers residing around the nearby H4 broken Quasimodo line formed at 113.20, followed closely by the 113 handle. As such, it might be an idea to begin thinking about reducing risk to breakeven (if you haven’t already) and taking some profits off the table. Ultimately though, we would hold a portion of this position and look to target daily support marked at 111.91.
Data points to consider: No high-impacting news events scheduled today.
Levels to watch/live orders:
- Buys: Flat (stop loss: N/A).
- Sells: Flat (stop loss: N/A).
USD/CAD:
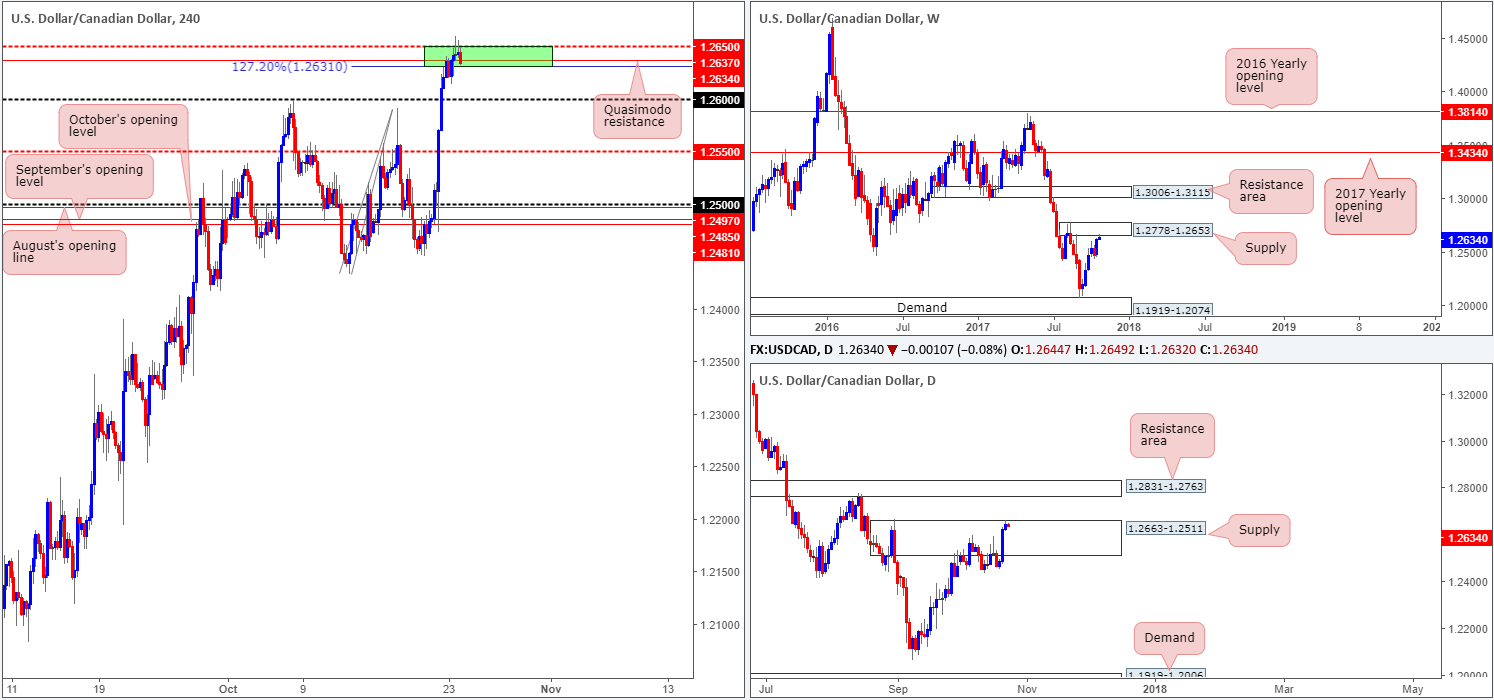
Kicking this morning’s report off with a quick look at the weekly timeframe shows us that the unit is currently shaking hands with the underside of a supply zone drawn from 1.2778-1.2653. Also from this scale, we can see that the market has been in a clear downtrend since May, and all this recent advance could be is a correction.
The story on the daily timeframe, nevertheless, reveals that sellers have been struggling to register anything of note from supply at 1.2663-1.2511. In fact, price is currently toying with the top edge of this zone, as we write.
Across on the H4 timeframe, we can see that the bears managed to defend the mid-level resistance 1.2650 on Monday. The green area is there to show that just below this resistance, we also have a Quasimodo resistance plotted at 1.2637 and a 127.2% AB=CD Fib ext. point at 1.2631.
Suggestions: While daily price looks vulnerable to the upside, both weekly and H4 structures seem robust. For that reason, the small green H4 zone is still a strong sell, in our humble view. To be safe though, we would advise placing stops a few pips above the current daily supply at around the 1.2667ish mark. The first take-profit target, for us, would be the 1.26 handle.
Data points to consider: No high-impacting news events scheduled today.
Levels to watch/live orders:
- Buys: Flat (stop loss: N/A).
- Sells: 1.2637 ([live] stop loss: 1.2667).
USD/CHF:
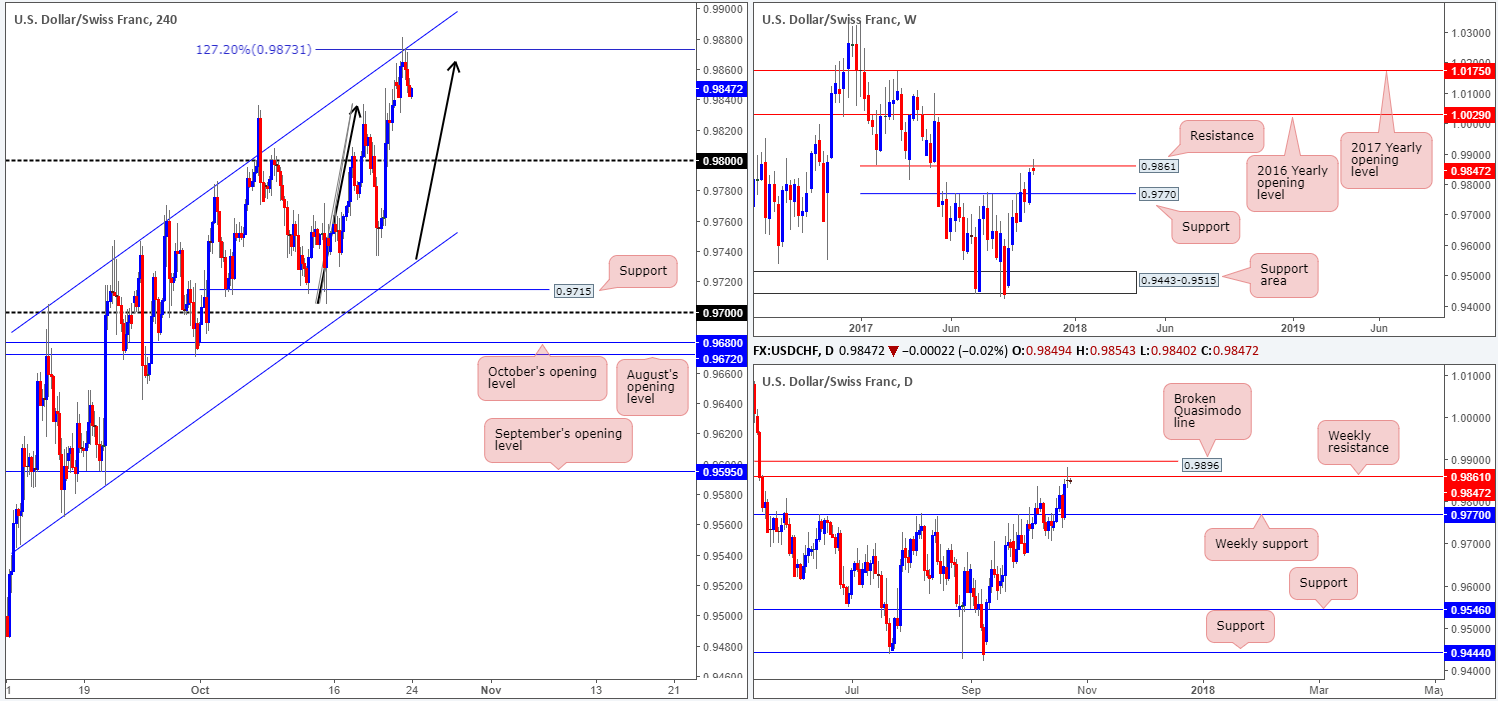
In Monday’s report, the team highlighted a H4 AB=CD (see black arrows) 127.2% Fib ext. point at 0.9873, which fused beautifully with a H4 channel resistance extended from the high 0.9705, as a possible sell zone. Not only did this area display H4 confluence, there was also the fact that weekly price was seen crossing swords with resistance at 0.9861.
Well done to any of our readers that managed to jump aboard this train. The 0.98 handle, followed by weekly support at 0.9770, would be our ultimate take-profit targets going forward.
Suggestions: Apart from our recent short call, we do not see much else to hang our hat on at the moment.
Data points to consider: No high-impacting news events scheduled today.
Levels to watch/live orders:
- Buys: Flat (stop loss: N/A).
- Sells: Flat (stop loss: N/A).
DOW 30:
US equities dipped lower during Monday’s trading, ending the day down -0.23%. In spite of this recent pullback, our outlook for this market remains unchanged.
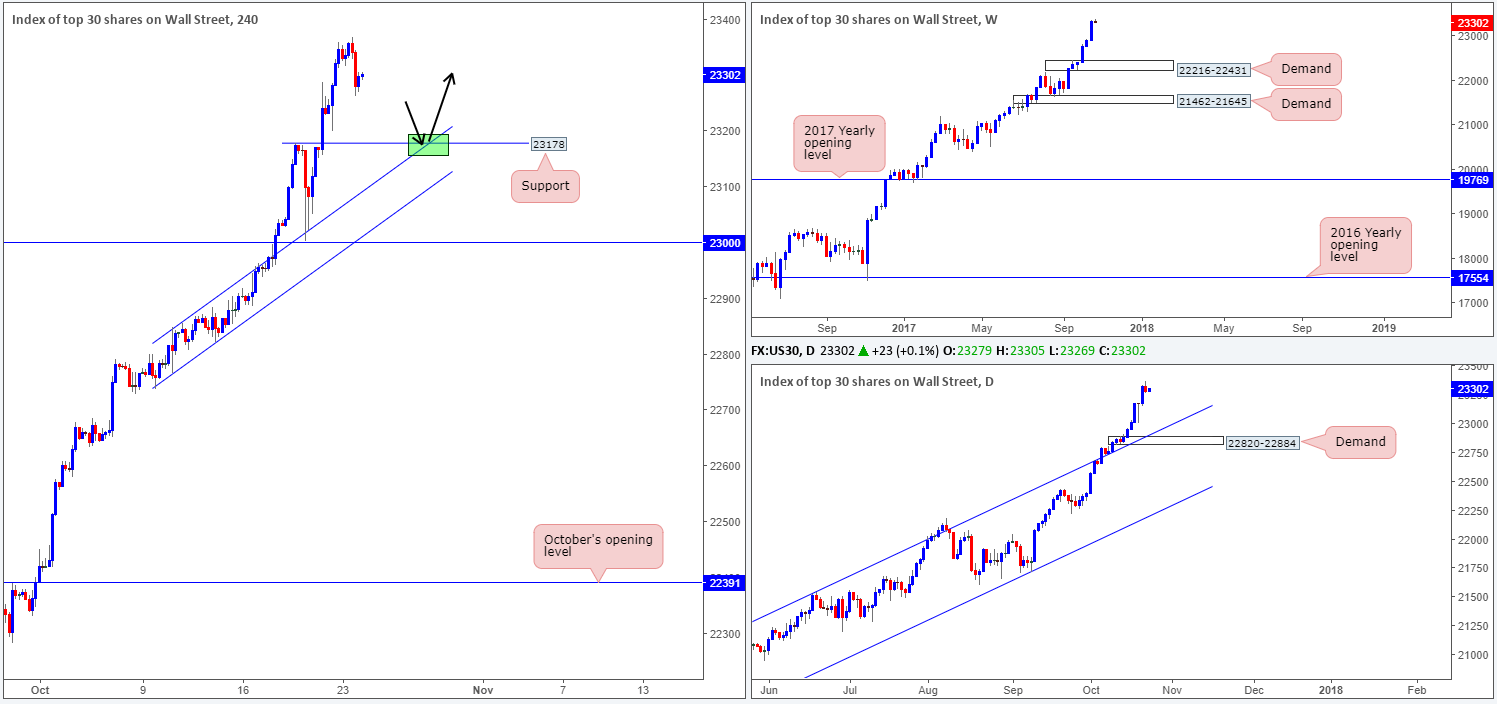
Should the index pullback this week, the next weekly downside target in view is demand coming in at 22216-22431. On the daily timeframe, the closest demand base can be seen at 22820-22884. However, price would first have to get through potential support from the channel resistance-turned support taken from the high 21541.
Looking across to the H4 timeframe, the line marked at 23178 (Wednesday’s high) is, of course, a potential candidate, should the unit retrace this week. Nevertheless, there is little confluence seen here other than a channel resistance-turned support etched from the high 22846, and this will not likely come into view until the end of the week.
Suggestions: We do not see any immediate trading opportunities at present. Yet, we will be keeping a close eye on the noted H4 support. Should price connect at the point where the H4 support and channel support merge (green box), we would be looking to buy should H4 price chalk up a full or near-full-bodied bull candle.
Data points to consider: No high-impacting news events scheduled today.
Levels to watch/live orders:
- Buys: 23178/H4 channel support ([waiting for a reasonably sized H4 bullish candle to form – preferably a full or near-full-bodied candle – is advised] stop loss: ideally beyond the candle’s tail).
- Sells: Flat (stop loss: N/A).
GOLD:
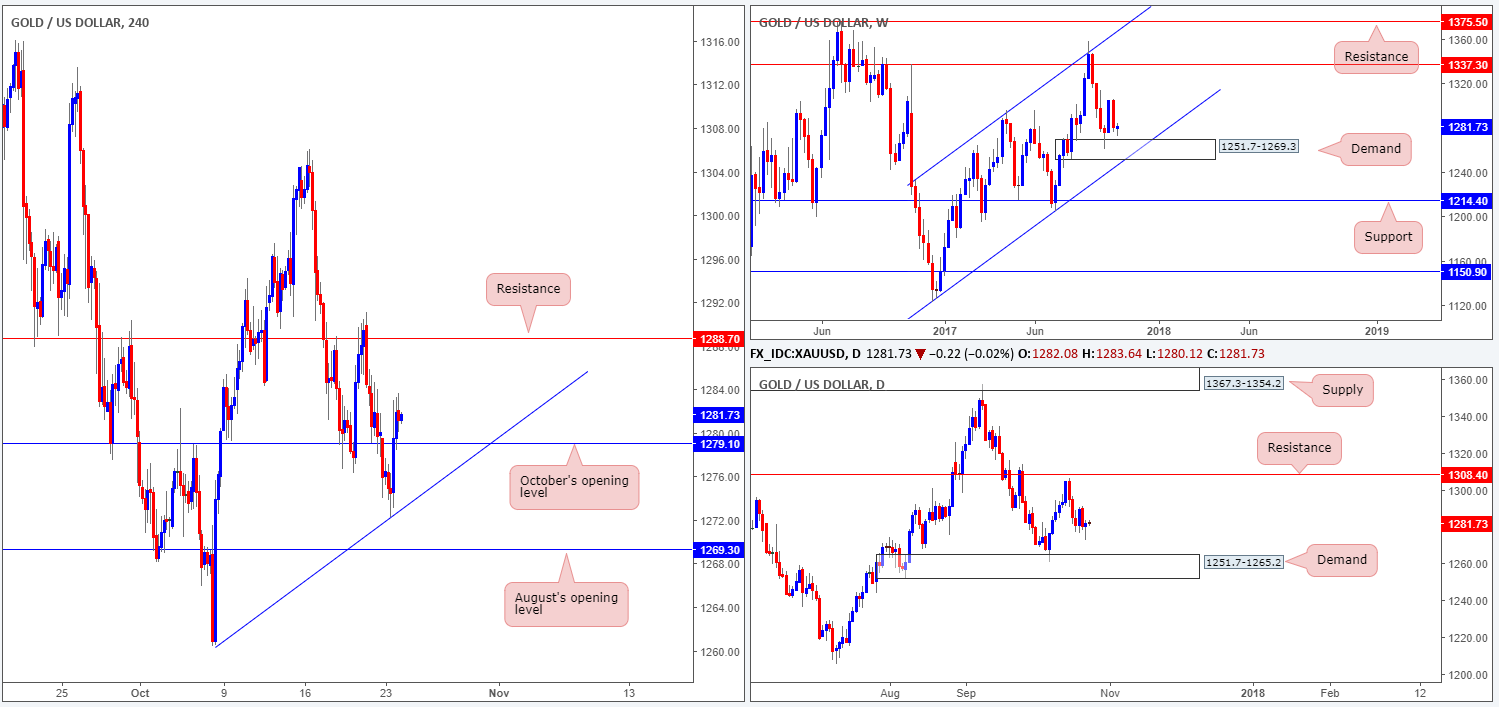
Amid Monday’s trade, spot gold bottomed at a session low of 1272.2 and ended the day closing back above October’s opening level at 1279.1, reaching a high of 1283.6. Currently up +0.11% on the week, this recent advance could encourage buyers into the market and pull the yellow metal back up to H4 resistance at 1288.7. Couple this with daily price chalking up a bullish buying tail (pin bar) yesterday, higher prices seem even more likely.
While traders may be gearing themselves up to buy from 1279.1 should the unit pullback, there’s still a strong chance that H4 price will be looking to push lower and strike 1269.3: August’s opening level. Why? Well, this is due to weekly price showing room to move down to a demand at 1251.7-1269.3 (notice the top edge represents August’s opening level) and daily price down to demand printed at 1251.7-1265.2 which happens to be sited within the lower limits of the said weekly demand.
Suggestions: Technically speaking, we feel that a long from 1279.1 is not high probability. This is largely due to where price is trading on the bigger picture. So, with that in mind, we will be remaining on the sidelines for the time being, unless price bumps heads with 1269.3.
Levels to watch/live orders:
- Buys: 1269.3 region ([waiting for a reasonably sized H4 bullish candle to form – preferably a full, or near-full-bodied candle – is advised] stop loss: ideally beyond the candle’s tail).
- Sells: Flat (stop loss: N/A).


