A note on lower timeframe confirming price action…
Waiting for lower timeframe confirmation is our main tool to confirm strength within higher timeframe zones, and has really been the key to our trading success. It takes a little time to understand the subtle nuances, however, as each trade is never the same, but once you master the rhythm so to speak, you will be saved from countless unnecessary losing trades. The following is a list of what we look for:
- A break/retest of supply or demand dependent on which way you’re trading.
- A trendline break/retest.
- Buying/selling tails/wicks – essentially we look for a cluster of very obvious spikes off of lower timeframe support and resistance levels within the higher timeframe zone.
- Candlestick patterns. We tend to stick with pin bars and engulfing bars as these have proven to be the most effective.
We search for lower timeframe confirmation between the M15 and H1 timeframes, since most of our higher-timeframe areas begin with the H4. Stops are usually placed 3-5 pips beyond confirming structures.
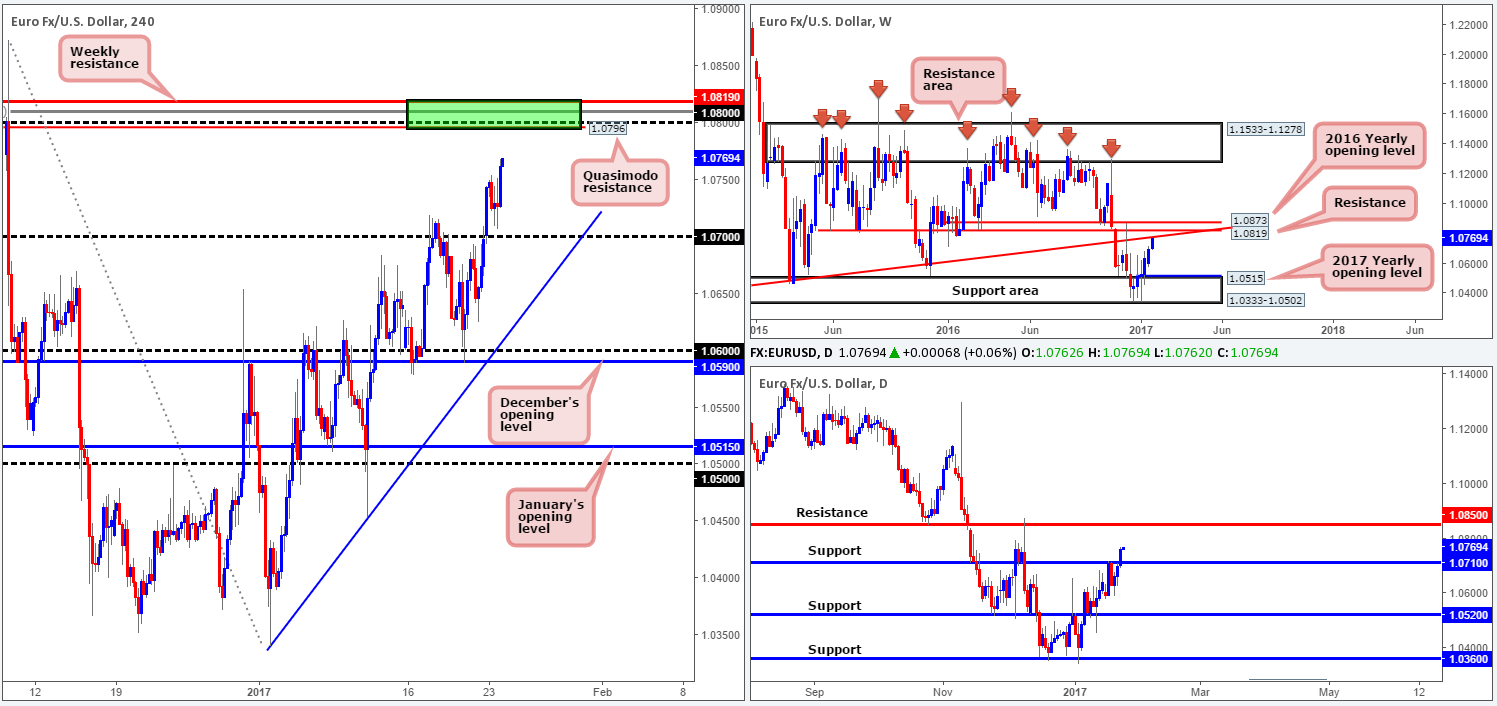
EUR/USD:
Across the board, we saw the US dollar wane against the majority of its trading peers. This forced the single currency to attack and eventually close beyond the 1.07 handle on the H4 chart, and end the day closing above daily resistance coming in at 1.0710 (now acting support). In addition to this, Monday’s movement has placed weekly action within touching distance of the long-term weekly trendline resistance extended from the low 0.8231, followed closely by weekly resistance seen at 1.0819.
To our way of seeing things, the closest resistance in view is positioned around the 1.08 region. Not only does 1.08 sit nearby a H4 Quasimodo resistance level at 1.0796, it also boasts a deep 88.6% Fib resistance at 1.0809 and is planted nearby the above noted weekly resistance at 1.0819 and adjacent weekly trendline resistance (green rectangle – H4 chart).
Our suggestions: In light of the supporting confluence seen around the 1.08 neighborhood, our desk has noted that should price connect with the above noted green area today, we would, dependent on the time of day, look to enter short at market, targeting the nearest H4 demand formed on approach.
Data points to consider: Eurozone PMI data hitting the wires between 8am/9am, as well as the EU court membership ruling at 9.30am GMT.
Levels to watch/live orders:
- Buys: Flat (stop loss: N/A).
- Sells: 1.08 region ([dependent on the time of day, this is an area we would consider trading without confirmation] stop loss: 1.0825 [aggressive stop] 1.0875 [conservative stop]).
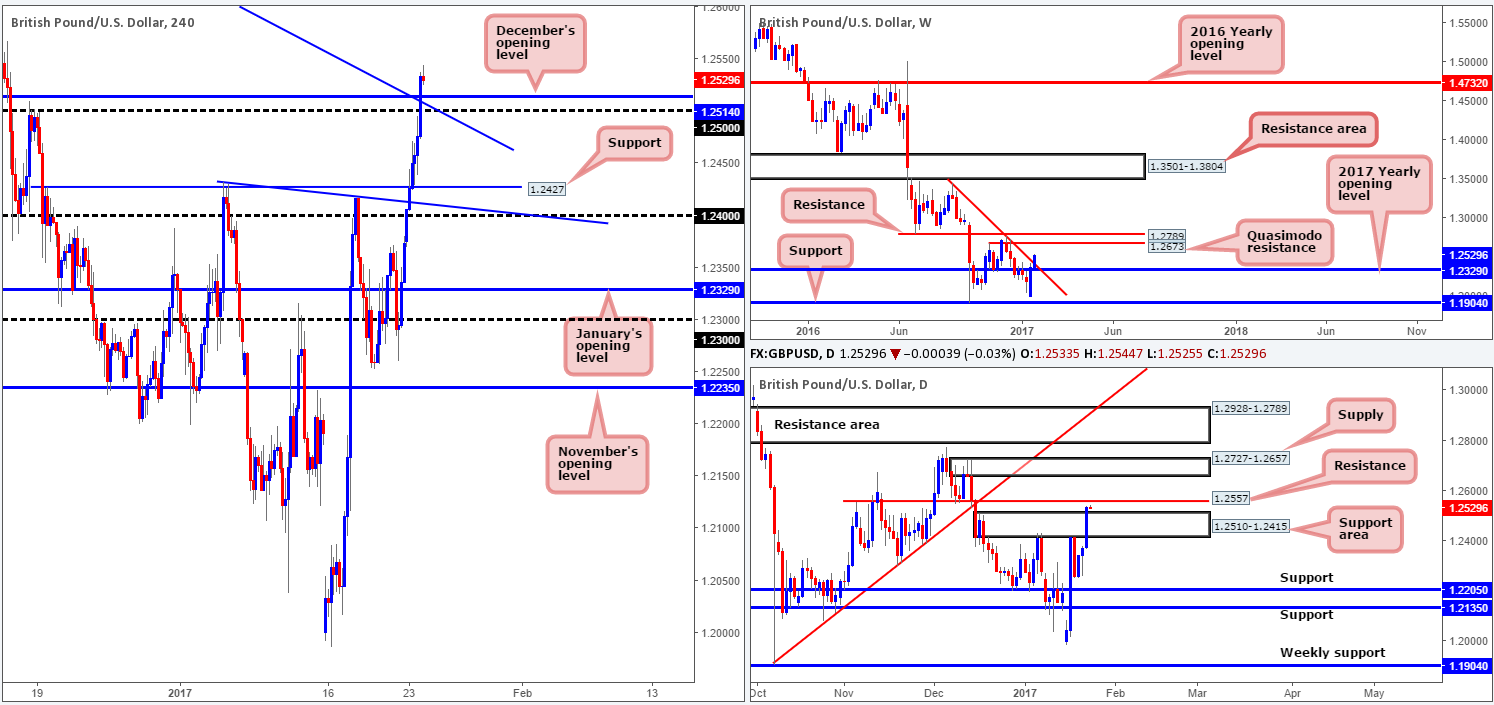
GBP/USD:
Underpinned by a fading US dollar, and expectations of more parliamentary participation in the Brexit proceedings to be the result of the EU court membership ruling today at 9.30am, the pound munched through several H4 tech resistances yesterday!
Looking over to the weekly candles, we can see that price has recently peeked above the weekly trendline resistance taken from the high 1.3445. Should the bulls maintain this position, the next upside objective falls in at 1.2673: a weekly Quasimodo resistance level. Daily price on the other hand, also chewed through offers at a daily supply zone drawn from 1.2510-1.2415, and now looks set to cross swords with daily resistance pegged just ahead at 1.2557.
Our suggestions: Considering that there is a little ‘wiggle room’ seen on the daily chart to push higher, a long from December’s opening level at 1.2514 could be something to look at. There are a number of technical aspects that support this view. Firstly, the converging H4 trendline support extended from the high 1.2774 that fuses beautifully with the 1.25 handle. Secondly, there’s also the top edge of the recently broken daily supply zone to take into consideration at 1.2510. In our opinion, this is sufficient enough to warrant a long position with an initial target objective placed around the H4 mid-way resistance at 1.2550.
Data points to consider: EU court membership ruling at 9.30am GMT.
Levels to watch/live orders:
- Buys: 1.25 region ([dependent on the time of day, this is an area we would consider trading without confirmation] stop loss: 1.2478).
- Sells: Flat (stop loss: N/A).
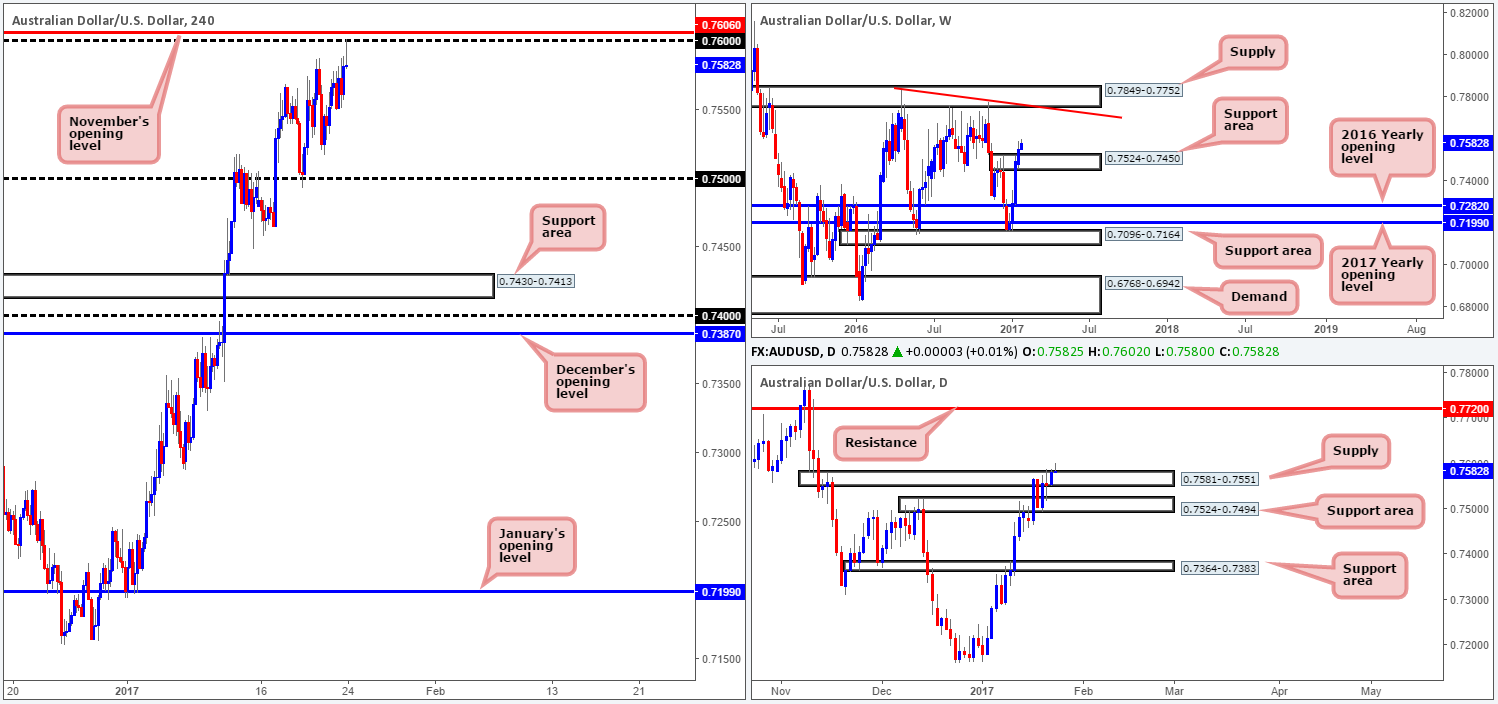
AUD/USD:
Boosted by an advance over in the gold market and a wilting US dollar, the commodity-linked currency gravitated to highs of 0.7589 on the day. Although the pair has recently found a pocket of offers around the 0.76 psychological handle, yesterday’s rally forced price to slightly break above daily supply at 0.7581-0.7551. This could, given that weekly price also conquered the weekly supply zone sitting at 0.7524-0.7450 last week (now acting support area), set the stage for further buying up to the daily resistance penciled in at 0.7720 (positioned just below a weekly supply area at 0.7849-0.7752 – the next upside target on the weekly scale). However, before our team can become buyers, we’d need to see a decisive H4 close above both the round number 0.76 and November’s opening level at 0.7606. The trail beyond here appears reasonably resistance-free until the 0.77 barrier.
Our suggestions: Unfortunately, neither a long nor short seems attractive at this time. As mentioned above, no longs are permitted until a H4 close is seen above 0.7606. Regarding shorts, the recent weekly close above weekly supply, and with the daily buyers claiming the top edge of the current daily supply, we would strongly advise against selling for the time being.
Data points to consider: There are no scheduled high-impacting news events on the docket today relating to these two markets.
Levels to watch/live orders:
- Buys: Watch for a H4 close to form above 0.7606 and then look to trade any retest seen thereafter ([waiting for a lower-timeframe confirming setup [see the top of this report] following the retest is advised prior to pulling the trigger] stop loss: dependent on where one confirms this area).
- Sells: Flat (stop loss: N/A).
USD/JPY:
Kicking this morning’s report off with a look at the weekly timeframe, the bears are, at present, seen attacking last week’s low point at 112.57. A breakdown below this hurdle could open the doors for price to challenge the weekly support area painted at 111.44-110.10. Turning our attention to the daily candles, yesterday’s action has placed price within striking distance of a daily demand base registered at 111.35-112.37, which, as you can probably see, is positioned around the top edge of the above mentioned weekly support area.
Stepping across to the H4 chart, we can see that after price retested the underside of 114 amid yesterday’s US open, sellers propelled their way through H4 support at 113.25 (now acting resistance) and clocked lows of 112.68 on the day. As of now, the pair is trading in the green just ahead of H4 demand coming in at 112.05-112.37, which happens to be located around the top edge of the daily demand zone mentioned above.
Our suggestions: With the understanding that this H4 demand base has the backing of not only the current daily demand, but also the weekly support area as well, there’s a fair chance that price will respond from here. While this may be true, traders still need to be prepared for the possibility of a fakeout through this zone, as price may want to drive deeper into the above noted higher-timeframe areas before rallying higher. With that being the case, waiting for at least a H4 bull candle to form may be the better path to take.
Data points to consider: There are no scheduled high-impacting news events on the docket today relating to these two markets.

Levels to watch/live orders:
- Buys: 112.05-112.37 ([a reasonably sized H4 bull candle will need to be seen from here before a trade can be executed] stop loss: ideally beyond the trigger candle).
- Sells: Flat (stop loss: N/A).
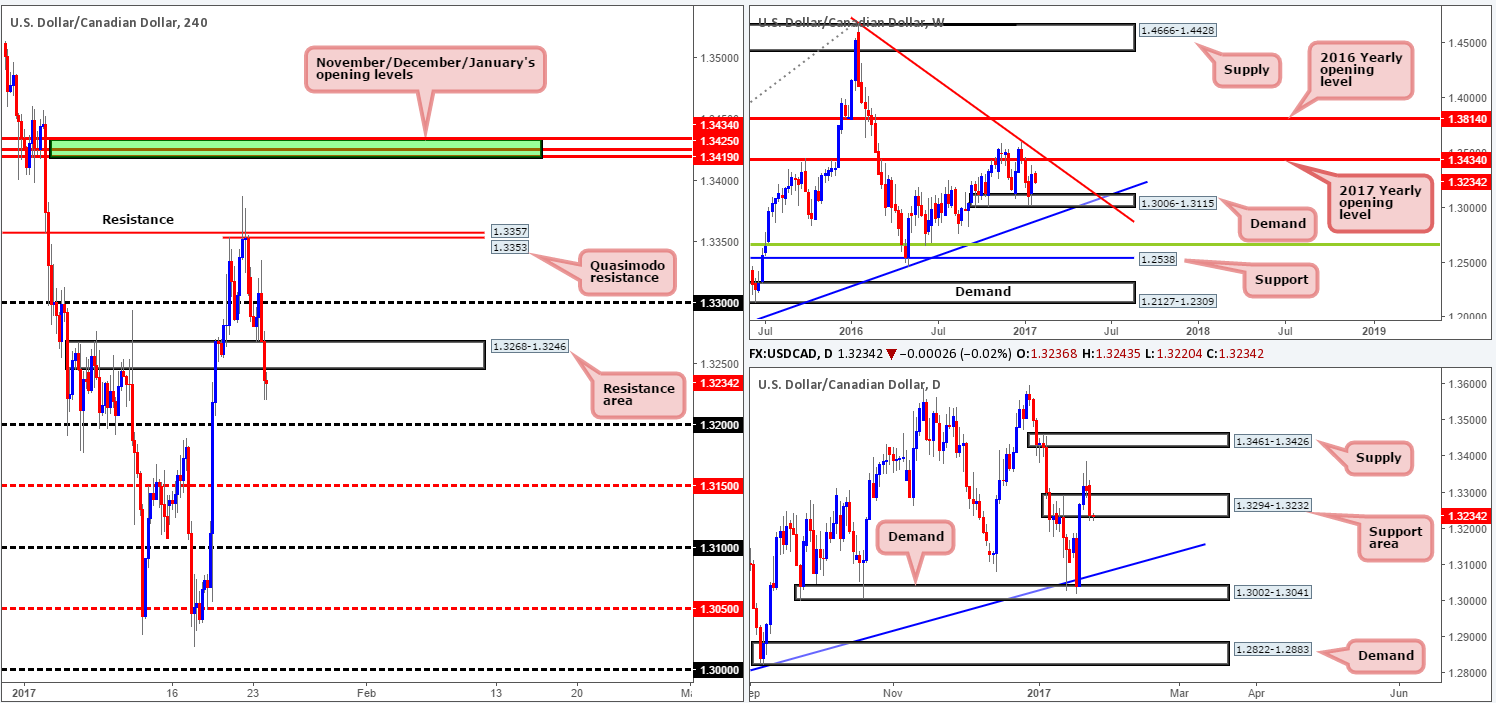
USD/CAD:
Weakened by advancing oil prices and a descending US dollar, the USD/CAD spiraled south going into yesterday’s US segment, shaped by two strong-looking H4 bearish candles. The H4 support area at 1.3268-1.3246 was taken out as a result of the downside move, leaving the 1.32 handle unchallenged.
While there is somewhat of a bearish tone surrounding the H4 scale at present, it may be worth noting that the daily candles are seen tickling the lower edge of a daily support area registered at 1.3294-1.3232. Until we see a decisive daily close below this region, it’s difficult to gauge whether the candles are looking to take this market lower or are simply collecting sell stops to drive higher.
Our suggestions: Assuming that the H4 candles pullback and retest the 1.3268-1.3246 H4 area as resistance, this could suggest a daily close lower is on the cards. Quite frankly, however, taking a short on the basis of these points is not sufficient enough to permit a sell in this market, in our opinion. The better, more logical path to take would likely be to wait for a H4 bearish close to form beyond the 1.32 level (that way, we can be reasonably confident that the daily support area is out of the picture), and look to trade beyond here targeting the H4 mid-way support at 1.3150, followed closely by the top edge of the weekly demand area at 1.3006-1.3115.
Data points to consider: There are no scheduled high-impacting news events on the docket today relating to these two markets.
Levels to watch/live orders:
- Buys: Flat (stop loss: N/A).
- Sells: Watch for a H4 close to form below 1.32 and then look to trade any retest seen thereafter ([waiting for a lower-timeframe confirming setup [see the top of this report] following the retest is advised prior to pulling the trigger] stop loss: dependent on where one confirms this area).
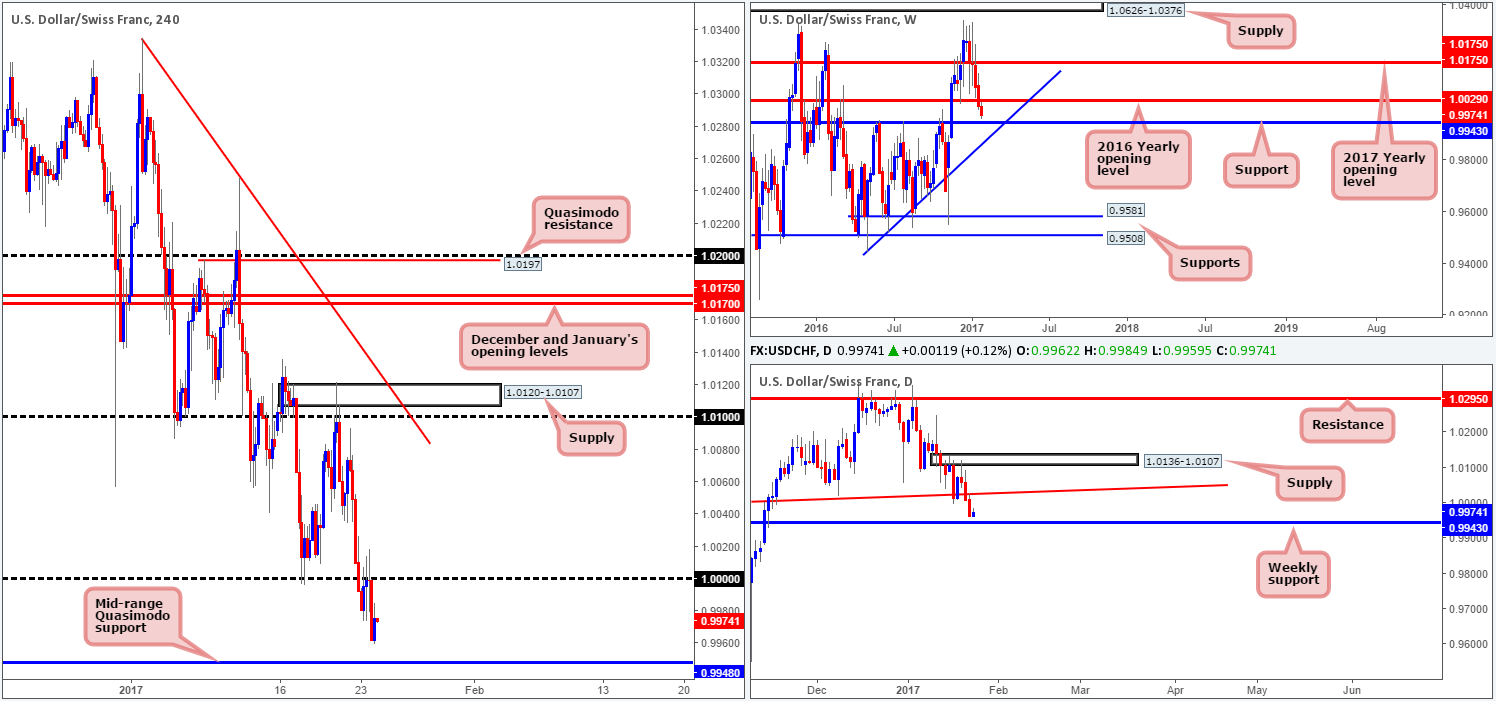
USD/CHF:
From the weekly chart, we can see that the bears are currently on course to shake hands with weekly support drawn from 0.9943. The pair is likely to find support from here with it having been a strong barrier of resistance on a number of occasions over the last year. Sliding down into the daily chart, yesterday’s action retested the daily trendline support taken from the high 0.9956 as resistance. This, similar to the weekly chart, has placed price within reaching distance of the above noted weekly support level.
For those who read Monday’s report on the Swissy you may recall that our team highlighted the possibility of a H4 close beyond parity (1.0000). While this did come to fruition, what followed was a retest to the underside of this level and three relatively sound-looking H4 bearish wicks – a strong signal that sellers are on board here! Well done to any of our readers who managed to lock their selves into a position here!
Our suggestions: The next H4 downside target can be seen at 0.9948: a H4 mid-range Quasimodo support level. Owing to this base also being positioned only five pips from the aforementioned weekly support level, a bullish rotation may be on the cards from this region. One could, if they so wished, look to enter at this H4 support level at market since stops can comfortably be placed beyond the low of the above noted H4 mid-range Quasimodo at 0.9927. Right now, the first take-profit target would be set at parity. However, should a H4 supply form on approach to 0.9948, we would look to take partial profits there, and possibly reduce risk to breakeven.
Data points to consider: There are no scheduled high-impacting news events on the docket today relating to these two markets.
Levels to watch/live orders:
- Buys: 0.9949 ([possible level to look at buying from without the need for additional confirmation] stop loss: 0.9927).
- Sells: Flat (stop loss: N/A).
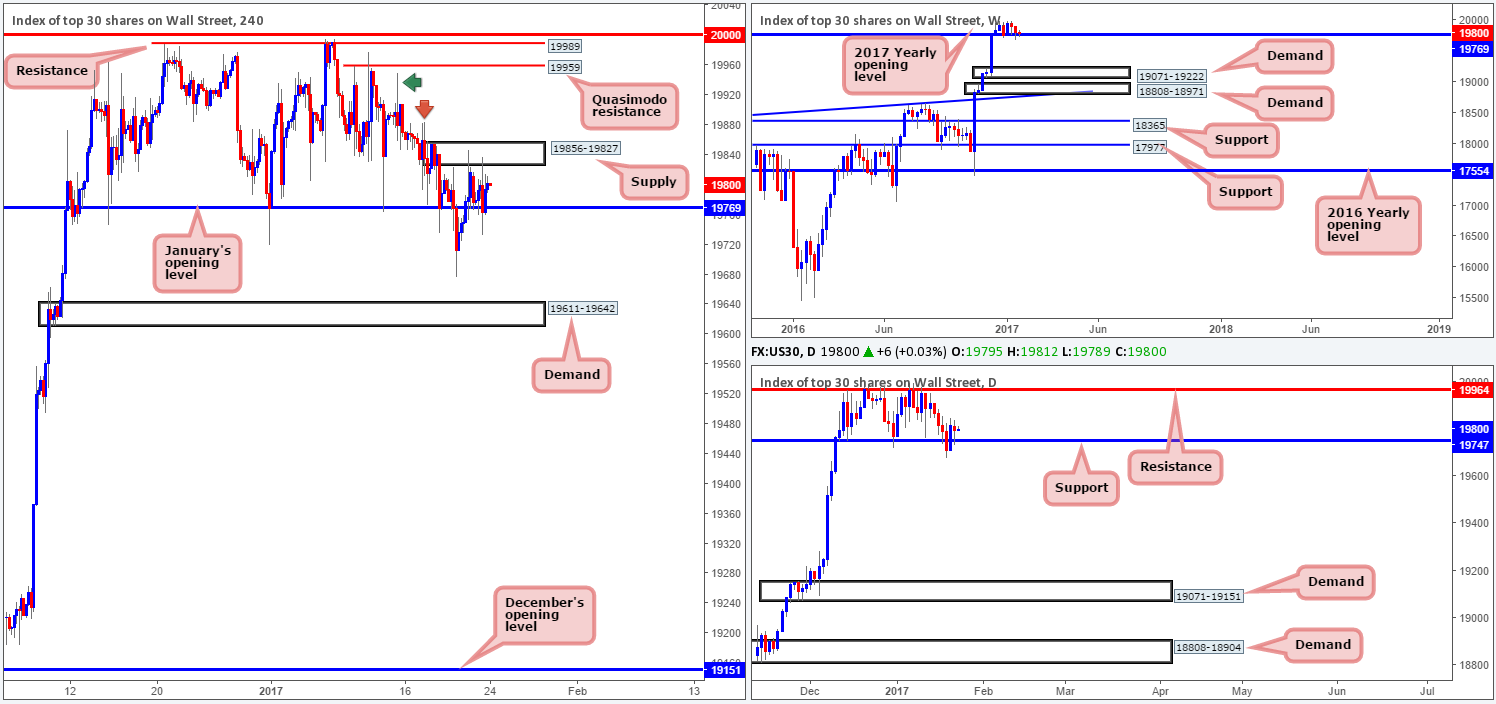
DOW 30:
US equity prices are little changed this morning, with the H4 candles still seen positioned between H4 supply coming in at 19856-19827 and January’s opening level at 19769. Daily support at 19747 (positioned only a few points below the yearly opening level) has bolstered this market since mid-December 2016. Despite this, a H4 close above the aforementioned H4 supply would need to take place, before our team would consider becoming buyers. The path beyond this area is reasonably clear up to the H4 Quasimodo resistance level visible at 19959 (located only a few points from the daily resistance at 19964), due to the H4 supply consumption wicks seen marked with the red and green arrows at 19950/19884.
Our suggestions: Put simply, watch for a H4 close to form above the current H4 supply zone. In the event that this comes to fruition, and price retests the top edge of the broken area as support followed by a reasonably sized H4 bull candle, we feel one could comfortably take a long position based on this, targeting the above said H4 Quasimodo resistance.
Data points to consider: EU court membership ruling at 9.30am GMT.
Levels to watch/live orders:
- Buys: Watch for a H4 close beyond the H4 supply at 19856-19827 and then look to trade any retest seen thereafter ([a reasonably sized H4 bull candle will need to be seen following the retest before a trade can be executed] stop loss: ideally beyond the trigger candle).
- Sells: Flat (stop loss: N/A).
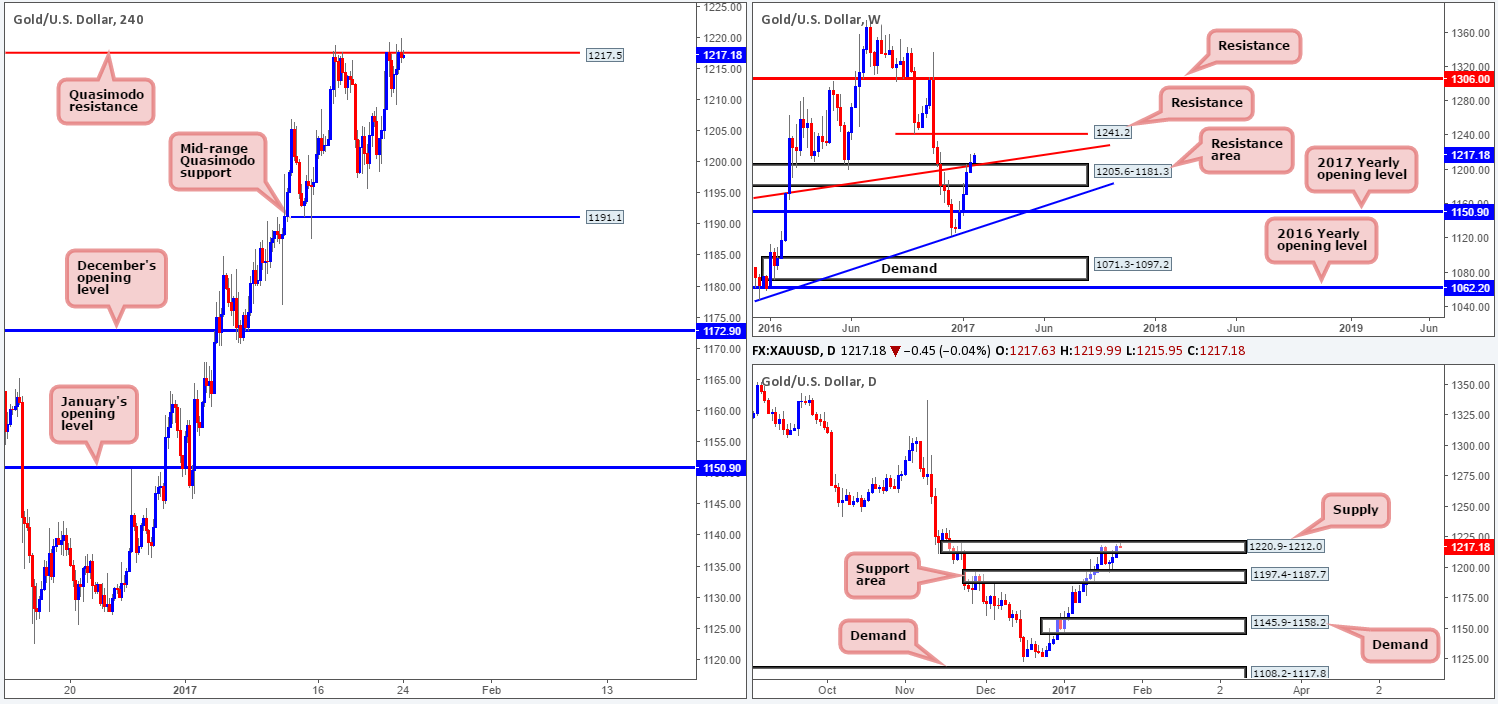
GOLD:
In spite of gold’s advance yesterday, the yellow metal is finding the H4 Quasimodo resistance at 1217.5 a difficult barrier to overcome. This could have something to do with the fact that the daily candles currently occupy daily supply at 1220.9-1212.0. However, despite its daily connection, the offered tone seen around the H4 level could be coming to end with the possibility of price rallying to test H4 supply at 1232.9-1228.3. Our reasoning simply comes from seeing weekly price standing tough above the weekly resistance area coming in at 1205.6-1181.3, and its converging weekly trendline resistance extended from the low 1130.1.
Our suggestions: As of current price, shorting the H4 Quasimodo resistance level at 1217.5 is out of the question for our desk, given the strength of the current weekly candle. Buying, however, could be a possibility on the condition that a decisive H4 close beyond the H4 Quasimodo is seen. Still, we’d urge traders to wait for price to retest the H4 broken Quasimodo line and chalk up a lower-timeframe buying signal (see the top of this report) before looking to pull the trigger. Although waiting for this confirmation will not guarantee a winning trade, it will very likely help avoid an unnecessary losing trade.
Levels to watch/live orders:
- Buys: Watch for a H4 close to form above 1217.5 and then look to trade any retest seen thereafter ([waiting for a lower-timeframe confirming setup following the retest is advised prior to pulling the trigger] stop loss: dependent on where one confirms this area).
- Sells: Flat (stop loss: N/A).


