Waiting for lower timeframe confirmationis our main tool to confirm strength within higher timeframe zones, and has really been the key to our trading success. It takes a little time to understand the subtle nuances, however, as each trade is never the same, but once you master the rhythm so to speak, you will be saved from countless unnecessary losing trades. The following is a list of what we look for:
- A break/retest of supply or demand dependent on which way you’re trading.
- A trendline break/retest.
- Buying/selling tails/wicks – essentially we look for a cluster of very obvious spikes off of lower timeframe support and resistance levels within the higher timeframe zone.
- Candlestick patterns. We tend to stick with pin bars and engulfing bars as these have proven to be the most effective.
We typically search for lower-timeframe confirmation between the M15 and H1 timeframes, since most of our higher-timeframe areas begin with the H4. Stops are usually placed 1-3 pips beyond confirming structures.
EUR/USD:
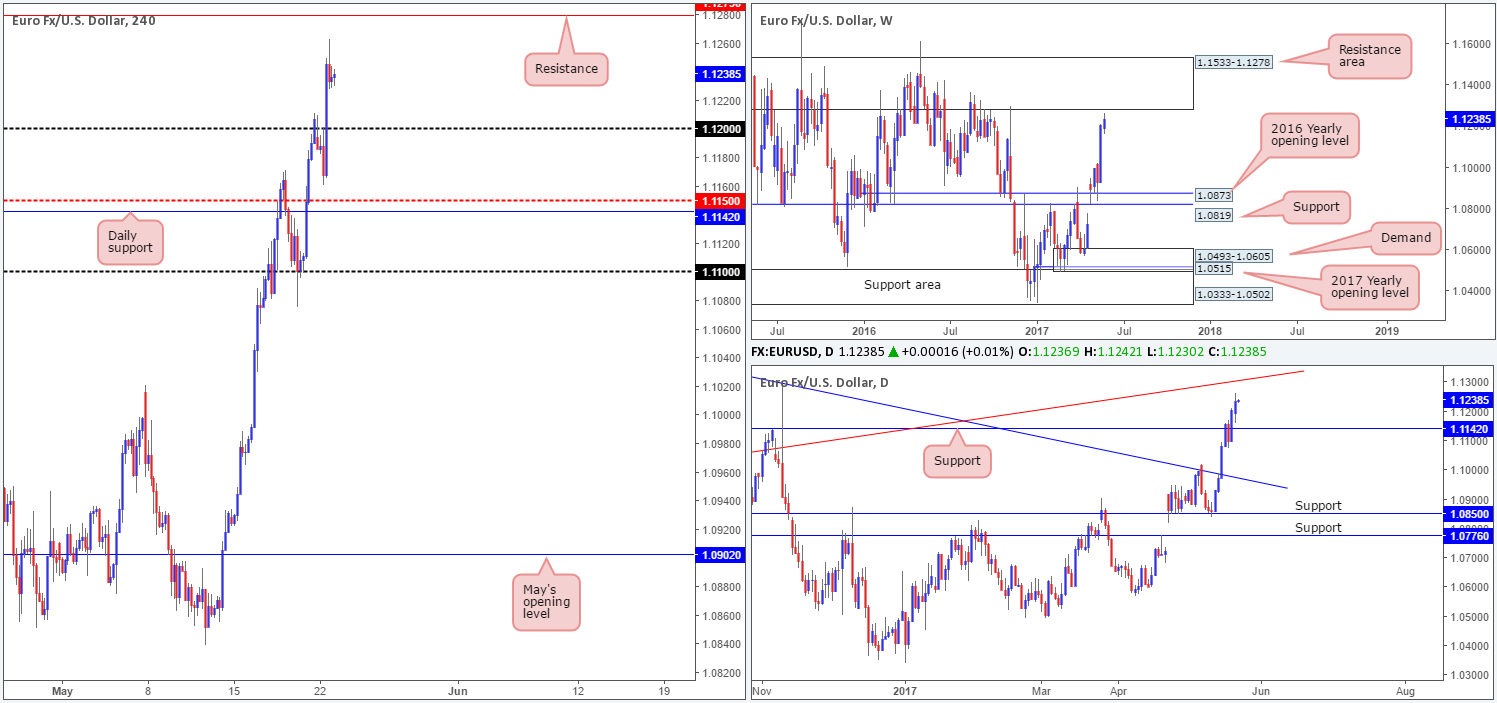
As anticipated, the single currency continued to extend higher during the course of Monday’s segment. Germany's Chancellor Angela Merkel argued that the "too weak" EUR was to blame for the contracting trade surplus in Germany, increasing the demand. The move has, as you can see, brought the H4 candles up to within striking distance of H4 resistance at 1.1279, followed closely by the 1.13 handle. Also of interest here is the fact that this H4 resistance denotes the underside of a weekly resistance area at 1.1278, and in addition to this, we also see a daily trendline resistance etched from the low 1.0711 intersecting nicely with the 1.13 region.
Our suggestions: Given the confluence surrounding the 1.13 neighborhood, our team has expressed interest in shorting the unit here. In the event that a reasonably sized H4 bearish candle forms around 1.13/1.1279 today, preferably a full-bodied candle, we would have little hesitation in selling here. Ideally, stops would be positioned above the candle’s wick and the initial take-profit target is to be set at the nearest H4 demand formed on approach.
Data points to consider: German IFO business climate survey at 9am, Eurozone manufacturing reports between 8-9am. Several FOMC members set to take the stage at different times today.
Levels to watch/live orders:
- Buys: Flat (stop loss: N/A).
- Sells: 1.13/1.1279 ([waiting for a reasonably sized H4 bear candle, preferably a full-bodied candle, to form before pulling the trigger is advised] stop loss: ideally beyond the candle’s wick).
GBP/USD:
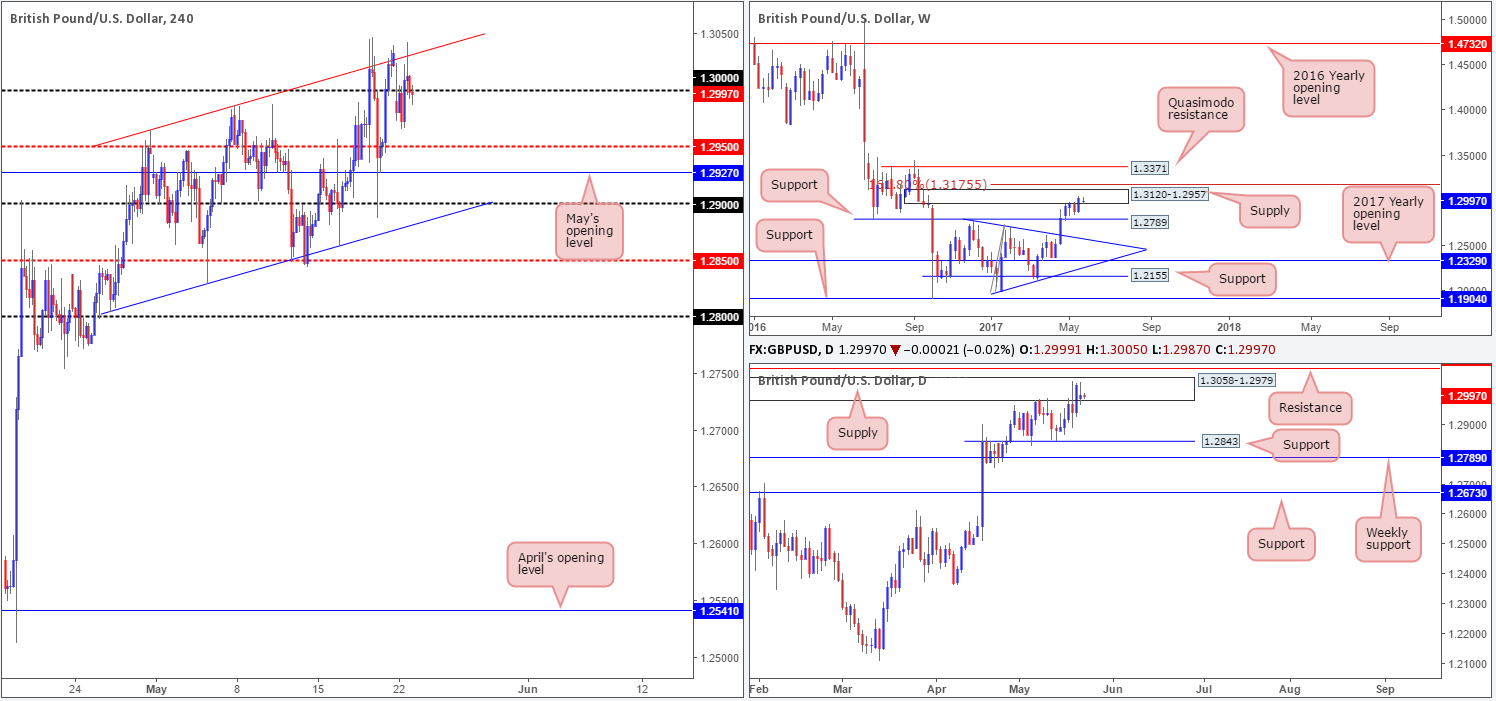
The GBP/USD, as expected, remains trading around the top edge of the ascending channel (low: 1.2804 high: 1.2965) despite closing above this structure on Friday. The large psychological level seen at 1.30, however, is proving to be a bit troublesome for the bears at the moment. With that being said though, a reasonable attempt to push lower from 1.30 was seen on Monday, forming a nice bearish rejection candle, but in this instance the bulls had other plans!
Ultimately, the desk believes that the odds of price breaking lower are high. This comes from seeing weekly price lurking within the walls of a supply base drawn from 1.3120-1.2957 and daily action continuing to trade around supply seen within the said weekly supply at 1.3058-1.2979.
Our suggestions: Similar to Monday’s report, 1.30 will be KEY in deciding direction. A rejection off this line will likely imply the bulls are going to attempt to break above the said higher-timeframe areas, and a violation of this number would likely lead to a move down to the H4 mid-level support at 1.2950, and possibly beyond. Personally, even with a solid rejection off 1.30 today, we would not be keen buyers in light of the bigger picture. Selling below 1.30 on the other hand could be a possibility if price were to retest the underside of this number and form a lower-timeframe sell signal (see the top of this report), targeting the H4 mid-level resistance at 1.2950 as an initial take-profit target.
Data points to consider: UK Inflation hearings at 10am. Several FOMC members set to take the stage at different times today.
Levels to watch/live orders:
- Buys: Flat (stop loss: N/A).
- Sells: Watch for H4 price to engulf 1.30 and then look to trade any retest seen thereafter ([waiting for a lower-timeframe sell signal to form following the retest is advised] stop loss: dependent on where one confirms this level).
AUD/USD:
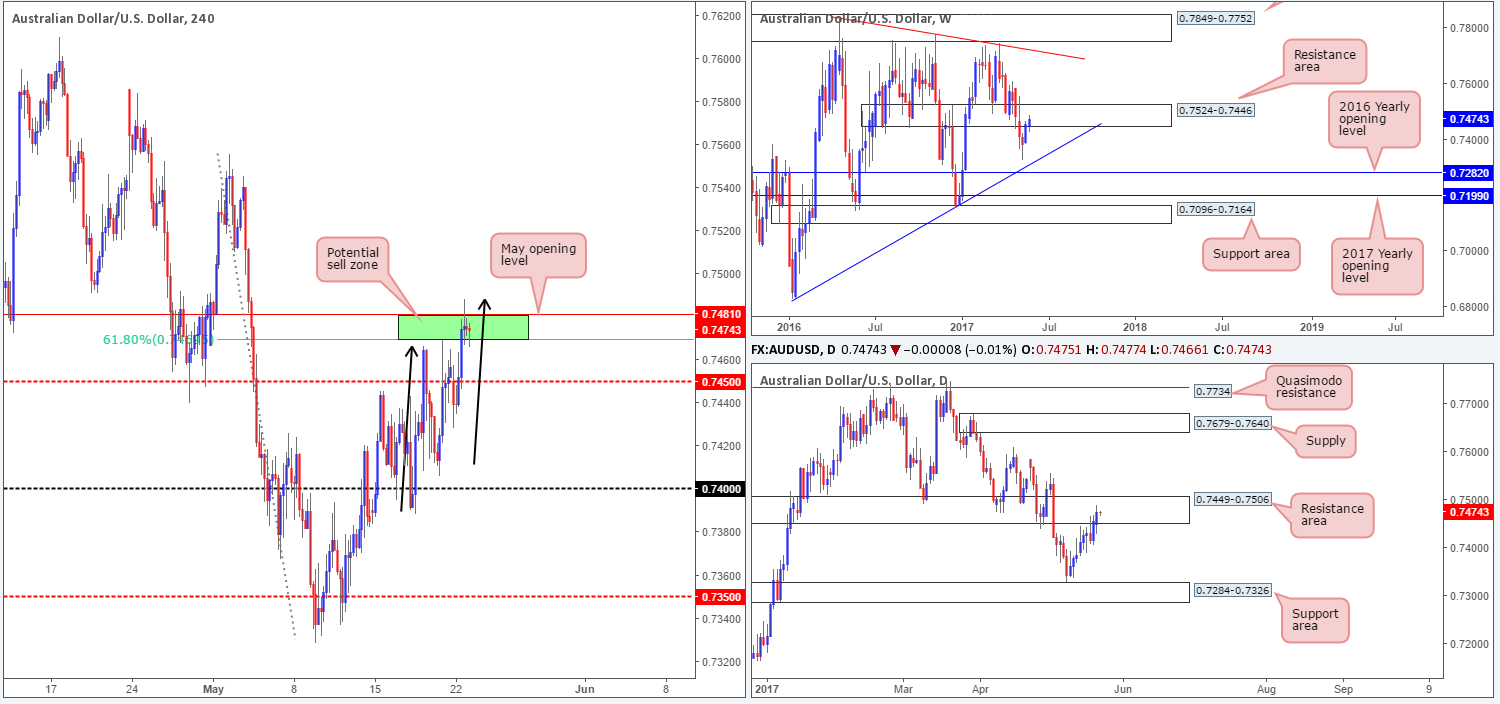
For those who read Monday’s report on the Aussie you may recall our desk highlighting the 0.7481/0.7470 neighborhood as a potential sell zone (green area). Our reasons for liking this area were due to the following:
- Located within a weekly resistance area at 0.7524-0.7446.
- Positioned within a daily resistance area (plotted within the said weekly zone) at 0.7449-0.7506.
- May’s opening level at 0.7481 (denotes the top edge of the sell zone) was likely to produce a reaction.
- And finally, the market’s overall trend is currently pointing south.
We also went on to say that traders should expect a fakeout through this zone. This is due to the H4 AB=CD approach taken from the low 0.7388 (see black arrows).
As you can see, this has played out as expected, and the bears have demonstrated some interest here following the fakeout. On the basis of our above notes, and the H4 selling wick formed on the fakeout, we are now short this market at 0.7475, with our stop tucked just above the wick at 0.7490. Ultimately, we’re looking for price to tap the H4 mid-level support at 0.7450 before taking partial profits and reducing risk.
Data points to consider: Several FOMC members set to take the stage at different times today.
Levels to watch/live orders:
- Buys: Flat (stop loss: N/A).
- Sells: 0.7475 ([pending order] stop loss: 0.7490).
USD/CAD:
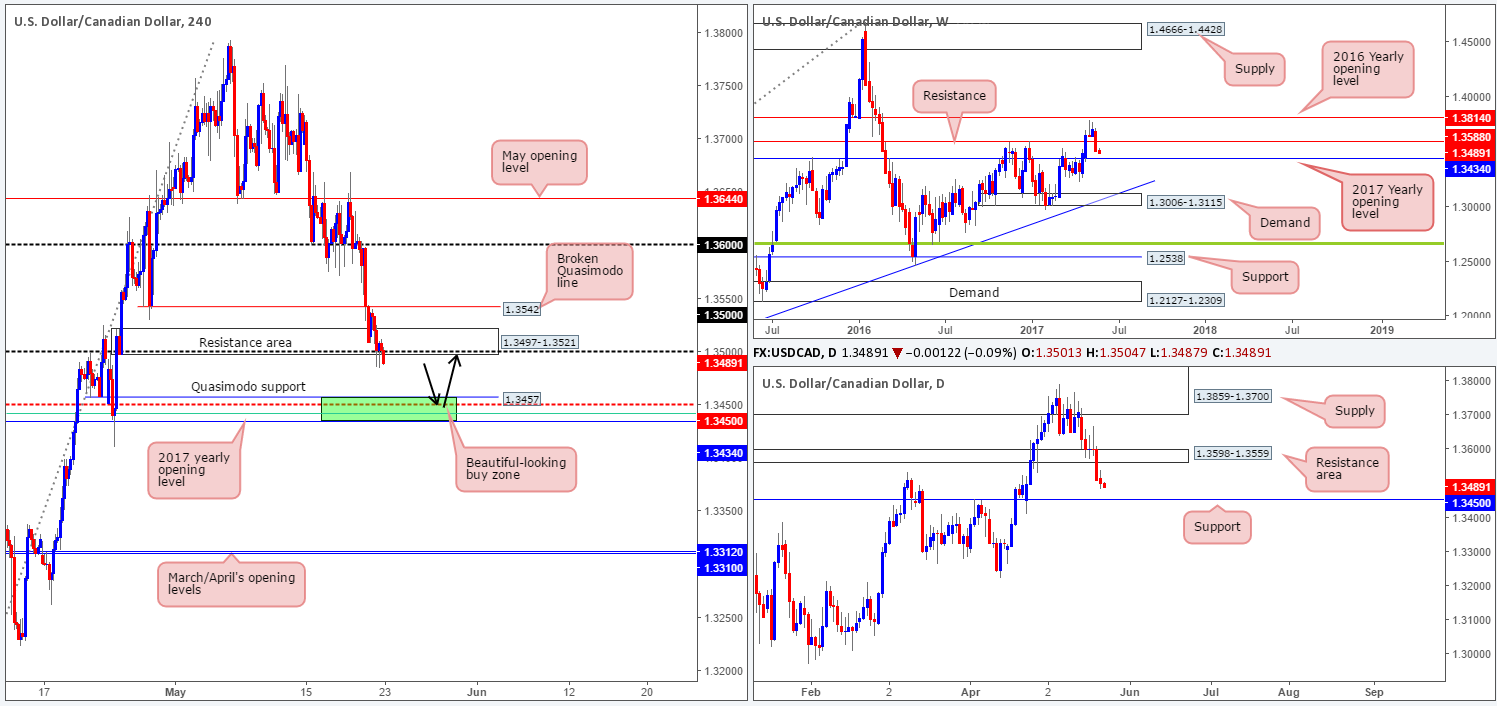
In recent sessions, we saw the USD/CAD respond to the H4 demand base coming in at 1.3497-1.3521. However, as we anticipated, this area did not produce much to get excited about. The reason for this, in our opinion, is due to the far more appealing H4 buy (green) zone formed between 1.3434/1.3457. Comprised of a H4 Quasimodo support at 1.3457, a H4 61.8% Fib support at 1.3441 taken from the low 1.3223 (green line), a H4 mid-level support at 1.3450 which also happens to represent daily support and the 2017 yearly opening level seen on the weekly chart at 1.3434.
Our suggestions: Given the confluence surrounding 1.3434/1.3457, our team has placed a pending buy order around the top edge of this zone at 1.3458. Our stop has been conservatively set just beyond the 24th April low at 1.3410 around 1.3408. Ultimately, the first take-profit zone is going to be somewhere nearby the 1.35 neighborhood.
Data points to consider: Several FOMC members set to take the stage at different times today.
Levels to watch/live orders:
- Buys: 1.3458 ([pending order] stop loss: 1.3408).
- Sells: Flat (stop loss: N/A).
USD/CHF:
As can be seen from the H4 chart this morning, the 0.97 handle elbowed its way into the spotlight during yesterday’s segment and has held beautifully as a support. For all you faithful followers out there, you may recall us mentioning that between the 0.97 number and the daily Quasimodo support at 0.9678, this could be an ideal area to enter long from. However, we also emphasized the importance of waiting for an additional confirming H4 bullish rotation candle to form. This was simply to avoid being faked on a push down to the weekly Quasimodo support at 0.9639.
H4 bulls, as you can see, printed a healthy bullish candle off the 0.97 level yesterday. As much as we were tempted to buy the market following this, the candle was just too big for our liking. The stop loss, if one were to trade conservatively, would have been required to be set below the said daily Quasimodo! This severely impacts risk/reward as the take-profit target is the 0.98 barrier.
Our suggestions: Personally, we’re going to wait and see if H4 price can retest 0.9678/0.97 today. Only this time, we’d like to see it fake yesterday’s low and then print a H4 bullish candle, preferably a full-bodied candle. This would be an ideal signal to enter long from.
Data points to consider: Several FOMC members set to take the stage at different times today.

Levels to watch/live orders:
- Buys: 0.9678/0.97 region ([waiting for a reasonably sized H4 bull candle, preferably a full-bodied candle, to form before pulling the trigger is advised] stop loss: ideally beyond the candle’s tail).
- Sells: Flat (stop loss: N/A).
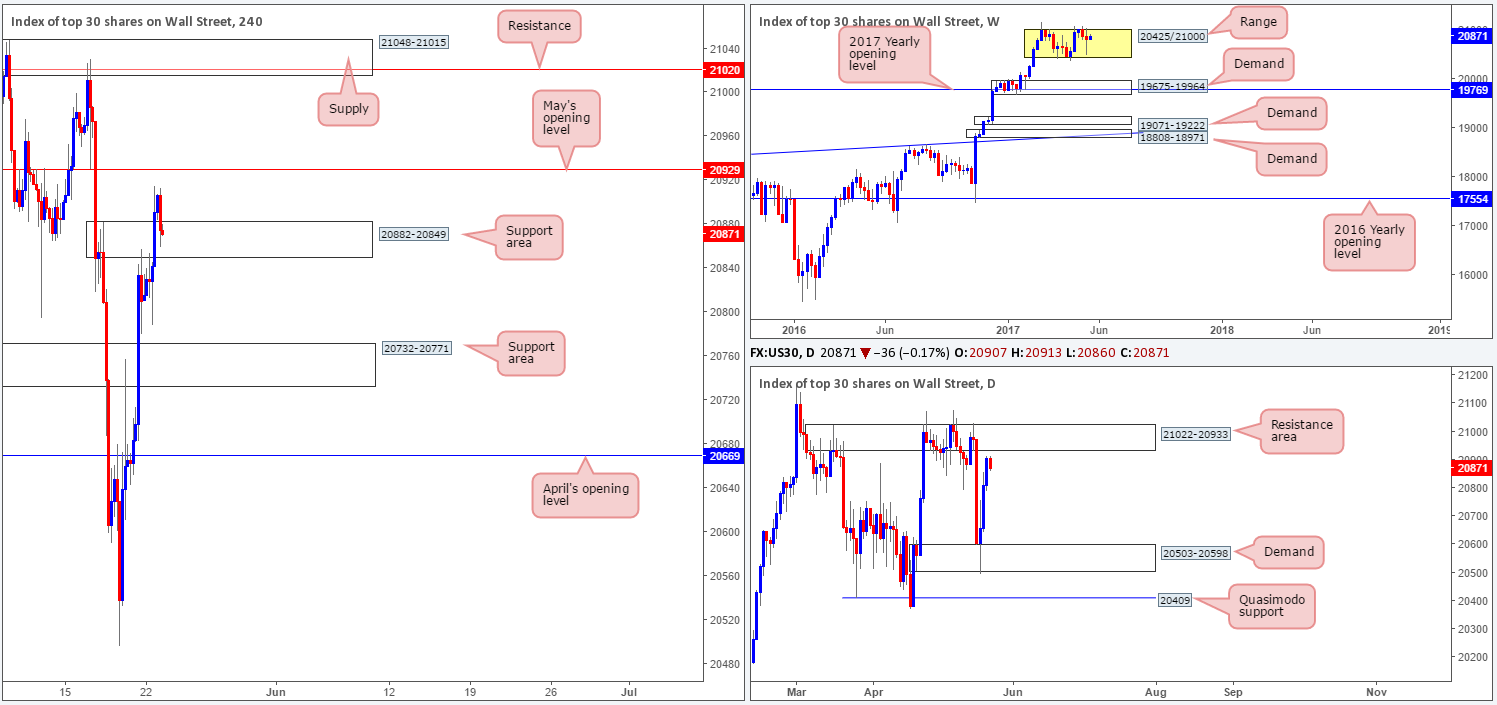
DOW 30:
US equities continued to climb higher on Monday and resulted in price driving through a H4 supply zone coming in at 20882-20849, which, right now, is being retested as a support area. Should this zone hold firm, the next upside target from here is May’s opening base line at 20929.
Over on the weekly chart, the only salient point we can glean from this timeframe is the index appears to be chiseling out a consolidation around record highs of 21170 between 20425/21000. Moving down to the daily timeframe, however, we can see that the unit is trading within shouting distance of a resistance area pegged at 21022-20933.
Our suggestions: Buying this index from the current H4 support area is possible if you’re happy with taking full profits at May’s opening level. This is because this line is situated a few points beneath the underside of the daily resistance area mentioned above! For an entry to be permitted, we would advise waiting for a lower-timeframe confirming signal to form (see the top of this report) before making a play.
Data points to consider: Several FOMC members set to take the stage at different times today.
Levels to watch/live orders:
- Buys: 20882-20849 ([waiting for a lower-timeframe buy signal to form before pulling the trigger is advised] stop loss: dependent on where one confirms the area).
- Sells: Flat (stop loss: N/A).
GOLD:
In recent trading, the price of gold advanced and is now seen teasing the underside of a H4 supply zone drawn from 1268.3-1262.7. Also noteworthy is our long position taken on Thursday from 1249.2 is very close to reaching its second and final take-profit target: the H4 61.8% Fib resistance at 1264.5 (green line) extended from the high 1295.4 seen planted within the said H4 supply.
As for potential setups going forward, we’re at somewhat of a technical crossroads at the moment. On the weekly chart, the yellow metal aggressively recovered from demand at 1194.8-1229.1 during last week’s segment. The move broke a four-week bearish phase, and could potentially drag this market back up to the two weekly Fibonacci extensions 161.8/127.2% at 1313.7/1285.2 taken from the low 1188.1 (green zone) sometime this week.
Before the bulls can form an extension, nevertheless, offers placed around the daily resistance area drawn from 1265.2-1252.1 will need to be consumed. A decisive (daily) close beyond this zone would likely confirm further buying up to not only the 1313.7/1285.2 area seen on the weekly chart, but also quite possibly the daily Quasimodo resistance level seen at 1307.8.
Our suggestions: Yes, shorts could be a possibility from within the current H4 supply, but we’re really not happy with this given the position of price on the weekly chart right now. So, with that in mind, we’re going to continue running with our current position until the take profit is achieved, and then assess structure going into tomorrow’s open.

Levels to watch/live orders:
- Buys: 1249.2 ([live] stop loss: breakeven).
- Sells: Flat (stop loss: N/A).


