EUR/USD:
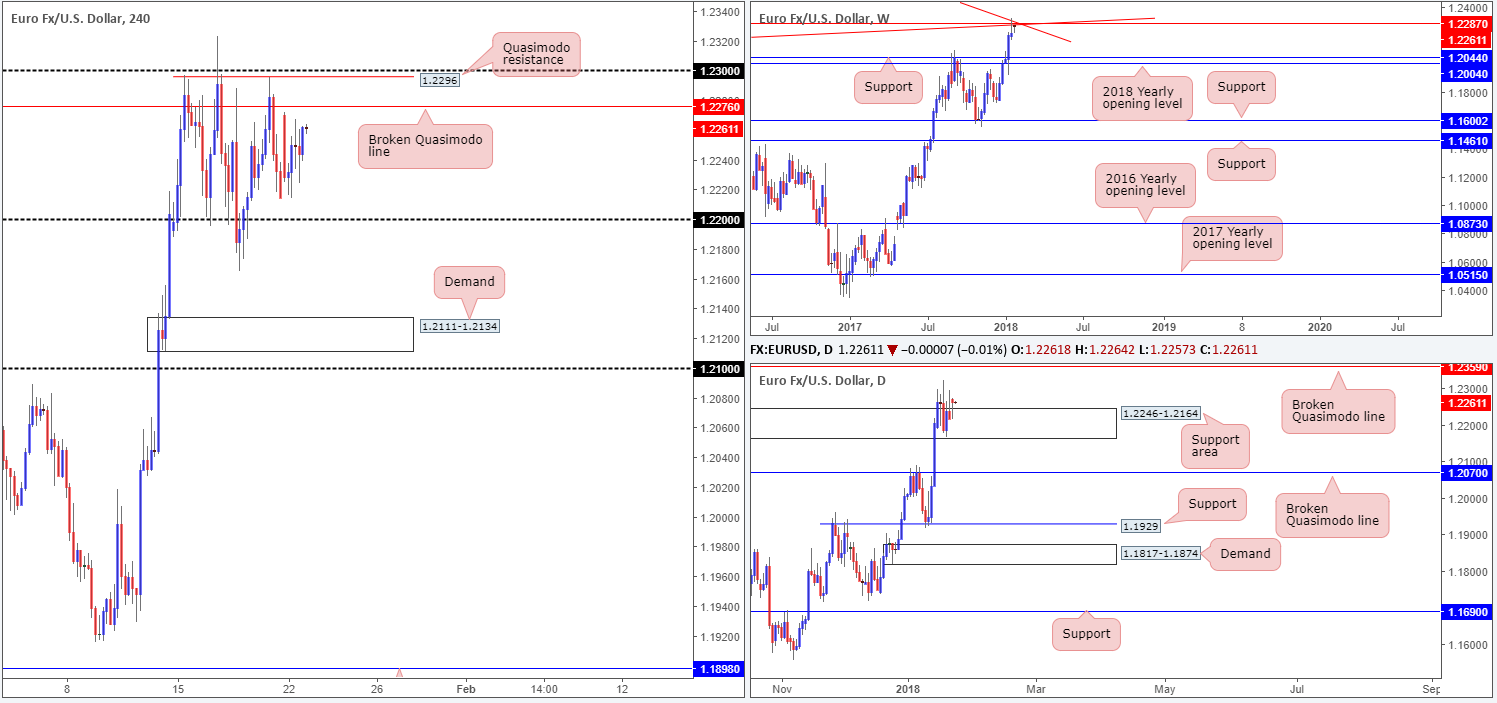
Kicking this morning’s report off from the weekly timeframe, we can see that price remains capped beneath a weekly broken Quasimodo line at 1.2287 that merges with two weekly trendline resistances (1.1641/1.6038). In the event that the bears switch into a higher gear here, keep an eyeball on weekly support seen at 1.2044 and the 2018 yearly opening level drawn from 1.2004.
Daily action, on other hand, continues to consolidate around the top edge of a daily support area at 1.2246-1.2164 (note yesterday’s buying tail). A violation of this zone this week may unlock downside to as far south as a daily broken Quasimodo line at 1.2070 – positioned a few pips above the noted weekly support targets. A move higher, nevertheless, has the daily broken Quasimodo line penciled in from 1.2359 to target.
Across on the H4 timeframe, the candles are seen lodged between a H4 broken Quasimodo line at 1.2276 and the 1.22 handle. Directly above we have the Quasimodo resistance level sited at 1.2296, while below 1.22, a H4 demand base at 1.2111-1.2134 is in sight.
Market direction:
Weekly price indicates a potential selloff, while daily price would need to overcome the current daily support area to achieve this. To become sellers in this market, we still believe that a decisive H4 close beyond the 1.22 neighborhood could serve as a prospective sell signal. A retest to the underside of 1.22, followed up with a full or near-full-bodied H4 bearish candle would, in our opinion, offer a strong selling environment, targeting H4 demand at 1.2111-1.2134/1.21 handle as initial take-profit targets. The reason for requiring additional candle confirmation is simply due to the noted daily support area.
Data points to consider: German ZEW economic sentiment at 10am GMT.
Areas worthy of attention:
Supports: 1.2111-1.2134; 1.22 handle; 1.2044; 1.2004; 1.2070.
Resistances: 1.2287; weekly trendline resistances; 1.2276; 1.2296; 1.23 handle; 1.2359.
GBP/USD:
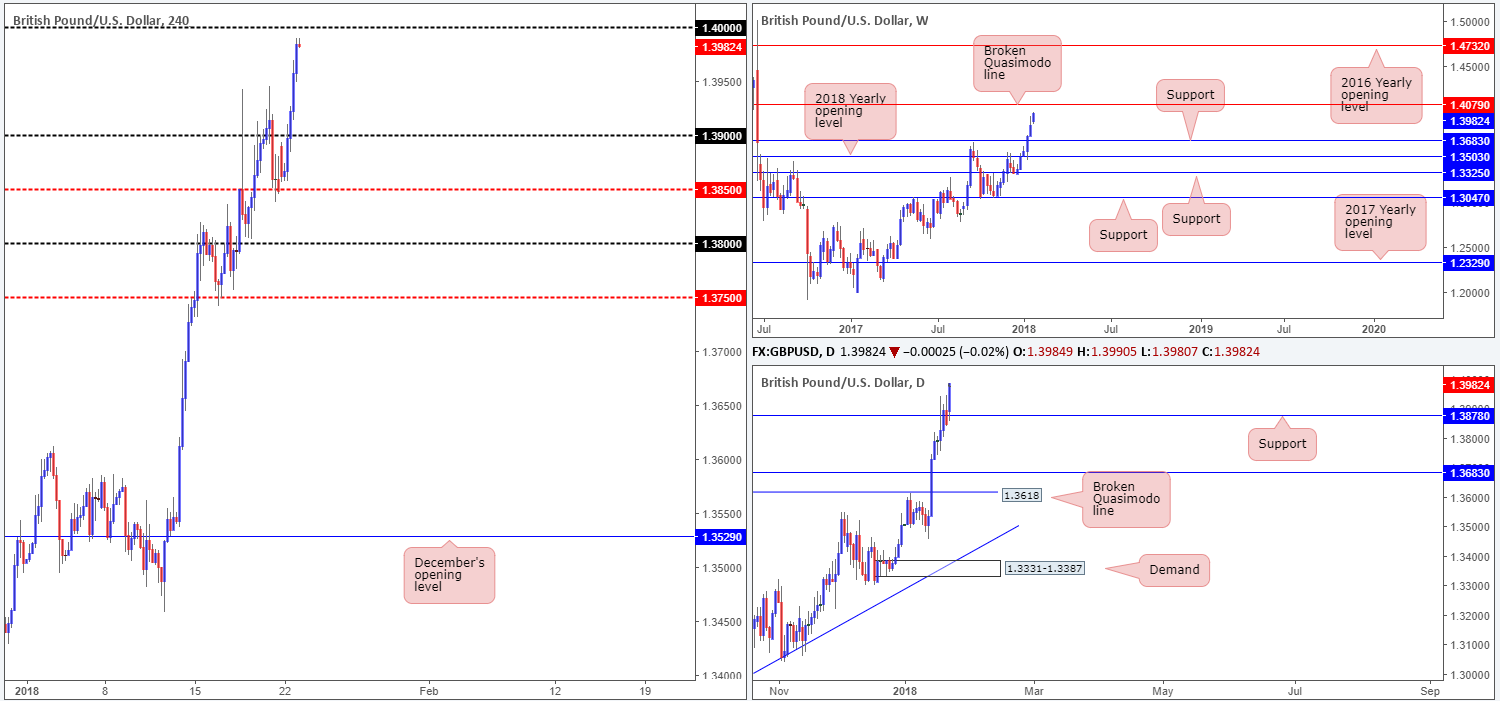
GBP/USD bulls went on the offensive amid Monday’s segment, powering through the 1.39 handle and closing the day within striking distance of the large psychological number 1.40. As far as we can see, this recent bout of buying lacked fresh fundamental drivers other than a mildly weak US dollar.
According to technicals on the weekly timeframe, the next upside objective for this market can be seen at 1.4079: a weekly broken Quasimodo line. Looking down to the daily timeframe, resistance at 1.3878 was taken out during yesterday’s advance (now acting support), further adding weight to a possible continuation in buying.
Market direction:
The 1.40 level will likely be a tough nut to crack given it is a watched number in this market. If this number is erased, then we see little stopping the British pound from rallying higher to challenge the weekly resistance highlighted above.
A sell from 1.40 would, in our view, require additional confirmation as you’re selling into strength. Waiting for a H4 full or near-full-bodied candle to form is likely enough to display seller intent.
To buy above 1.40, waiting for H4 price to retest the level as support before pulling the trigger may be something to consider. The reason being is that psychological numbers tend to attract fakeouts.
Data points to consider: UK public sector net borrowing at 9.30am GMT.
Areas worthy of attention:
Supports: 1.39 handle; 1.3878.
Resistances: 1.40 handle; 1.4079.
AUD/USD:
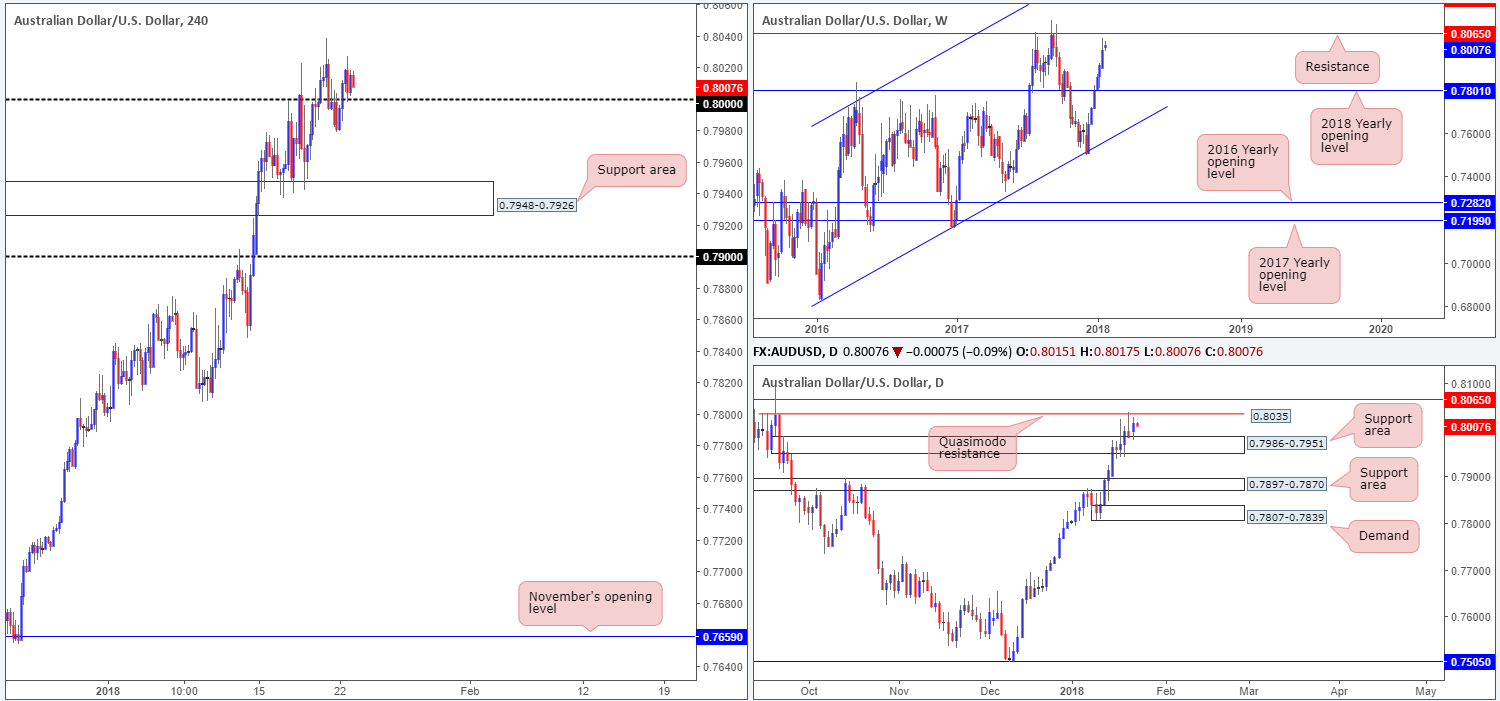
The AUD/USD pair reclaimed the 0.80 psychological band in early London hours on Monday in reasonably strong fashion. The number was later retested as support during the US morning session, and held firm into the day’s close. This, to a lot of traders, is considered a bullish signal – even more so considering the Aussie recorded its sixth consecutive weekly gain last week.
While 0.80 is likely bolstered by the daily support area coming in at 0.7986-0.7951, traders might want to note that just ahead of current price there’s a daily Quasimodo resistance level at 0.8035, followed closely by a weekly resistance level plotted at 0.8065.
Market direction:
Further buying is likely, at least until we reach the 0.8035 region. Therefore, intraday buyers from here might want to consider reducing risk at this point. If we glide through 0.8035, the next point of concern for buyers, as highlighted above, would be 0.8065. This is a weekly base with strong history, so the odds of a bounce lower from this angle is high, in our opinion.
Data points to consider: No high-impacting events on the docket today.
Areas worthy of attention:
Supports: 0.80 handle; 0.7986-0.7951.
Resistances: 0.8065; 0.8035.
USD/JPY:
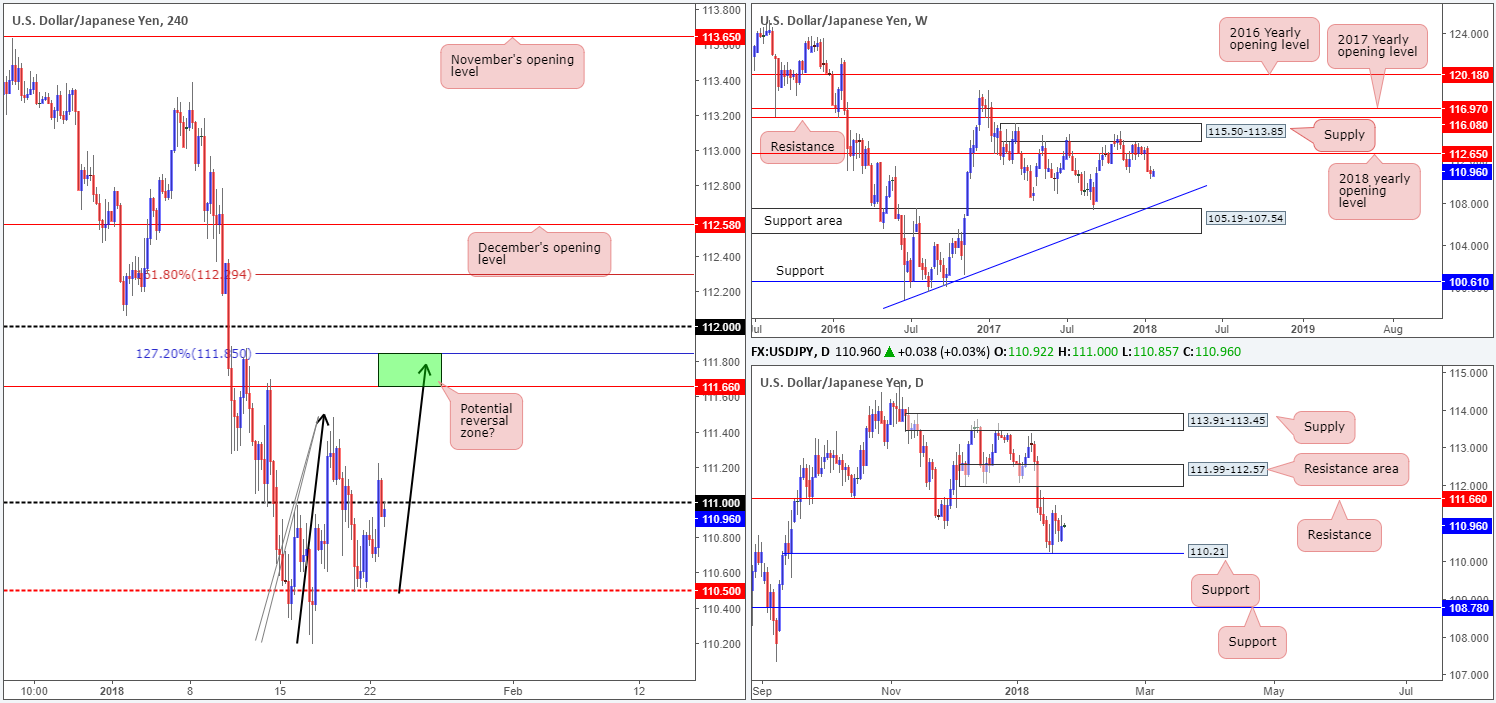
The US dollar pressed higher in the early hours of US trading on Monday, consequently chewing through the 111 handle seen on the H4 timeframe and managing to reach a high of 111.22. H4 price, as you can see though, failed to sustain gains beyond this point, and rotated back below 111.
Turning our attention over to the daily candles, it is clearly seen that the pair remains housed between a daily support at 110.21 and a daily resistance coming in at 111.66. This daily resistance level is interesting as a potential sell zone. A significant close above the nearby 111 handle on the H4 chart would, as far as we can see, open up the trapdoor for price to challenge the aforementioned daily resistance. Alongside this, the H4 approach would meet the characteristics required for an AB=CD (black arrows) H4 bearish formation, topping at 111.85 (127.2% Fib ext. point).
Market direction:
As already mentioned, a decisive H4 move through 111 could lead to an advance being seen up to the noted daily resistance level. For that reason, longs above 111 (preferably following a successful retest – try to avoid buying the breakout) could be an option, targeting the 111.85/111.66 green region on the H4 timeframe.
Data points to consider: JPY monetary policy statement, BoJ outlook report and BoJ policy rate at 4am GMT; BoJ press conference at 6.30am GMT.
Areas worthy of attention:
Supports: 110.50; 110.21.
Resistances: 111 handle; 111.66; 111.85.
USD/CAD:
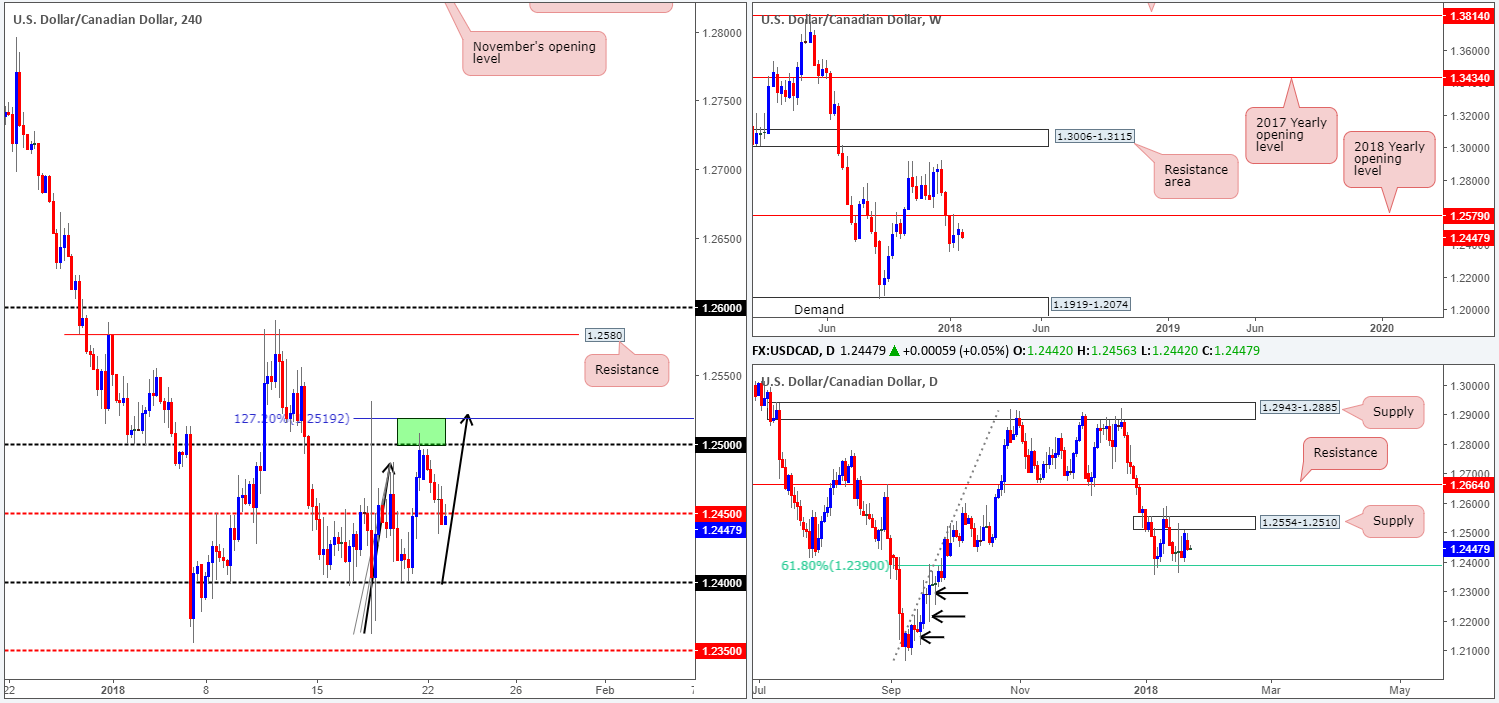
The USD/CAD, as you can see, eased off from the 1.25 handle seen on the H4 timeframe during Monday’s segment, dropping below H4 mid-level support at 1.2450 into the close. Assuming that 1.2450 holds firm as resistance, the next level eyed is the 1.24 handle, shadowed closely by 1.2390: a daily 61.8% Fib support. 1.2390 forms the lower edge to a daily range that has been in play since early January. The top edge of this consolidation can be seen in the form of a daily supply base drawn from 1.2554-1.2510.
Market direction:
Short term, we believe that further selling could be on the cards, at least until we reach the 1.24 neighborhood. To take advantage of this potential move, you may want to consider drilling down to the lower timeframes to pin down an entry. This will likely lower the stop-loss distance required and thus provide a more respectable risk/reward on the trade.
Data points to consider: No high-impacting events on the docket today.
Areas worthy of attention:
Supports: 1.24 handle; 1.2390.
Resistances: 1.25 handle; 1.2450; 1.2554-1.2510.
USD/CHF:
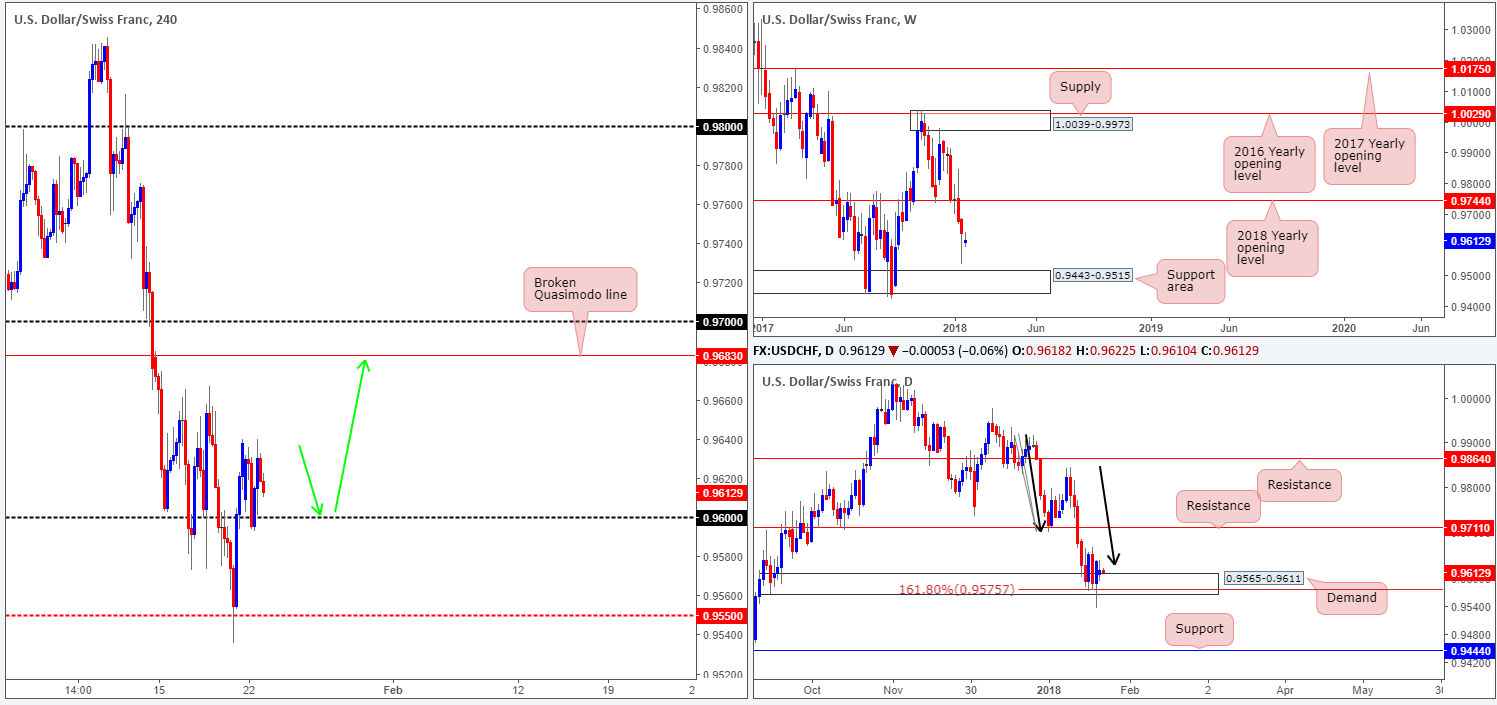
During the course of yesterday’s sessions, the USD/CHF market retested the 0.96 handle and remained firm. We highlighted in Monday’s outlook that if the H4 candles were to remain supported above 0.96 handle, the 0.97 handle and H4 broken Quasimodo line at 0.9683 were likely going to be brought into the fray.
The above is potentially bolstered by the fact that daily price is trading from a daily demand area at 0.9565-0.9611 and a daily AB=CD (see black arrows) 161.8% Fib ext. point at 0.9575. Despite this area suffering a whipsaw on Friday, the zone is still in motion!
Market direction:
Given the recent pullback from yesterday’s high of 0.9639, the 0.96 handle will likely be retested again today. Should this line, once again, hold ground, the 0.97ish region will likely be challenged today/this week. Before pulling the trigger here, though, waiting for a H4 full or near-full-bodied bullish candle to form is advised, as round numbers are prone to fakeouts.
Data points to consider: No high-impacting events on the docket today.
Areas worthy of attention:
Supports: 0.96 handle; 0.9565-0.9611; 0.9575.
Resistances: 0.97 handle; 0.9683.
DOW 30:
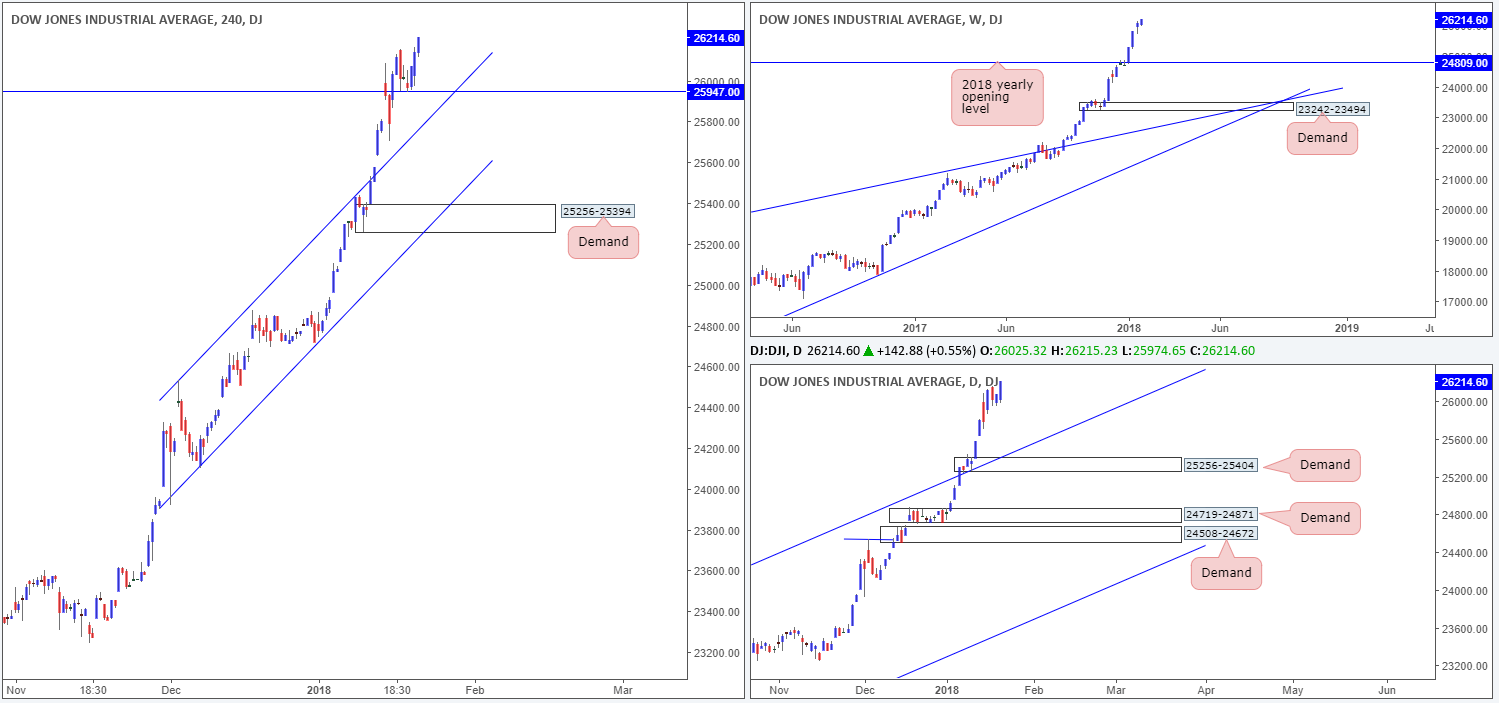
Friday’s closing H4 candle (a full-bodied formation) seen from a local H4 support level planted at 25947 was clearly enough to excite buyers during Monday’s session. Well done to any of our readers who managed to catch this move as the index rallied to record highs of 26215.
A pullback on the weekly timeframe could see the index dip as low as the 2018 yearly opening level at 24809. The next port of support on the daily timeframe, however, can be seen in the form of a daily channel resistance-turned support extended from the high 21169. A violation of this line would open the floor to a potential test of daily demand marked at 25256-25404.
Market direction:
Further upside remains favored.
Near term, the following levels are of interest for potential buying opportunities are as follows:
- · The current H4 support at 25947. Should the level be retested for a second time, watch for a H4 (candle) response off of this angle.
- · The broken H4 channel resistance-turned support.
Data points to consider: No high-impacting events on the docket today.
Areas worthy of attention:
Supports: 25947; H4 channel support; 24809; Daily channel support; 25256-25404.
Resistances: …
GOLD:
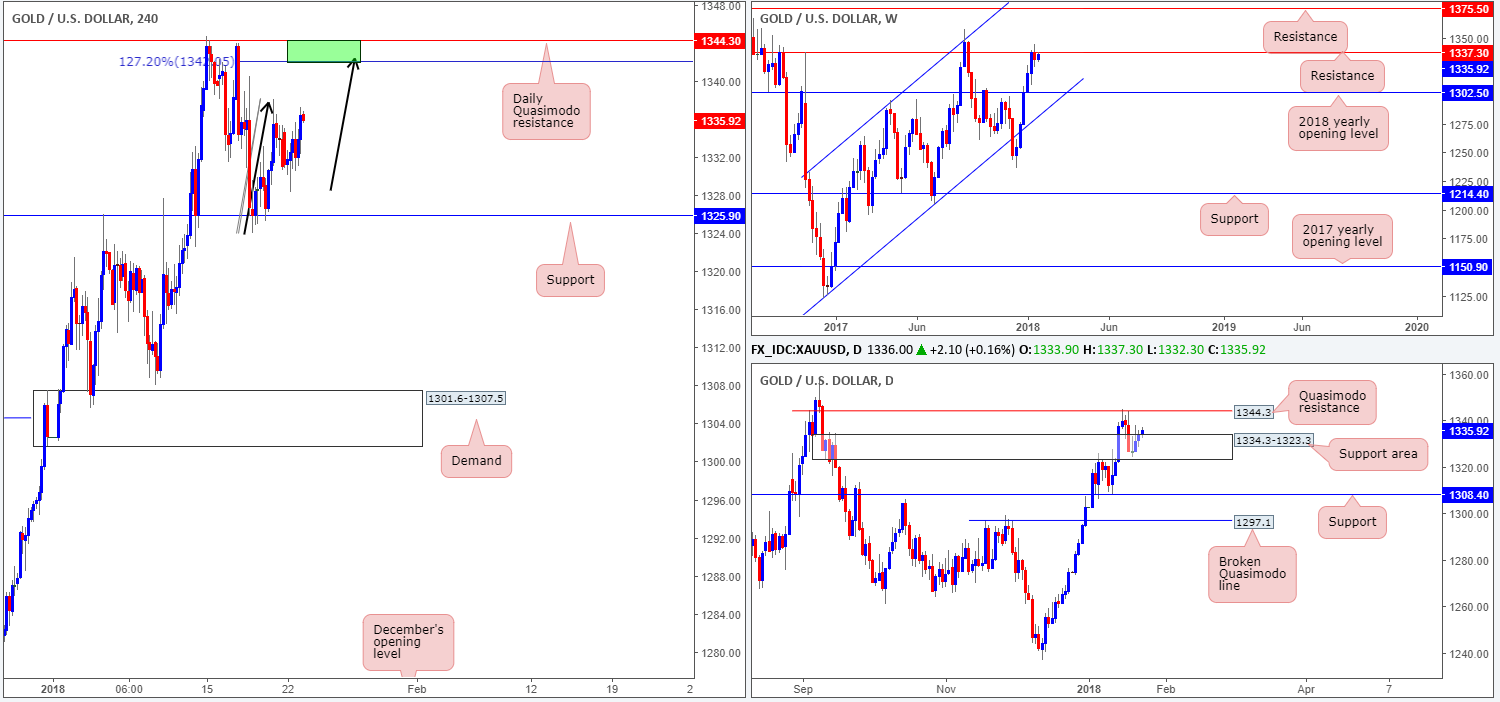
As we write, gold is seen kissing the underside of a weekly resistance level coming in at 1337.3. A move lower from here has the 2018 yearly opening level at 1302.5 to target, whereas a topside breach of 1337.3 may attract further buying up to a weekly resistance level plotted at 1375.5.
Daily buyers continue to uphold the daily support area at 1334.3-1323.3. Continued buying from this point would land price action around the daily Quasimodo resistance level seen at 1344.3.
H4 support at 1325.9, seen planted within the lower limits of the noted daily support area, remains in the picture after a beautiful rotation from here was seen last Wednesday. It is early days, but the H4 candles may also be chalking up a H4 AB=CD (see black arrows) 127.2% Fib ext. at 1342.0, which, as you can see, is positioned around the aforementioned weekly resistance level and a few pips beneath the daily Quasimodo resistance level.
Market direction:
Unless the H4 AB=CD formation completes, this is not a market that we feel is tradable at current prices. A completion of this pattern would, at least in our technical opinion, serve as a strong sell zone.
Areas worthy of attention:
Supports: 1325.9; 1334.3-1323.3; 1302.5.
Resistances: 1344.3; 1342.0; 1337.3; 1375.5.
This site has been designed for informational and educational purposes only and does not constitute an offer to sell nor a solicitation of an offer to buy any products which may be referenced upon the site. The services and information provided through this site are for personal, non-commercial, educational use and display. IC Markets does not provide personal trading advice through this site and does not represent that the products or services discussed are suitable for any trader. Traders are advised not to rely on any information contained in the site in the process of making a fully informed decision.
This site may include market analysis. All ideas, opinions, and/or forecasts, expressed or implied herein, information, charts or examples contained in the lessons, are for informational and educational purposes only and should not be construed as a recommendation to invest, trade, and/or speculate in the markets. Any trades, and/or speculations made in light of the ideas, opinions, and/or forecasts, expressed or implied herein, are committed at your own risk, financial or otherwise.
The use of the site is agreement that the site is for informational and educational purposes only and does not constitute advice in any form in the furtherance of any trade or trading decisions.
The accuracy, completeness and timeliness of the information contained on this site cannot be guaranteed. IC Markets does not warranty, guarantee or make any representations, or assume any liability with regard to financial results based on the use of the information in the site.
News, views, opinions, recommendations and other information obtained from sources outside of www.icmarkets.com.au, used in this site are believed to be reliable, but we cannot guarantee their accuracy or completeness. All such information is subject to change at any time without notice. IC Markets assumes no responsibility for the content of any linked site. The fact that such links may exist does not indicate approval or endorsement of any material contained on any linked site.
IC Markets is not liable for any harm caused by the transmission, through accessing the services or information on this site, of a computer virus, or other computer code or programming device that might be used to access, delete, damage, disable, disrupt or otherwise impede in any manner, the operation of the site or of any user’s software, hardware, data or property.