A note on lower timeframe confirming price action…
Waiting for lower timeframe confirmation is our main tool to confirm strength within higher timeframe zones, and has really been the key to our trading success. It takes a little time to understand the subtle nuances, however, as each trade is never the same, but once you master the rhythm so to speak, you will be saved from countless unnecessary losing trades. The following is a list of what we look for:
- A break/retest of supply or demand dependent on which way you’re trading.
- A trendline break/retest.
- Buying/selling tails/wicks – essentially we look for a cluster of very obvious spikes off of lower timeframe support and resistance levels within the higher timeframe zone.
- Candlestick patterns. We tend to only stick with pin bars and engulfing bars as these have proven to be the most effective.
We search for lower timeframe confirmation between the M15 and H1 timeframes, since most of our higher-timeframe areas begin with the H4. Stops are usually placed 5-10 pips beyond confirming structures.
EUR/USD:
Bolstered by a sell off from a H4 supply at 95.10-94.87 over on the US dollar index yesterday, the shared currency found a pocket of bids around the 1.1280ish mark, consequently reversing earlier losses and tapping a high of 1.1330 by the day’s end.
Despite the daily picture chalking up a relatively strong-looking buying tail yesterday and H4 action closing back above the 1.13 handle, our team still favors further downside to at least the daily support area fixed at 1.1224-1.1104.The main ingredient behind our current line of thought stems from weekly price currently inhabiting a long-term weekly resistance area coming in at 1.1533-1.1278.
Our suggestions: Our team still remains short from 1.1362 with 50% of our position already banked and the stop set firmly at breakeven. Ultimately, we’re targeting the 1.1250/1.1237 range (H4 mid-way support/H4 support), since this area sits just above the aforementioned daily support area. On that note, a strong close beyond the 1.13 band today followed by a retest along with a lower timeframe sell signal (see the top of this report), is, in our opinion, enough to condone an intraday sell position targeting the 1.1250/1.1237 region.
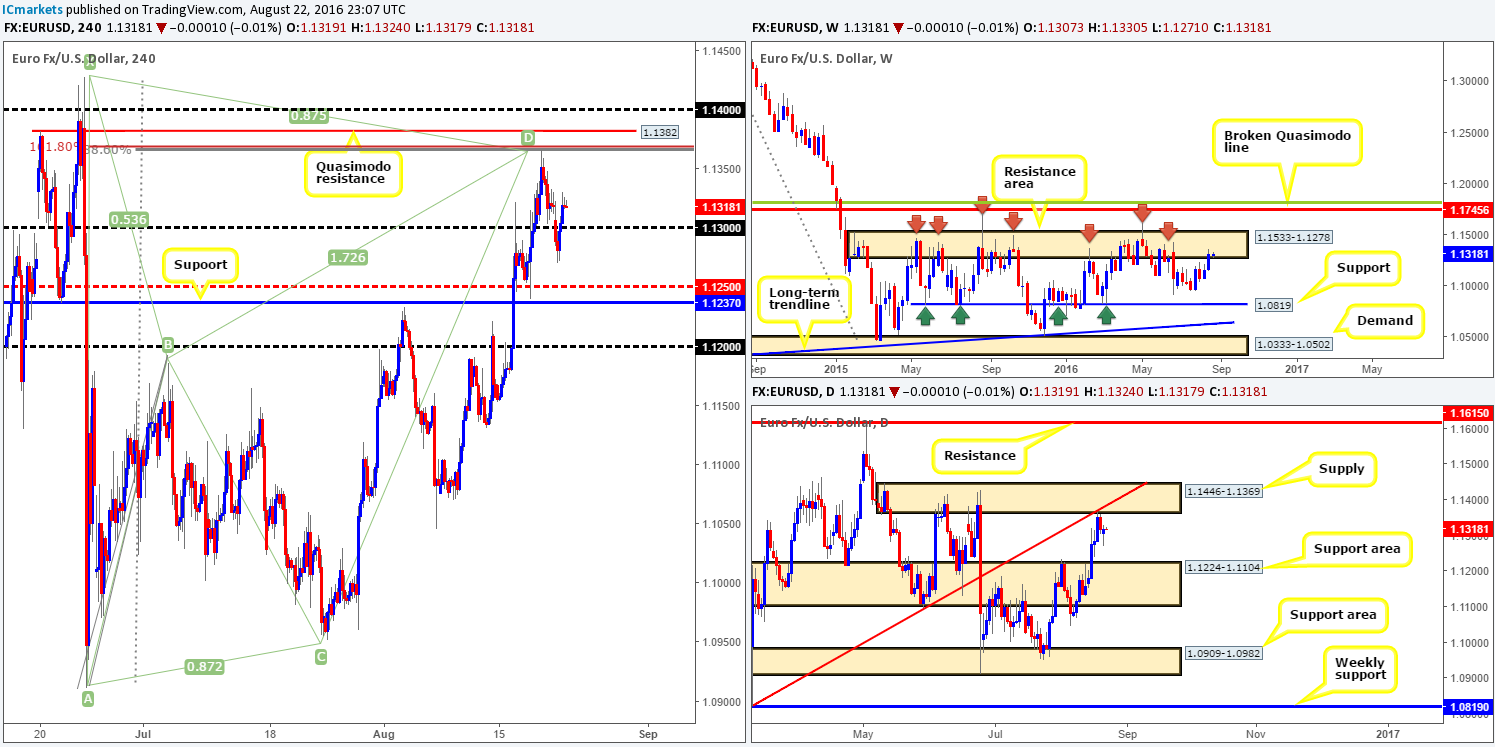
Levels to watch/live orders:
- Buys: Flat (Stop loss: N/A).
- Sells: 1.1362 [LIVE] (Stop loss: Breakeven). Watch for price to close below 1.13 and then look to trade any retest seen thereafter (lower timeframe confirmation required).
GBP/USD:
Shortly after the week’s open, cable rocketed north from a H4 support line seen at 1.3034. Going into yesterday’s London’s session the pair closed above the 1.31 band, but it was not until the US session kicked in did we see price reach highs of 1.3157.
With price action stabilizing around the 1.3150 region at the moment, let’s see how the land lies on the higher-timeframe picture. Over on the daily chart, we can see that price has closed back above resistance at 1.3104, thus potentially opening up the path north for a run towards daily supply coming in at 1.3371-1.3279. In support of this move, weekly candles recently chalked up a relatively nice-looking bullish engulfing candle last week, which could possibly propel sterling north this week.
Although there is some indication that this pair may rally, one has to bear in mind that the predominant trend remains firmly pointing south.
Our suggestions: Watch for price to retest 1.31 today. Should this come into view and one is able to spot a lower timeframe buy signal (see the top of this report), a long from this platform is valid in our opinion, targeting 1.32, followed by the H4 harmonic Gartley reversal zone seen between 1.3346/1.3263 (green zone).
The other key thing to note here is, given that this H4 harmonic area is lodged within the daily supply mentioned above at 1.3371-1.3279, it’s a beautiful zone not only for taking profits but also for selling!
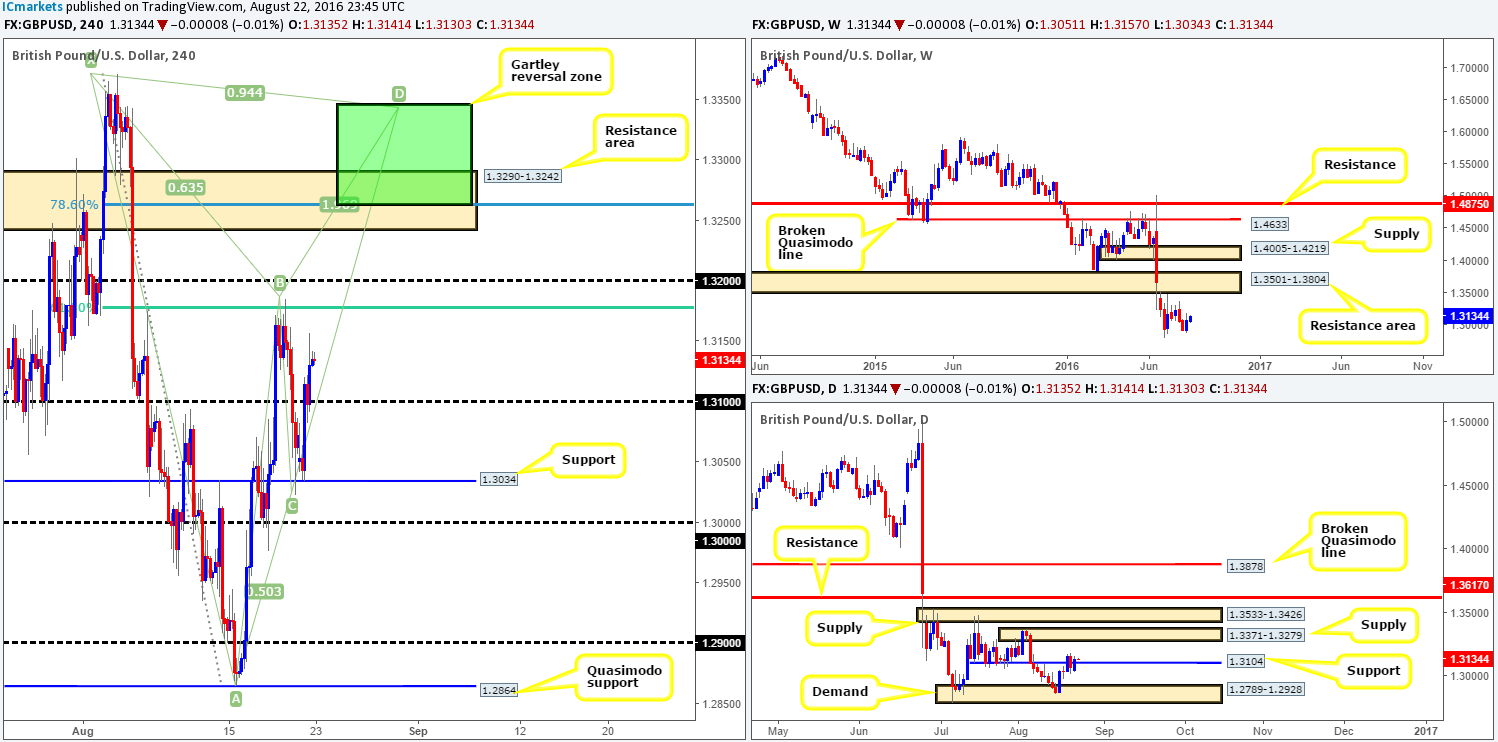
Levels to watch/live orders:
- Buys: 1.31 region [Tentative – confirmation required] (Stop loss: dependent on where one confirms this area).
- Sells: 1.3346/1.3263 (Keep a close eye on this area as it boasts strong confluence).
AUD/USD:
Aussie bulls went on the offensive yesterday from a H4 channel support line extended from the low 0.7636, following a brief stint below the 0.76 handle. Having reached a high of 0.7639, the pair is currently seen loitering mid-range between 0.76/0.7650.
Technically speaking, yesterday’s advance was also likely bolstered by the fact that weekly action is currently kissing a support level registered at 0.7604. However, before we all go clicking the buy button, an important thing to consider here is that daily movement recently closed below a channel support line taken from the low 0.7148 (a bearish signal), and is within touching distance of being retested as resistance!
Our suggestions: Through the simple lens of a technical trader, technical elements are mixed at the moment (a buy would place one against potential daily sellers, while a sell forces one to go toe-to-toe with potential weekly buyers) leaving us with little choice but to remain flat for now.
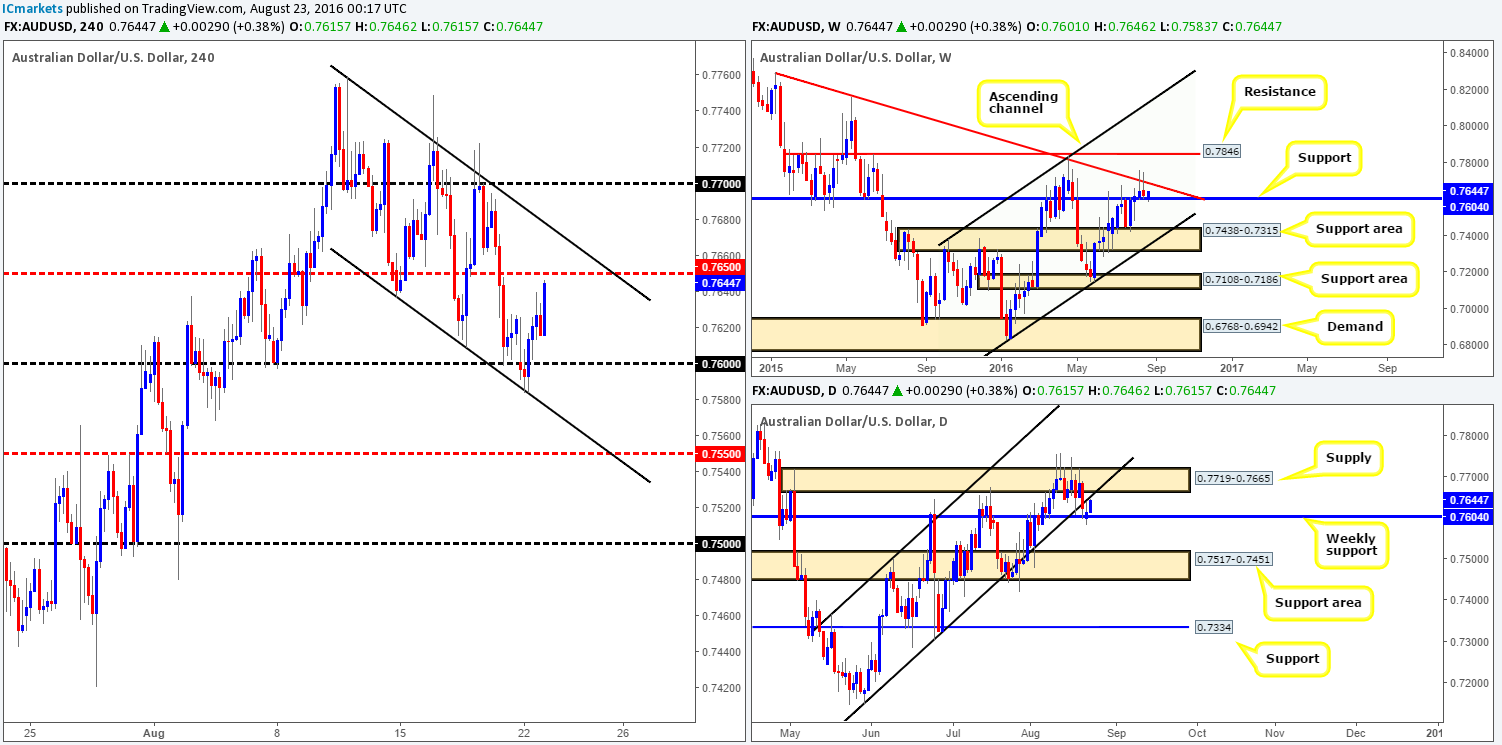
Levels to watch/live orders:
- Buys: Flat (Stop loss: N/A).
- Sells: Flat (Stop loss: N/A).
USD/JPY:
From a technical standpoint the USD/JPY pair has entered into a phase of consolidation fixed between the key figure 100 and the 101 handle. The 101 band is likely to remain a strong resistance with it having been a solid support on several occasions from the beginning of August. Nevertheless, the 100 hurdle is also proving to be a stubborn beast!
However, with higher-timeframe action seen rotating from the underside of weekly resistance at 100.61 yesterday, 100 will likely come under pressure once again today. A decisive H4 close below here followed by a strong retest would, at least in our book, confirm selling strength in this market and likely push the unit south to test H4 support at 99.15, which merges beautifully with a H4 channel support line drawn from the low 100.68 (sits above a daily support at 98.78 which is also positioned above weekly demand at 96.56-98.59).
Our suggestions: An ideal setup would be to witness a decisive close below 100 along with a retest and a lower timeframe sell signal (see the top of this report), targeting the above noted H4 support.
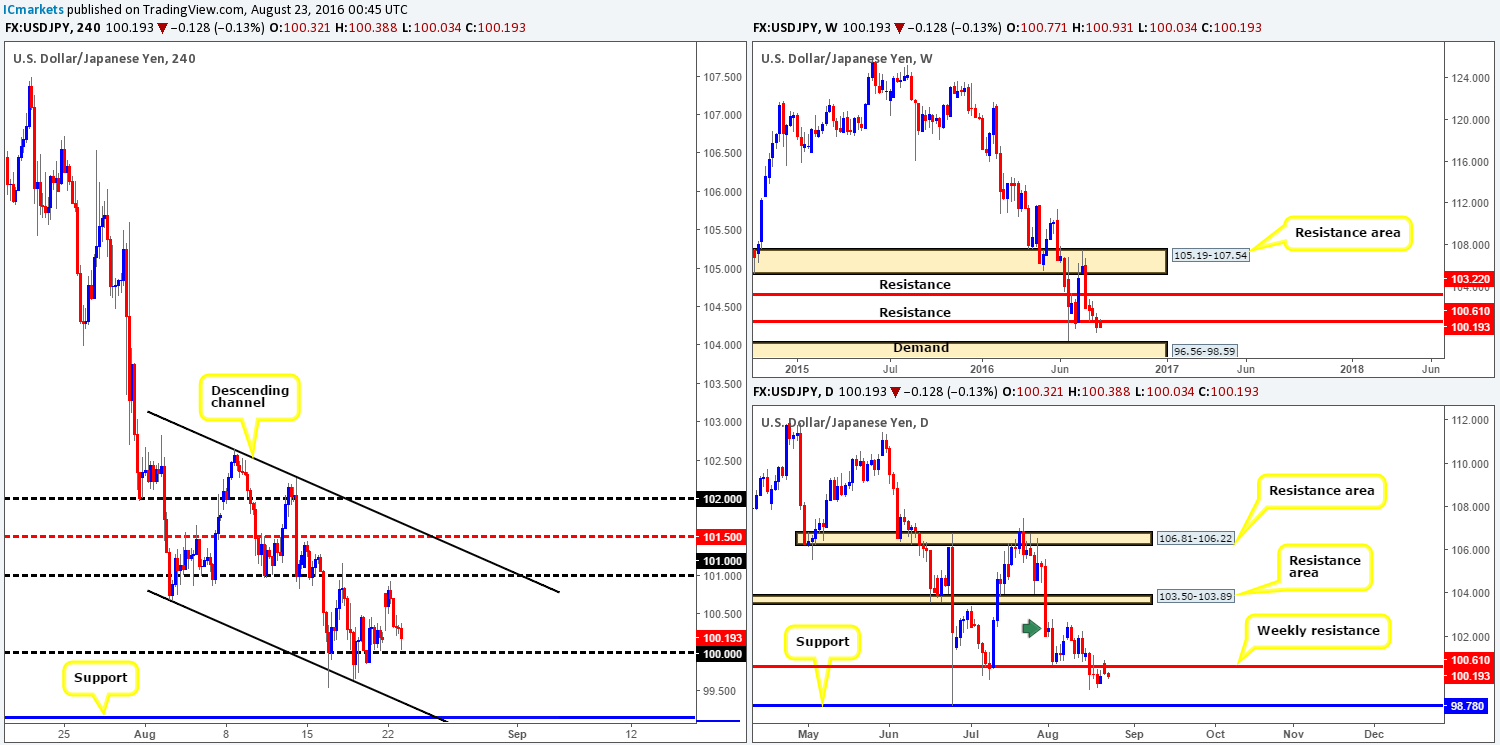
Levels to watch/live orders:
- Buys: Flat (Stop loss: N/A).
- Sells: Watch for price to close below the 100 handle and then look to trade any retest seen thereafter (lower timeframe confirmation required).
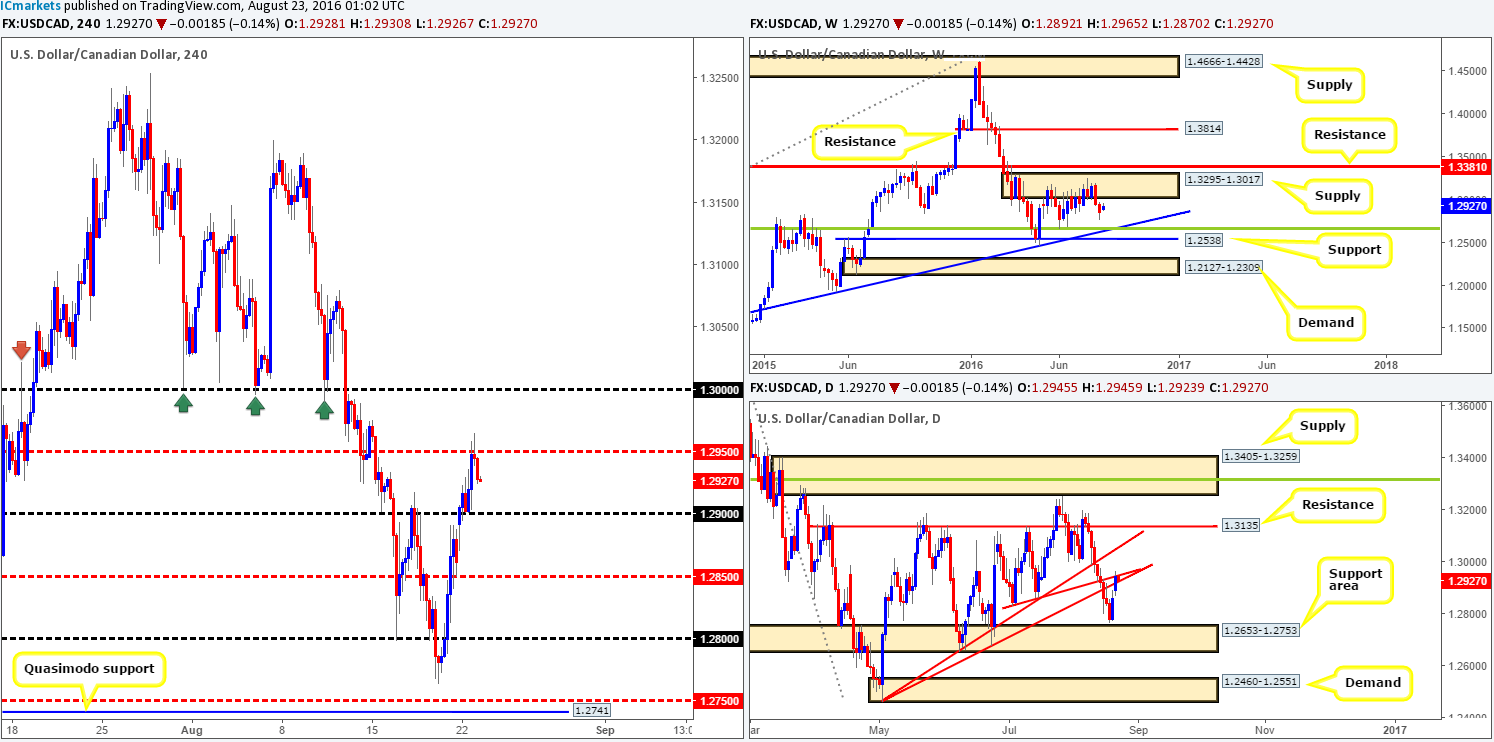
USD/CAD:
In recent trading, we saw price retest the 1.29 band and rally up to the H4 mid-way resistance 1.2950, which, as you can see, is currently being respected. In our estimation, this reaction could fuel further downside in this market today, due to daily price also seen retesting the underside of two daily trendline resistances (1.2460/1.2831). Furthermore, let’s not forget where weekly action is trading from: a weekly supply area coming in at 1.3295-1.3017.
Our suggestions: Keep an eye on the lower timeframes around the 1.2650 region today (see the top of this report for a list of lower timeframe entry techniques). Should one manage to pin down an entry from here, we’d initially be looking to target 1.29. From thereon, we’d trail price (using the psychological barriers) down to the 1.2750ish range. Why 1.2750? Well, this is simply because this number represents the top edge of the daily support area at 1.2653-1.2753, which is the next downside target on the higher timeframes.
Levels to watch/live orders
- Buys: Flat (Stop loss: N/A).
- Sells: 1.2950 region [Tentative – confirmation required] (Stop loss: dependent on where one confirms this area).
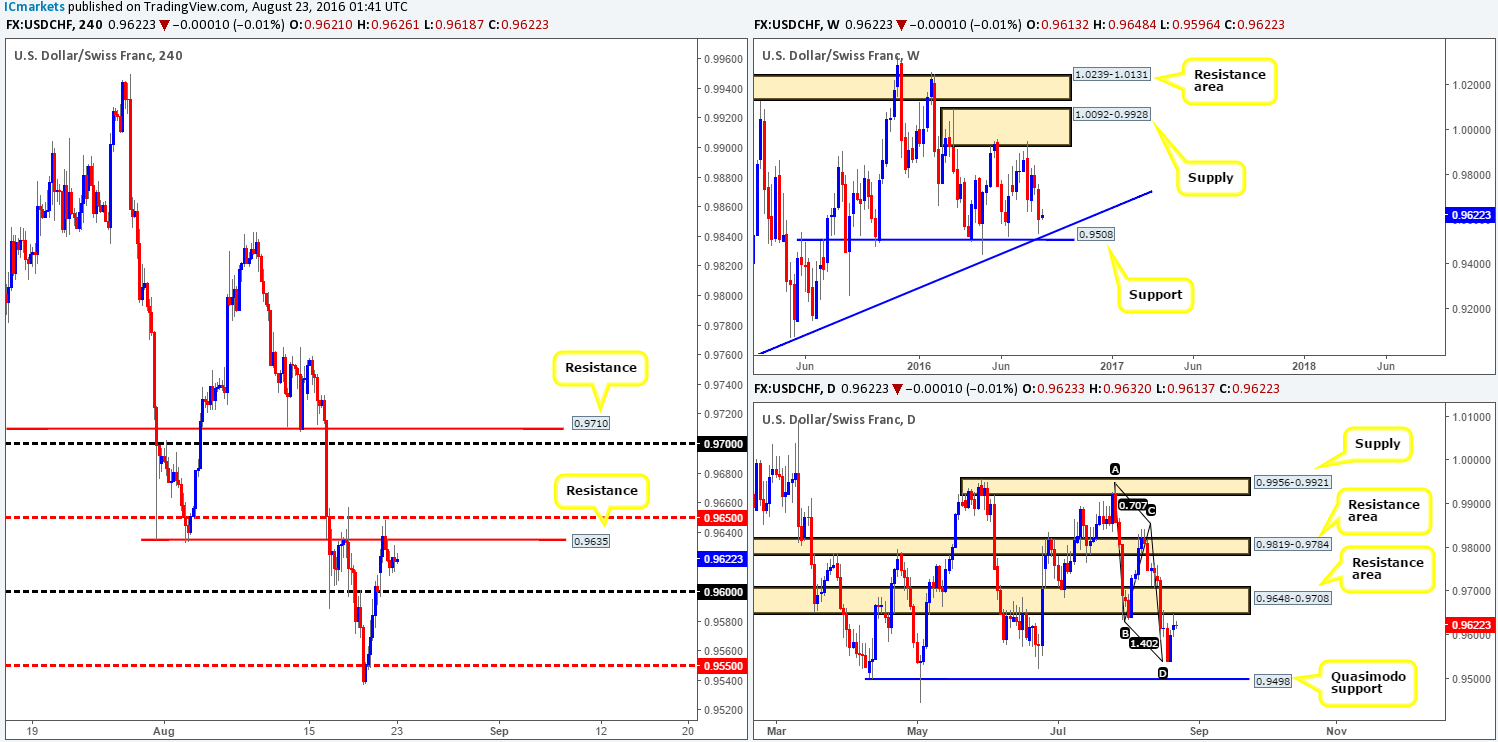
USD/CHF:
Kicking off Tuesday’s report with a look at the weekly chart reveals that price came within shouting distance of connecting with support at 0.9508, which happens to fuse nicely with a trendline support extended from the low 0.8703. On the flip side, looking down to the daily chart we can see that the unit recently retested the underside of a relatively long-term resistance area at 0.9648-0.9708. This could, given the area’s history, potentially hold the candles lower this week. Stepping across to the H4 chart, however, the H4 mid-way resistance 0.9650 along with the nearby H4 resistance 0.9635, as expected, held the Swissy lower yesterday.
In view of the above points, it is proving difficult to pin down market direction. On the one hand, weekly buyers may load up from here and push this market north. On the other hand, we may see daily sellers make an appearance and pull the pair down to the daily Quasimodo support level at 0.9498, which sits just a few pips beneath the aforementioned weekly support line.
Our suggestions: One can play this one of three ways in our opinion. Firstly, one could simply remain flat and move on to another pair. Secondly, traders could look to sell from the 0.9650/0.9635 region with the backing of a lower timeframe sell signal (see the top of this report), targeting 0.96, followed by the 0.9550 region. And finally, we could wait for a close above 0.9650 today and look to trade any retest seen thereafter (again with the backing of a lower timeframe buy signal), targeting the 0.9710/0.97 range.
Levels to watch/live orders:
- Buys: Watch for price to close above the 0.9650/0.9635 area and then look to trade any retest seen thereafter (lower timeframe confirmation required).
- Sells: 0.9650/0.9635 [Tentative – confirmation required] (Stop loss: dependent on where one confirms this area).
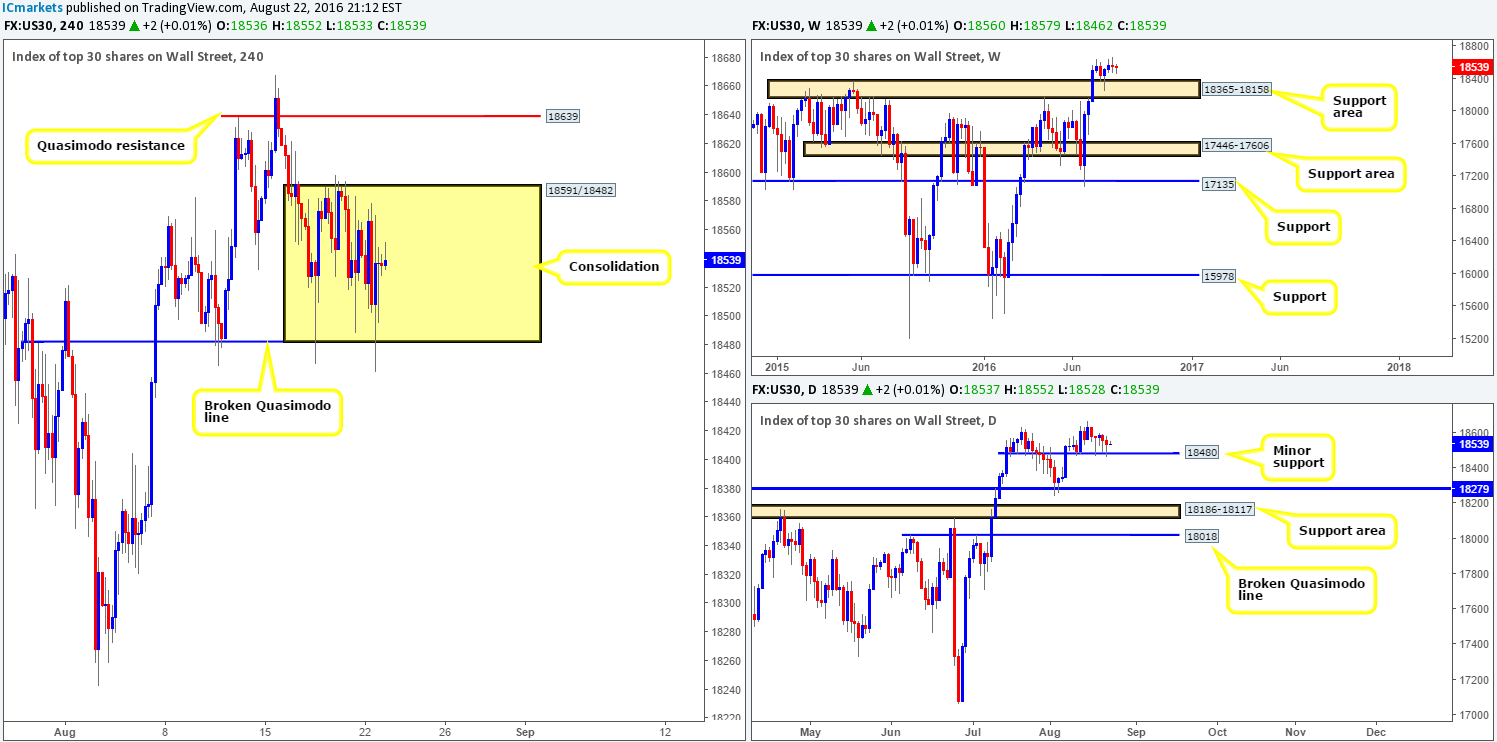
DOW 30:
Current conditions on the H4 chart show that the DOW has begun chalking up a consolidation zone fixed between a broken Quasimodo line at 18482 and a resistance drawn in at 18591. Now, given that the weekly picture recently tagged a new all-time high of 18668, and the daily continues to defend a minor support level coming in at 18480, where does one go from here?
Well, from a technical standpoint, our team remains in favor of further upside. However, before we become buyers in this market, H4 price will need to close above the current H4 range. By doing this, the bulls have likely confirmed willingness to at least push prices up to a H4 Quasimodo resistance level at 18639, with the strong possibility of a further push to fresh all-time highs.
Our suggestions: Wait for the market to close above the current H4 range and then look to trade any retest seen thereafter, targeting the H4 Quasimodo resistance at 18639 as your initial take-profit target. What we mean by ‘trade any retest’ is simply to wait for a H4 bullish close off of the boundary prior to pulling the trigger, with your stop placed a few pips below the trigger candle.
Levels to watch/live orders:
- Buys: Watch for price to close above the 18591 region and then look to trade any retest seen thereafter.
- Sells: Flat (Stop loss: N/A).
GOLD:
Going into the early hours of yesterday morning, price shook hands with a H4 mid-range Quasimodo line at 1332.3. Once London opened their doors for business, however, we saw the market gravitate from this level and close above a minor H4 trendline resistance extended from the low 1329.7. While the yellow metal managed to hold above this line during yesterday’s sessions, this morning’s offered tone has pushed prices lower, which could suggest bullion may retest 1332.3 sometime today.
With weekly action recently printing its second consecutive selling wick just ahead of a weekly Quasimodo resistance level at 1361.7, and daily price looking as though it will continue to dive lower to connect with daily demand at 1305.3-1322.8 (sits on top of the weekly support area at 1307.4-1280.0: the next downside target on the weekly timeframe), we do not have much faith in the current H4 mid-range Quasimodo level.
Our suggestions: Watch for a clean break below the current H4 mid-range Quasimodo line. Followed up with a retest to the underside of this level as well as a lower timeframe confirmed sell signal (see the top of this report), this is an ideal place to short from targeting the H4 demand at 1315.6-1319.6.
Should price reach this H4 demand base, all of our short positions will be liquidated and we’ll then go about looking to possibly enter long at market (dependent on the approach and time of day) from this area. However, do be prepared for price to drive below this zone before buyers step in! The reason as to why is because along with the H4 demand and it’s supporting higher-timeframe demands (see above in bold), we also have a merging H4 harmonic Gartley reversal zone seen between the H4 78.6% Fib support at 1322.8 and the X point of the H4 harmonic pattern at 1310.7.

Levels to watch/live orders:
- Buys: 1315.6-1319.6 [Dependent on the approach and time of day a market long is possible] (Stop loss: below the X point of the H4 harmonic formation: 1309.1, which is, as you can see, set just beyond the H4 support at 1310.3).
- Sells: Watch for price to close below the H4 mid-range Quasimodo level at 1332.3 and then look to trade any retest seen thereafter (lower timeframe confirmation required).


