Waiting for lower timeframe confirmation is our main tool to confirm strength within higher timeframe zones, and has really been the key to our trading success. It takes a little time to understand the subtle nuances, however, as each trade is never the same, but once you master the rhythm so to speak, you will be saved from countless unnecessary losing trades. The following is a list of what we look for:
- A break/retest of supply or demand dependent on which way you’re trading.
- A trendline break/retest.
- Buying/selling tails/wicks – essentially we look for a cluster of very obvious spikes off of lower timeframe support and resistance levels within the higher timeframe zone.
We typically search for lower-timeframe confirmation between the M15 and H1 timeframes, since most of our higher-timeframe areas begin with the H4. Stops are usually placed 1-3 pips beyond confirming structures.
EUR/USD:
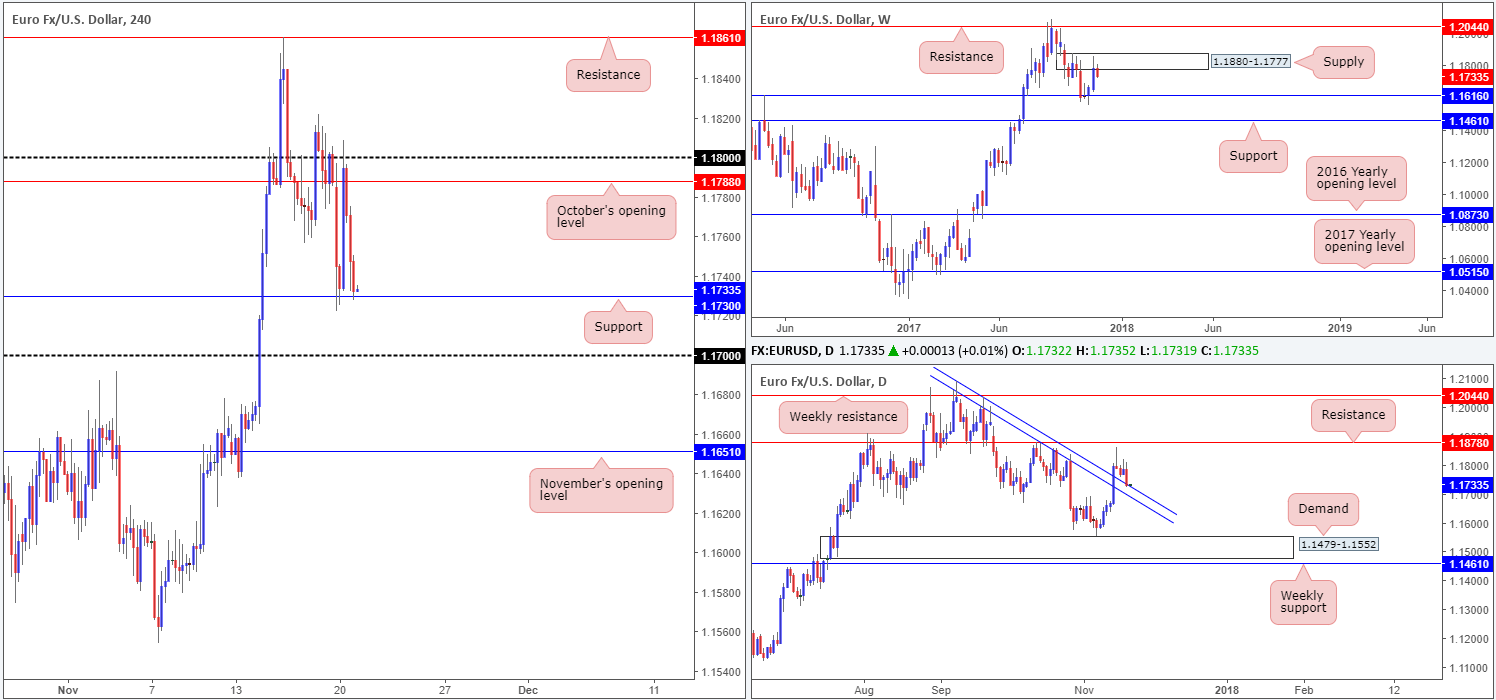
The single currency came under pressure in the early hours of trading on Monday, as German politics were brought into the spotlight. This was probably not helped by the fact that the EUR/USD market is seen trading around the underside of a weekly supply base coming in at 1.1880-1.1777. Despite this, the bulls did not give up without a fight and may still remain in the game. Daily price is seen trading from a trendline support etched from the high 1.2092 and support on the H4 timeframe at 1.1730 has done a fabulous job in holding back the sellers thus far.
Suggestions: Although weekly structure suggests shorting this market may be the better path to take, selling into both H4 support and a daily trendline support is not something we would want to be involved in! Likewise, a long in the market looks great from a H4 and daily perspective, but somewhat risky on the weekly timeframe.
All things considered, the pair, at least in our opinion, is relatively restricted at the moment. For that reason, the team is left with little choice but to remain flat.
Data points to consider: US existing home sales at 3pm; FED Chair Yellen speaks at 11pm GMT.
Levels to watch/live orders:
- Buys: Flat (stop loss: N/A).
- Sells: Flat (stop loss: N/A).
GBP/USD:
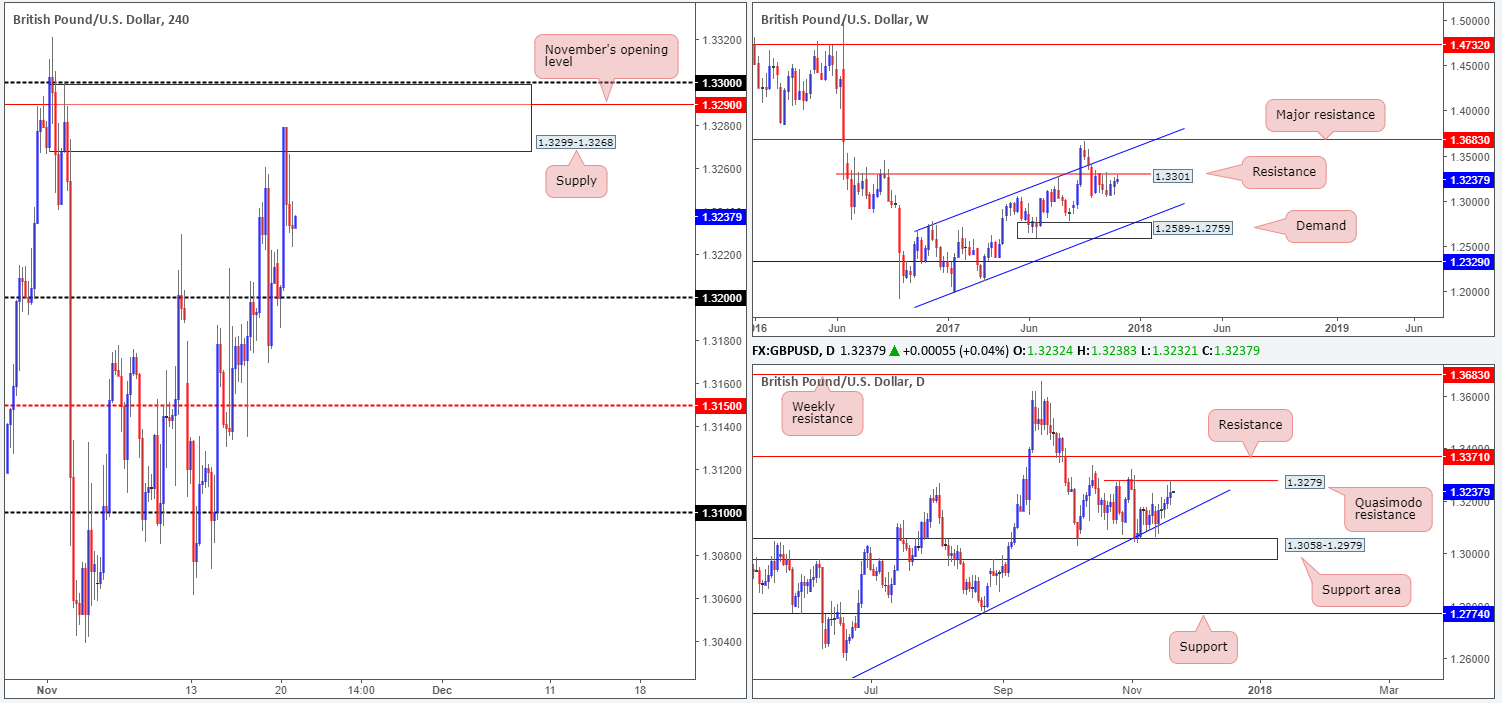
Kicking this morning’s report off with a look at the weekly timeframe, we can clearly see that the pair is nearing the resistance at 1.3301. Since early October, price has been consolidating beneath this barrier. Should a breakout to the upside occur, it seems price would be all set to extend up to a channel resistance taken from the high 1.2673. On the other side of the coin, a move south would likely bring the candles down to a demand seen at 1.2589-1.2759 that fuses with a channel support etched from the low 1.1986. Turning our attention over to the daily candles, price challenged the Quasimodo resistance level at 1.3279 during the course of yesterday’s segment.
In line with the daily timeframe, H4 price tested supply at 1.3299-1.3268 and abruptly sold off to a low of 1.3223. For those who read Monday’s report you may recall that the team highlighted this supply zone as a potential sell zone. Besides housing November’s opening level at 1.3290 and placed nearby the 1.33 band (which essentially represents the aforementioned weekly resistance level), it also encapsulates the noted daily Quasimodo resistance. However, we were, and still are, looking at November’s opening level as an entry point with stops planted above the daily Quasimodo resistance apex (1.3321) at 1.3324.
Suggestions: Although daily sellers have shown interest around 1.3279, the team will hold fire and patiently wait for 1.3290 to come into the picture before selling.
Data points to consider: UK public sector net borrowing at 9.30am; UK inflation report hearings at 10am; US existing home sales at 3pm; FED Chair Yellen speaks at 11pm GMT.
Levels to watch/live orders:
- Buys: Flat (stop loss: N/A).
- Sells: 1.3290 (stop loss: 1.3324).
AUD/USD:
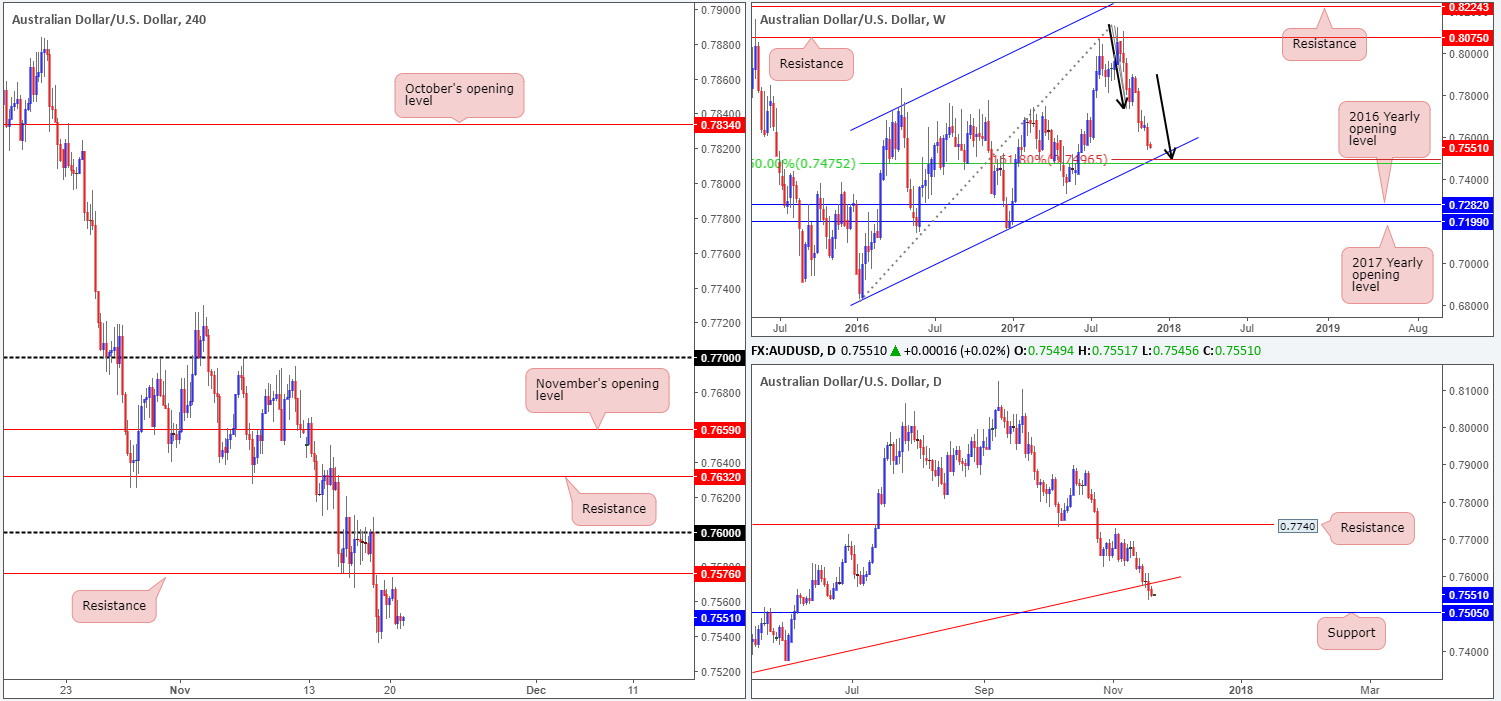
Although the AUD/USD ended Monday’s segment marginally in the red, Monday’s outlook remains relatively unchanged this morning. You may recall that in Monday’s report we underlined particularly interesting weekly structure. Merging with a weekly channel support extended from the low 0.6827, there’s a nice-looking weekly AB=CD (see black arrows) 161.8% Fib ext. point at 0.7496 that also aligns with a 50.0% value at 0.7475 taken from the high 0.8125. In conjunction with weekly price, daily structure shows little active demand to the left of current price, which could suggest a move down to daily support at 0.7505 may be on the cards sometime this week.
Recent movement on the H4 timeframe shows that the candles came within shouting distance of connecting with resistance at 0.7576, before selling off to a session low of 0.7544.
Suggestions: Buying from the 0.75 region on the H4 timeframe is a high-probability setup, in our opinion. Not only is there a weekly channel support intersecting with this line, there’s also a weekly AB=CD 161.8% ext. point at 0.7496 and a daily support at 0.7505. To give the trade room to breathe, we would look to place stops 45-50 pips below 0.75.
Data points to consider: RBA monetary policy meeting minutes at 12.30am; RBA Assist Gov. Bullock speaks at 3.50am; RBA Gov. Lowe speaks at 9.05am; US existing home sales at 3pm; FED Chair Yellen speaks at 11pm GMT.
Levels to watch/live orders:
- Buys: 0.75 (stop loss: 0.7455).
- Sells: Flat (stop loss: N/A).
USD/JPY:
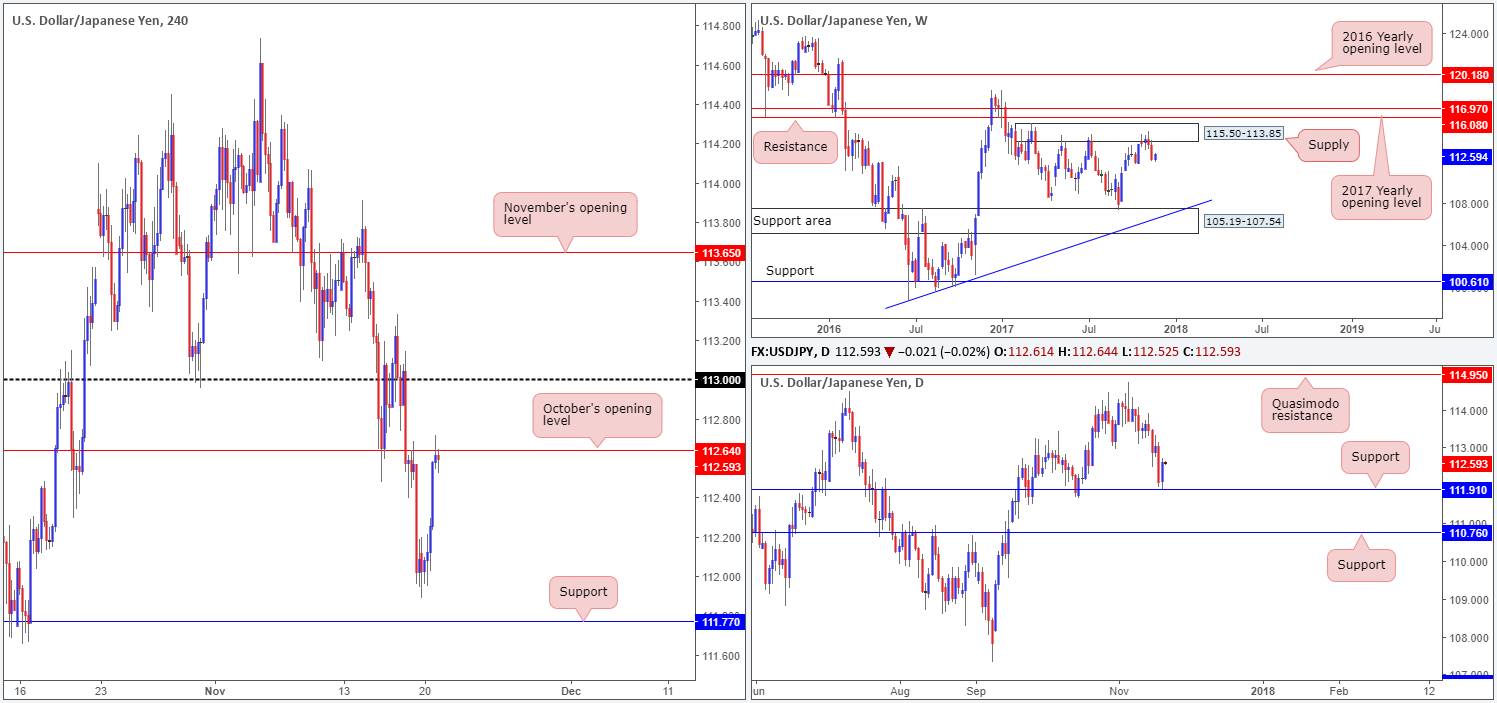
As is evident from the daily timeframe this morning, support at 111.91 held beautifully on Monday and as a result printed a near-full-bodied bullish candle. Despite this likely arousing the interest of buyers in this market, it might be worth noting where price came from: a monstrous weekly supply coming in at 115.50-113.85! In addition to this, October’s opening level seen on the H4 timeframe at 112.64 is also now in the fray.
So, where does one go from here? Well, even if H4 price manages to overcome 112.64, there’s not much wiggle room, given how close the 113 handle is positioned. On top of this, you would also be buying against potential weekly selling. A selloff from 112.64, at least from the H4 scale, shows promise to the downside, seeing as how price could tumble as far south as the H4 support at 111.77. However, this would also place you in direct conflict with daily buyers from the noted support!
Suggestions: Neither a long nor short seems appropriate right now. As a result, our desk will likely remain on the sidelines and look to reassess structure going into Wednesday’s opening bell.
Data points to consider: US existing home sales at 3pm; FED Chair Yellen speaks at 11pm GMT.
Levels to watch/live orders:
- Buys: Flat (stop loss: N/A).
- Sells: Flat (stop loss: N/A).
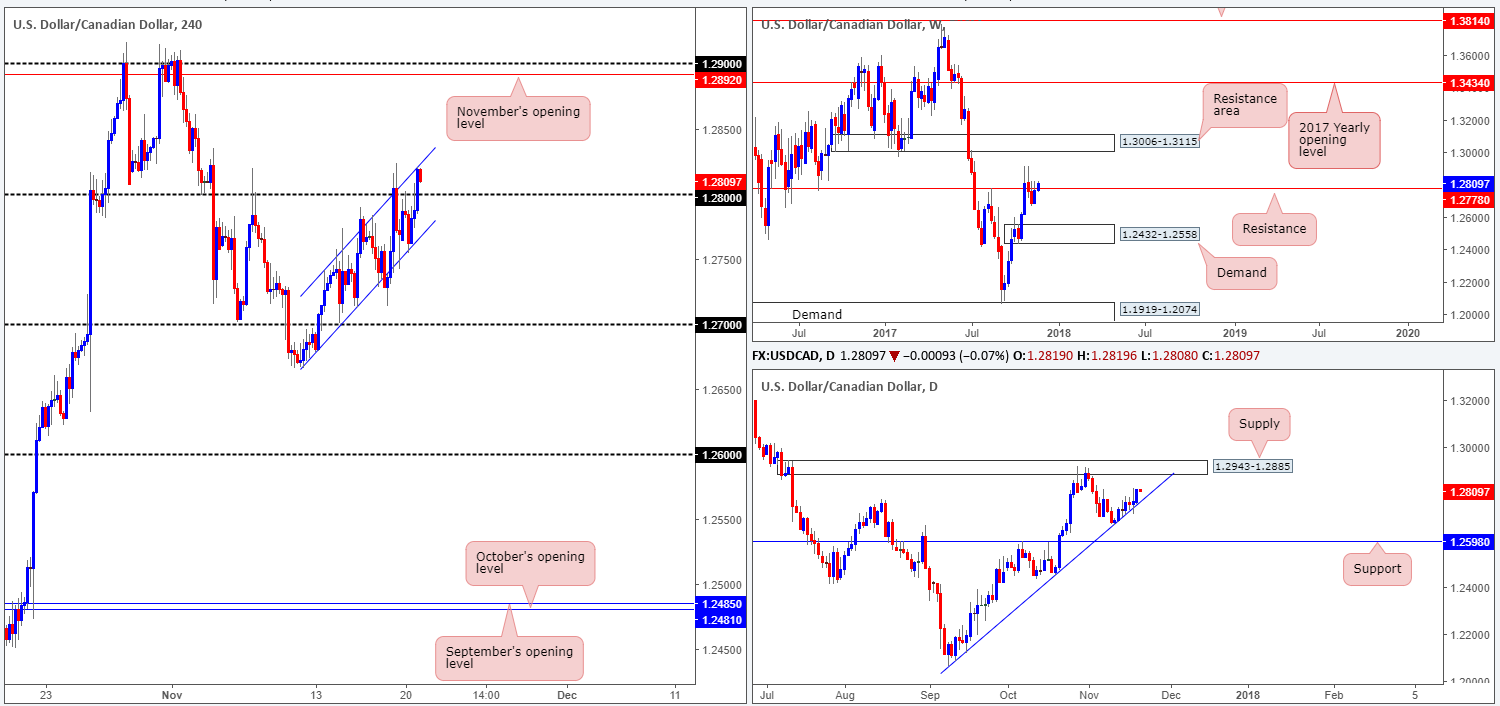
USD/CAD:
Weaker oil prices weighed on the commodity-linked Canadian dollar on Monday, therefore forcing the USD/CAD beyond the 1.28 handle and into the upper H4 channel resistance extended from the high 1.2741. From a technical standpoint, this move was likely bolstered by the fact that daily price is seen trading from a trendline support etched from the low 1.2061. Also notable is that weekly action recently crossed above resistance at 1.2778. Remember though, this level shares a strong history that dates back to early 2004, so although it has been mildly breached it doesn’t mean it is out of the equation just yet!
Suggestions: With daily price showing room to extend as high as supply coming in at 1.2943-1.2885, there is a chance that we may see higher prices. The problem with this is that it is a difficult buy. Not only are you up against potential weekly sellers, you’re also up against H4 sellers from the noted channel resistance. Unfortunately, we’re in the same boat in regard to selling. Besides the nearby 1.28 support, one has to also contend with daily buyers from the aforementioned trendline support.
To that end, we do not see much to hang our hat on this morning. Well, not anything that we would deem a high-probability setup that is.
Data points to consider: US existing home sales at 3pm; FED Chair Yellen speaks at 11pm; Canadian wholesale sales m/m at 1.30pm GMT.
Levels to watch/live orders:
- Buys: Flat (stop loss: N/A).
- Sells: Flat (stop loss: N/A).
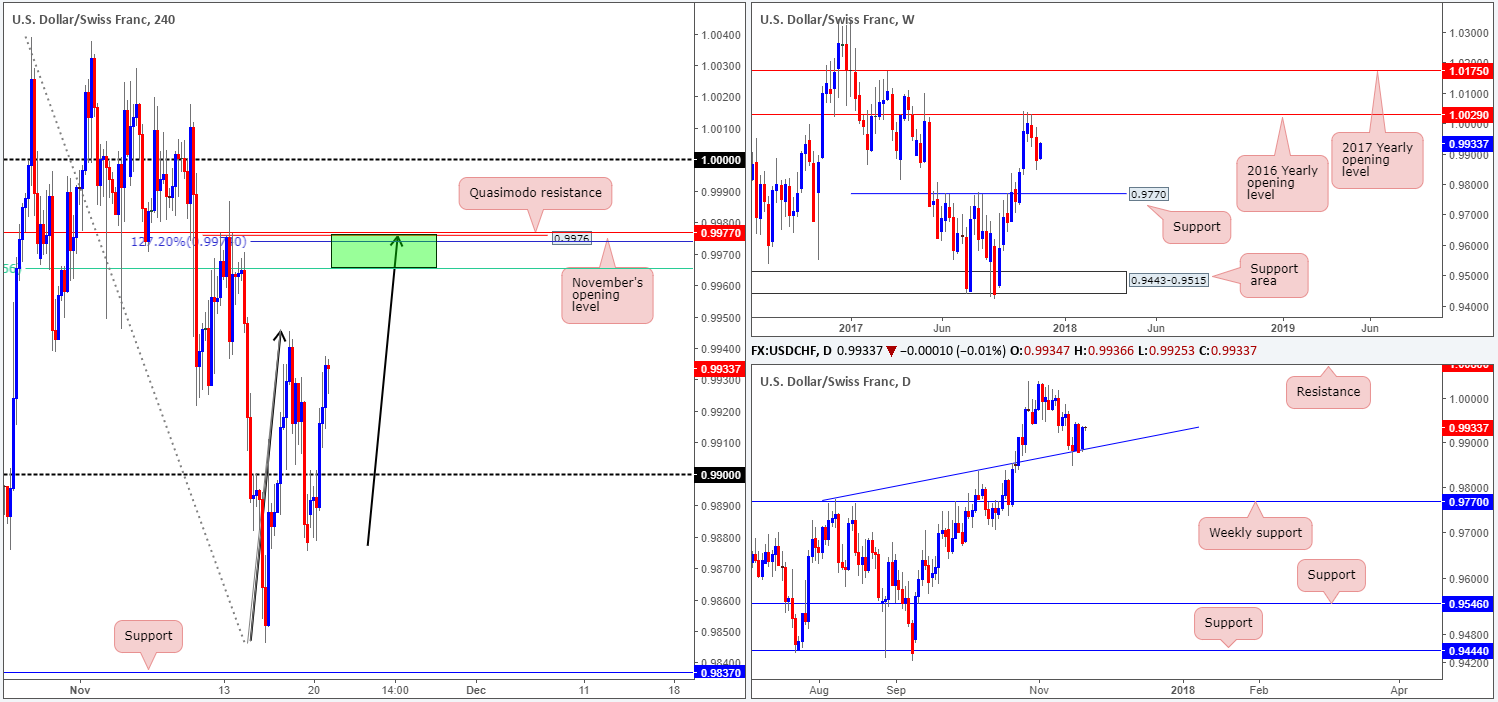
USD/CHF:
Despite a lack of fundamental drivers, a strong session for the USD/CHF was seen on Monday, consequently reversing 90% of Friday’s losses. The move, likely due to being bolstered by a daily trendline support taken from the high 0.9773, outmuscled bears around the 0.99 handle and drove to a session high of 0.9937. Due to the 16/11 high seen on the H4 timeframe at 0.9945, we may see some selling materialize at current price today. Be that as it may, our attention will mostly be driven towards the H4 Quasimodo resistance level at 0.9976. The reason is because of its surrounding confluence. November’s opening level at 0.9977, a potential 127.2% AB=CD (see black arrows) approach, a 61.8% Fib resistance (green line) at 0.9965 and also being positioned within daily supply at 0.9986-0.9956 is, in our opinion, a strong base.
Suggestions: While we believe that 0.9977/0.9965 is a valid sell zone, there is one cautionary point to consider: a potential fakeout up to parity (1.0000). Psychological levels, especially ones as large as these, attract attention! For this reason, we would only consider a test of the noted H4 sell zone valid if, and only if, a H4 full or near-full-bodied bearish candle took shape. This, we believe, would help avoid an unnecessary loss should 1.0000 be the next upside target.
Data points to consider: US existing home sales at 3pm; FED Chair Yellen speaks at 11pm GMT.
Levels to watch/live orders:
- Buys: Flat (stop loss: N/A).
- Sells: 0.9977/0.9965 ([waiting for a reasonably sized H4 bearish candle to form – preferably a full or near-full-bodied candle – is advised] stop loss: ideally beyond the candle’s wick).
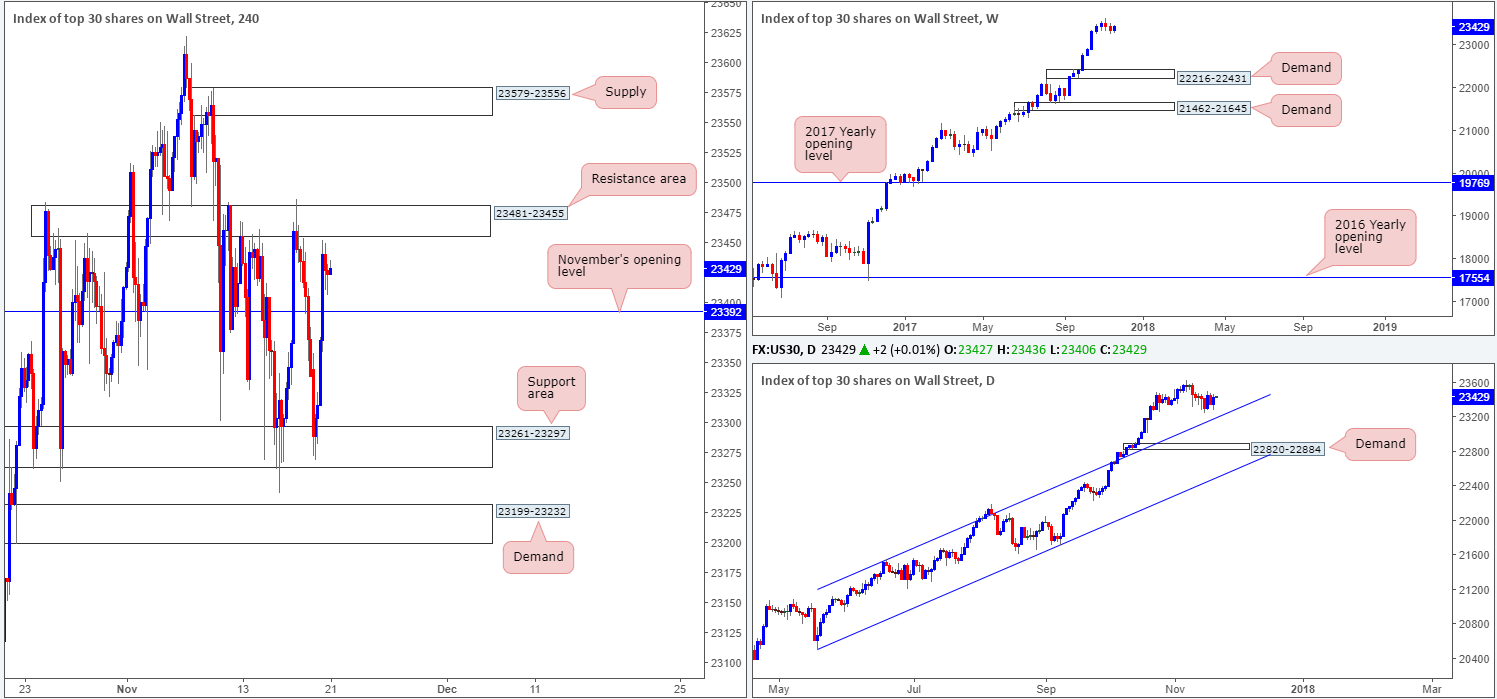
DOW 30:
Since the 10th November, US equities have been chiseling out a consolidation zone fixed between a H4 resistance area noted at 23481-23455 and a H4 support area coming in at 23261-23297. As you can see, in between this zone we also have November’s opening line at 23392.
A breakout to the upside would likely place the H4 supply at 23579-23556 in the spotlight, whereas a breakout to the downside would, almost immediately, land the H4 candles within striking distance of a H4 support area at 23199-23232. One thing to keep in mind here is that this H4 support zone intersects beautifully with a daily trendline support (prior channel resistance) etched from the high 21541.
Suggestions: In view of how close H4 price is trading to the upper edge of its current range right now, and given the strength of the underlying trend, we would be interested buyers above 23481-23455. However, we would insist on seeing a retest of this area as support and a follow-through H4 bullish candle (full or near-full-bodied candle), before pulling the trigger. This, in our book of technical setups, would be sufficient enough to warrant a long in this market, targeting the aforementioned H4 supply as an initial take-profit zone.
Data points to consider: US existing home sales at 3pm; FED Chair Yellen speaks at 11pm GMT.
Levels to watch/live orders:
- Buys: Watch for H4 price to engulf 23481-23455 and then look to trade any retest seen thereafter ([waiting for a reasonably sized H4 bullish candle to form following the retest – preferably a full or near-full-bodied candle – is advised] stop loss: ideally beyond the candle’s tail).
- Sells: Flat (stop loss: N/A).
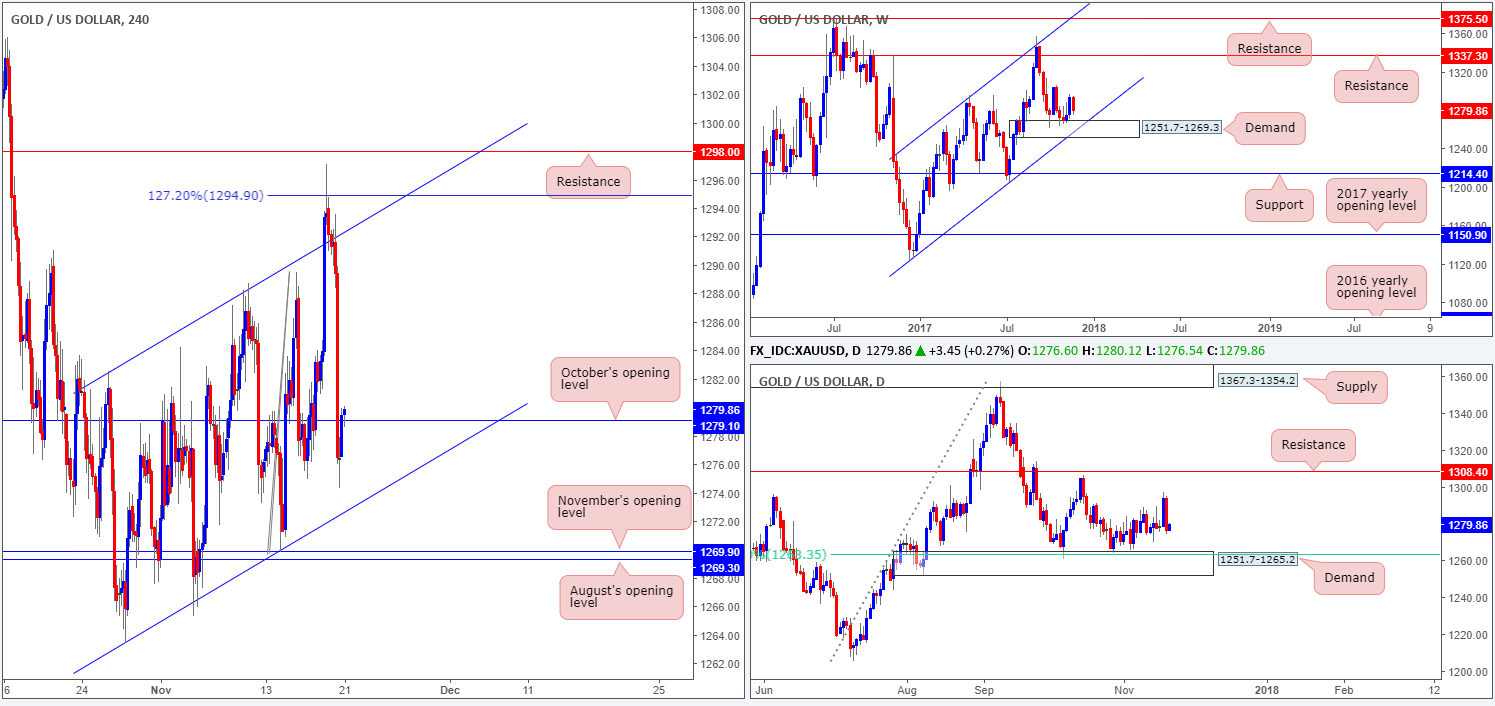
GOLD:
After crossing swords with the H4 AB=CD 127.2% ext. at 1294.9 in the later hours of Friday’s segment, this encouraged a strong selloff during Monday’s sessions. Bolstered by a nearby H4 resistance at 1298.0 and the fact that the dollar was heavily bid, the yellow metal manage to dig its way back into the H4 ascending H4 channel (1263.4/1282.5). It was only after an aggressive break of October’s opening level also seen on the H4 timeframe at 1279.1 did we see gold mildly pare losses.
Suggestions: As we write, the H4 candles are treading water around the top edge of October’s open line. Whether this is enough to hold the fort and push bids higher is difficult to judge. The reason we say this is simply because higher-timeframe traders may want to bring the unit down as far as weekly demand coming in at 1251.7-1269.3, which happens to merge nicely with a weekly channel support taken from the low 1122.1.
While a long from 1279.1 may very well work out, we are wary given the lack of higher-timeframe support and H4 confluence. To that end, the team will remain on the bench today and reassess going into tomorrow’s open
Levels to watch/live orders:
- Buys: Flat (stop loss: N/A).
- Sells: Flat (stop loss: N/A).