Lower timeframe confirmation: is something we use a lot in our analysis. All it simply means is waiting for price action on the lower timeframes to confirm direction within a higher timeframe area. For example, some traders will not enter a trade until an opposing supply or demand area has been consumed, while on the other hand, another group of traders may only need a trendline break to confirm direction. As you can probably imagine, the list is endless. We, however, personally prefer to use the two methods of confirmation mentioned above in our trading.
EURUSD:
During the course of yesterday’s sessions, we can see that the buyers attempted to trade higher from within the 4hr Harmonic AB=CD potential reversal zone (PRZ) at 1.0847-1.0800, but failed once they reached a minor 4hr swap level coming in at 1.0854. This, as we can all see, sent the EUR further south taking out Friday’s low 1.0826 and piercing the following structures within the aforementioned AB=CD PRZ:
- 4hr trendline taken from the low 1.0461.
- Fibonacci extension 1.272%.
- The daily swap level 1.0820 – inverted daily pin bar printed at this level amid yesterday’s trade.
Although things look rather bleak around this 4hr Harmonic support area at present, we’re still confident that price may bounce higher from here, since let’s not forget that this zone is not only supported by the above said structures, it is also hovering just above a weekly demand area at 1.0519-1.0798. Therefore, as we explained in our previous report, there is a possibility that price may fake below the round number 1.0800 (top-side of weekly demand) before we see any appreciation in value. With that, we stand by our original game plan – WAIT for the lower timeframes (15 min/60 min) to confirm buying strength exists within this highly confluent 4hr Harmonic structure before risking capital on a trade.

Levels to watch/live orders:
- Buys: 1.0847/1.0800 [Tentative – confirmation required] (Stop loss: 1.0785).
- Sells: Flat (Stop loss: N/A).
GBP/USD:
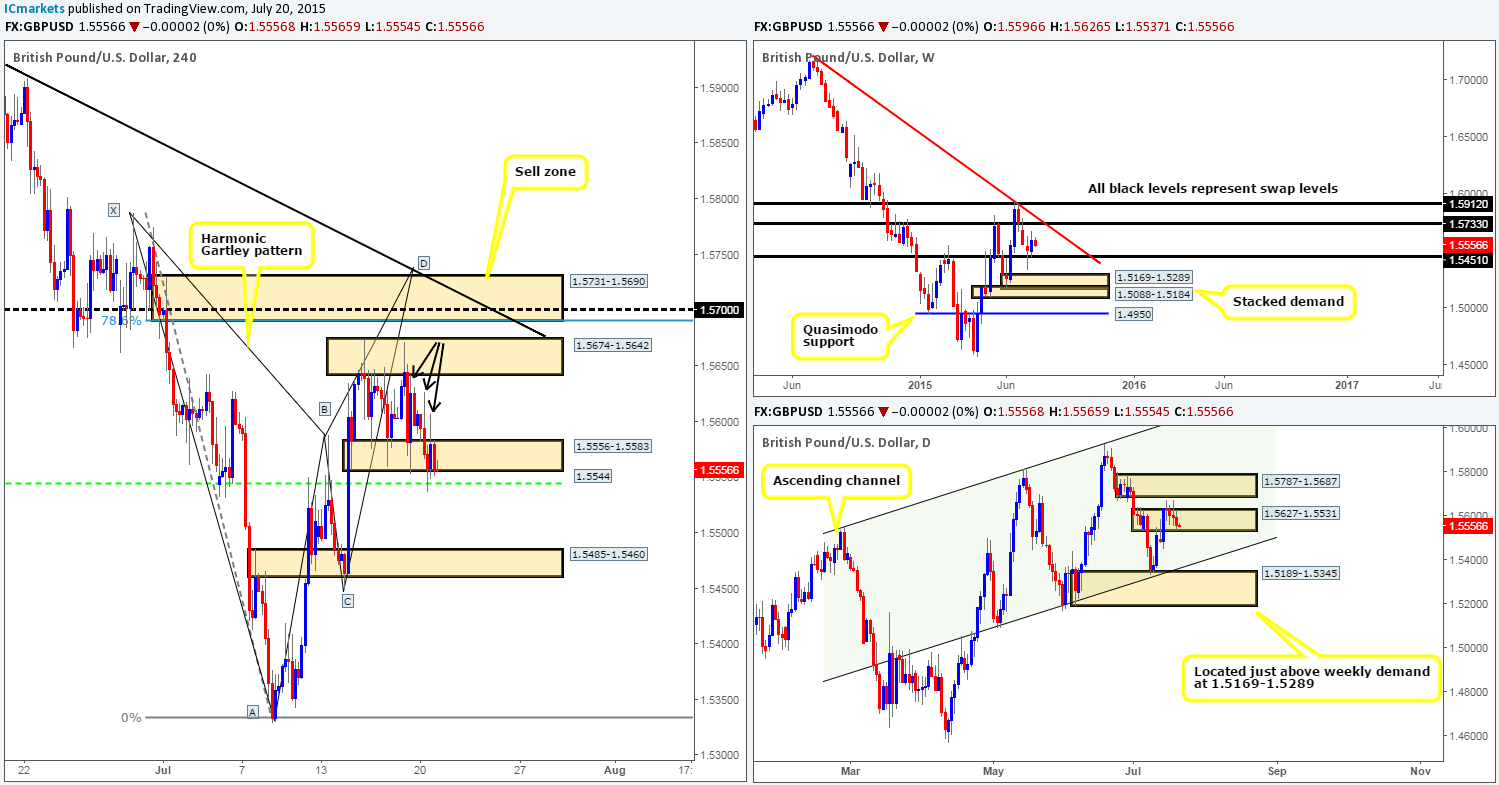
Following the open 1.5596, Cable sold off amid yesterday’s trade, resulting in price faking below the lower limit of the current 4hr range 1.5556-1.5583 (upper limit comes in at 1.5674-1.5642) and connecting up with a 4hr swap level sitting at 1.5544, which, as you can see, held firm going into yesterday’s close 1.5556. The three black arrows above current price marking the following wicks: 1.5606/1.5626/1.5641 is where we believe supply has been consumed, and as such the path north cleared for buying.
Moving up to the bigger picture, the weekly timeframe shows price hovering between two weekly swap levels – 1.5451/1.5733 at the moment. Meanwhile, on the daily timeframe, buyers and sellers are currently slugging it out within a daily supply (now represents demand in our opinion) area at 1.5627-1.5531.
Given the points made above, here is our two pips’ worth on today’s likely movement… Assuming that the 4hr swap level 1.5544 holds firm going into today’s sessions, we are quite confident the GBP will rally higher. With that, taking a long from this region is certainly viable in our book as long as lower timeframe confirmed buying strength is also seen. In the event that we manage to spot a long from here, we’ll be looking to liquidate our full position at the upper limit of the 4hr range (levels above). It would be at this point on that we’d be looking for price to fakeout above this 4hr consolidation and shake hands with the 4hr supply area sitting just above it at 1.5731-1.5690 to sell at 1.5686, since it converges beautifully with the following structures:
- Bearish Harmonic Gartley pattern which completes just above this 4hr supply area at 1.5739.
- The weekly swap level at 1.5733 is seen two pips above this area of 4hr supply.
- Positioned nicely within daily supply coming in at 1.5787-1.5687.
- Round number resistance seen at 1.5700.
- 4hr downtrend line from the high 1.5928.
Levels to watch/ live orders:
- Buys: Flat (Stop loss: N/A).
- Sells: 1.5686 (Stop loss: 1.5778).
AUD/USD:
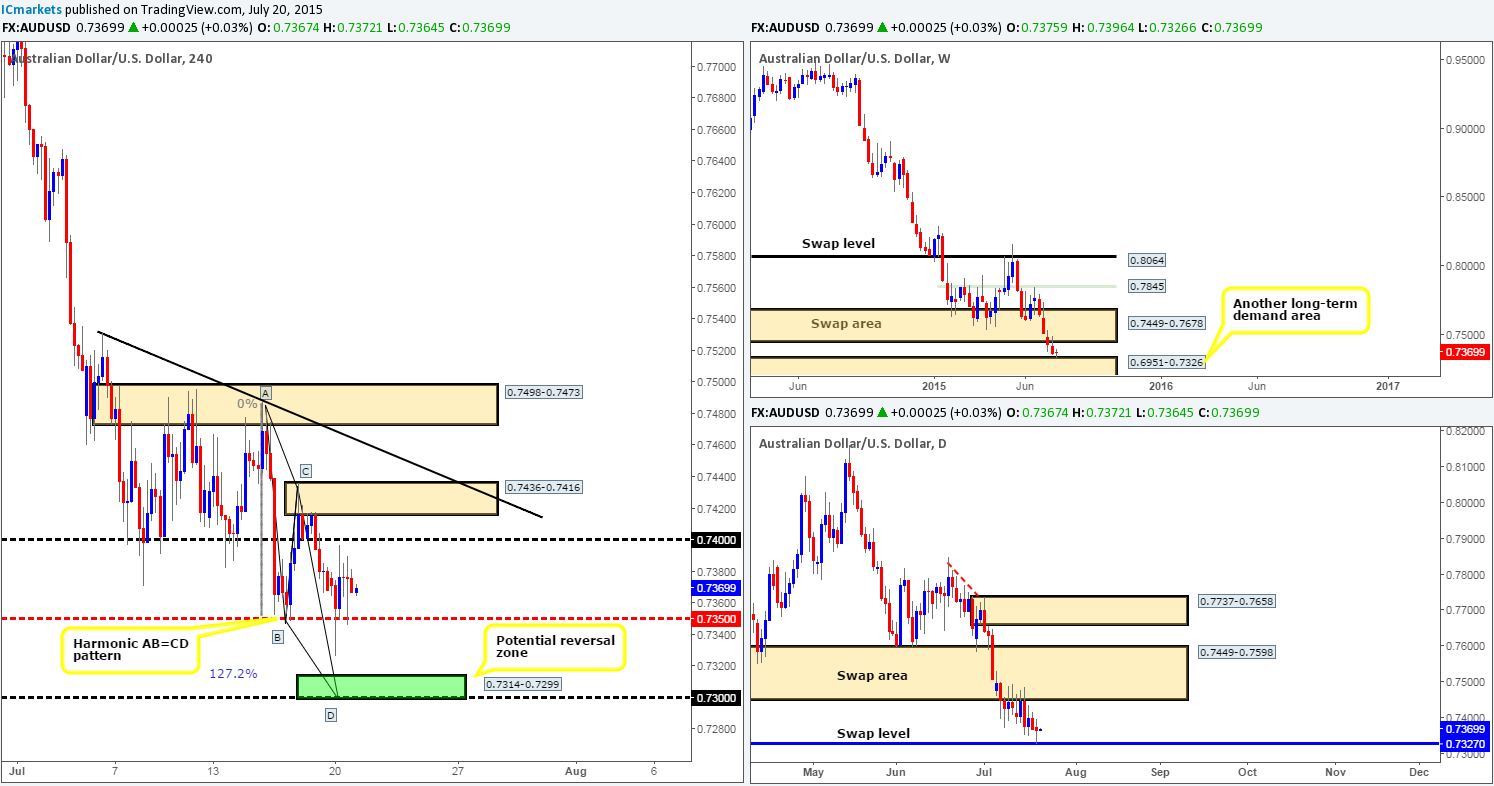
Not too long after the open, this market took a dive and plugged itself into the mid-level hurdle 0.7350, which held firm and pushed prices north to retest the lower limits of the 0.7400 handle. From here, this market once again took a dive and connected with 0.7350, only this time the bid side of the market did not seem as strong. Could we be in for a further push lower today? Let’s see what the higher timeframes have to say…
Looking across to our higher timeframe charts, we can see that agreement is being seen across the board. The weekly timeframe shows price recently kissed the top-side of a long-term weekly demand at 0.6951-0.7326, while on the daily timeframe; price rebounded off of a long-term daily swap level coming in at 0.7326. We know this is effectively the upper boundary of the above said weekly demand area, but what makes this level such a high-probability turning point is the way price used this barrier to propel this market north back on the 06/05/2009 –something one cannot see on the weekly timeframe.
Although we are confident that we have higher timeframe support in the market right now, buying this market is still out of the question for us on the 4hr timeframe as there is potential near-term resistance sitting at 0.7400/4hr supply area at 0.7436-0.7416. Therefore, what we’re looking for today is to see price break below 0.7350 and connect up with a bullish Harmonic AB=CD pattern which completes (green area 0.7314-0.7299) around the round number support at 0.7300. However, due to the strong downtrend the Aussie is in at the moment, we would only consider buying this market here should we see lower timeframe (15/60 min) confirmed buying strength.
Levels to watch/ live orders:
- Buys: 0.7314-0.7299 [Tentative – confirmation required] (Stop loss: dependent on where one confirms this zone).
- Sells: Flat (Stop loss: N/A).
USD/JPY:
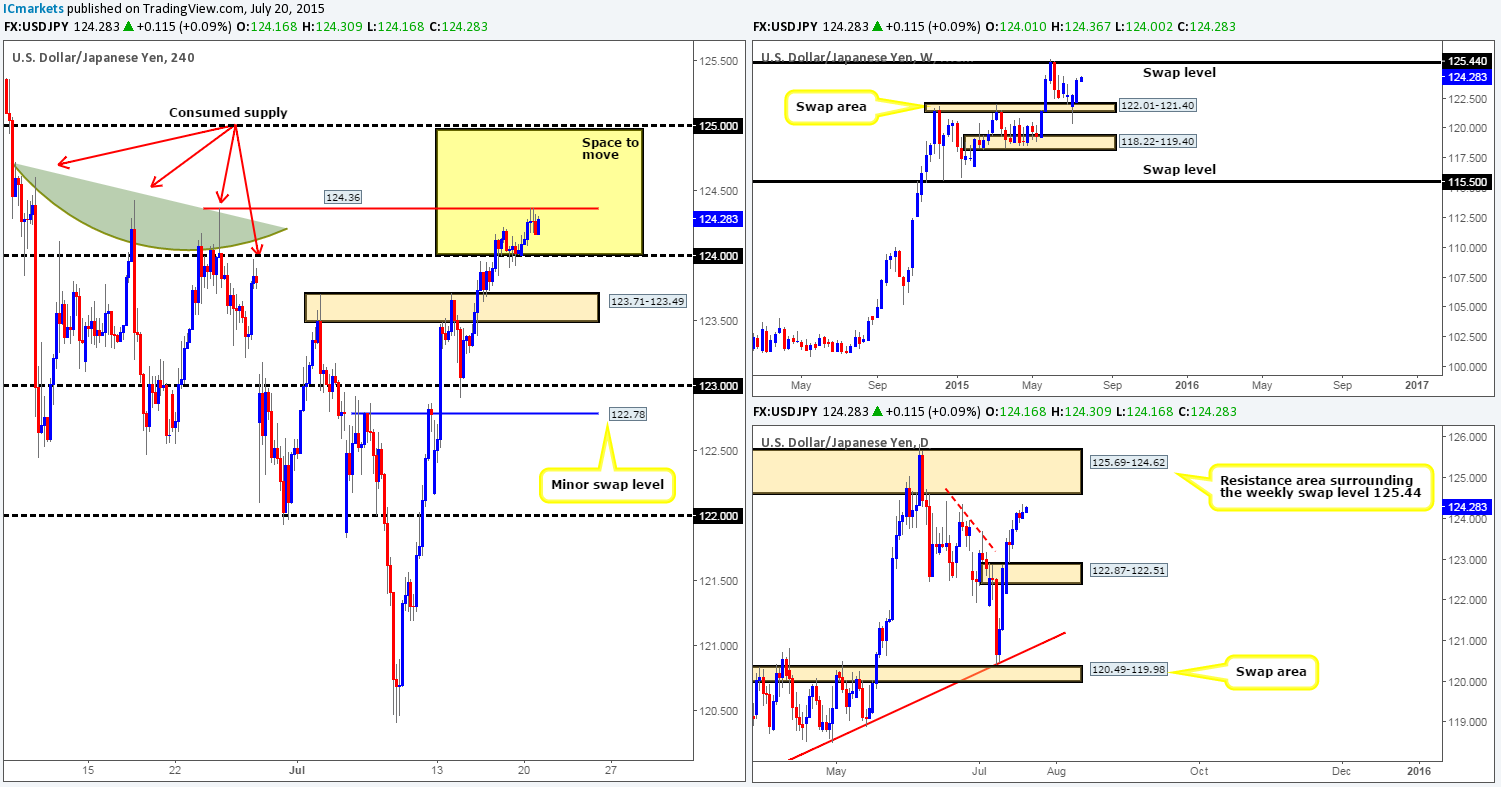
Following the successful retest of the 124.00 handle, a conservative wave of bids came into the market during the course of yesterday’s sessions, which pushed price up to test the June 24th high 124.36. For those who have been following our reports on this pair for some time, you will likely recall that we are confident that this market is headed for 125.00, and as such, we see 124.36 as a temporary glitch. For the benefit of readers who have just begun following our analysis, we’ll quickly explain why we believe this market is still headed north in bullet-point form:
- Strong buying seen from the weekly swap area at 122.01-121.40 with room to move north up to the weekly swap level coming in at 125.44.
- Room on the daily timeframe for price to appreciate further up to a daily resistance zone seen at 125.69-124.62 (surrounds the aforementioned weekly swap level).
- The 4hr timeframe shows very little active supply above current price in our opinion. Check out the supply consumption wicks seen marked with red arrows at: 123.97/124.36/124.43/124.61.
Unfortunately, we did not see any opportunity to buy from 124.00, so unless we get a second retest of 124.00, we may have missed the boat so to speak from here. Not all is lost though. Should price violate 124.36 today, this would potentially give us a second opportunity to enter long if price retests 124.36 as support (lower timeframe confirmation required). Our ultimate target for longs taken from either 124.00 or 124.36 will be 124.95.
Levels to watch/ live orders:
- Buys: 124.00 [Tentative – confirmation required] (Stop loss: depending on where one confirms this level).
- Sells: Flat (Stop loss: N/A).
USD/CAD:
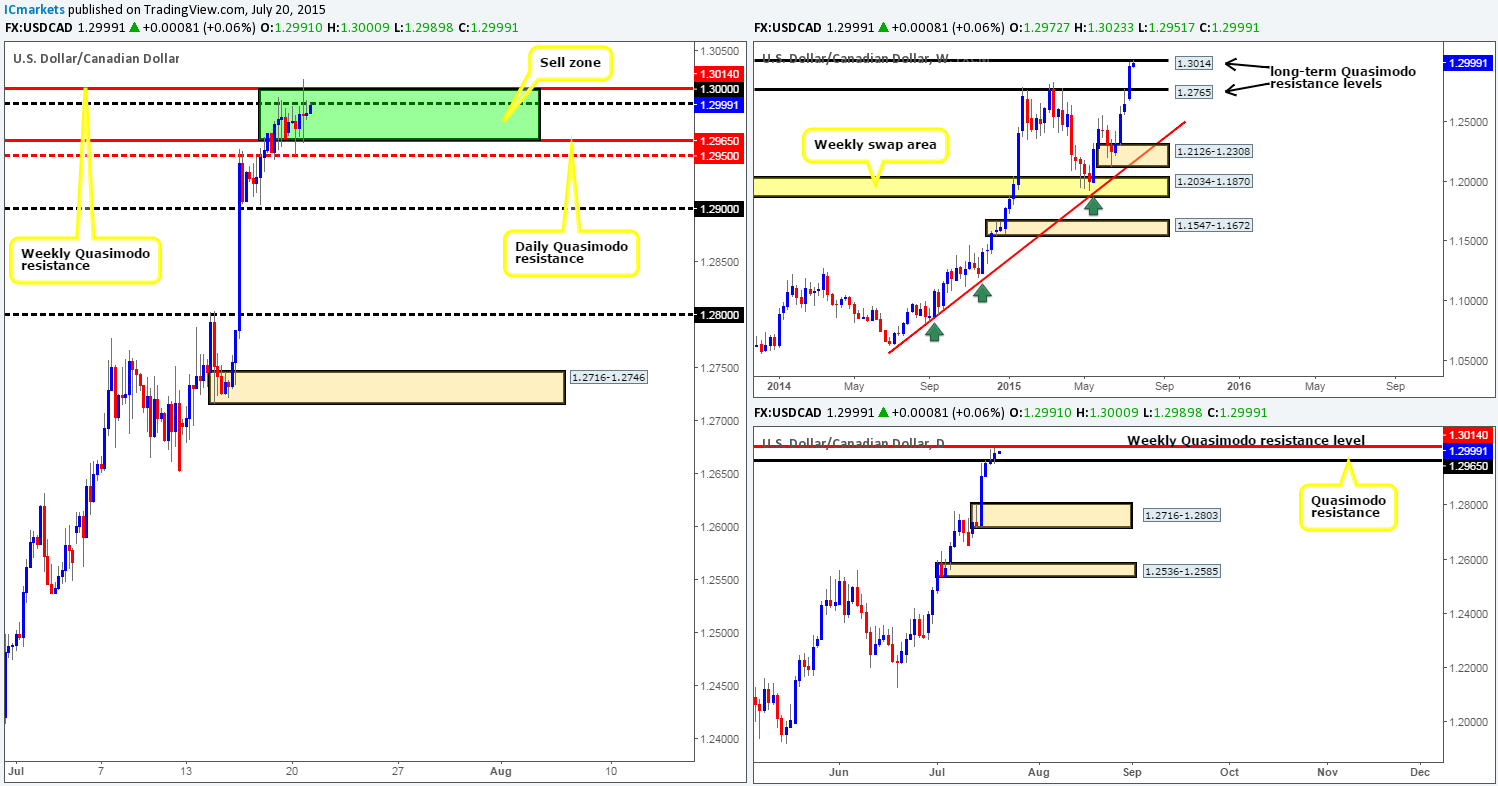
Using the top-down approach this morning, we can see that price has now officially touched gloves with the long-term weekly Quasimodo resistance level coming in at 1.3014. Lower down on the daily timeframe, however, price completely ignored Friday’s bearish pin-bar candle, and closed above a daily Quasimodo resistance level at 1.2965.
With regards to the 4hr timeframe, bids came in strong from 1.2950 during yesterday’s sessions, which eventually forced price to spike above our 4hr sell zone composed of the two higher timeframe Quasimodo resistance levels forming a 4hr indecision candle in the process. This – coupled with the fact that the USD/CAD is in one monstrous uptrend at the moment, and 4hr support at 1.2950 is holding strong, it is not looking too good for the sellers within this area at present.
Taking all of the above into account, our team has come to a general consensus that it would be in our own best interest to wait for 1.2950 to be taken out before committing capital to shorts from this area. In the event that 1.2950 is erased today, and we manage to find a suitable entry short on a retracement, our ultimate take-profit target comes in at the round number 1.2800, which if you look across to the daily chart, you’ll see it lines up beautifully with a daily demand area seen at 1.2716-1.2803. However, 1.2900 will, dependent on how price reacts at this barrier, likely be our first take-profit target.
Levels to watch/ live orders:
- Buys: Flat (Stop loss: N/A).
- Sells: 1.3014/1.2965 [Wait for 1.2950 to be consumed before taking a trade short] (Stop loss: dependent on where one finds confirmation).
USD/CHF:
Recent events in the bigger picture show that there is plenty of room on the weekly timeframe for the USD to continue advancing until price reaches the 0.9796 weekly swap level. Moving down to the daily timeframe, however, we can see that following Friday’s close above daily supply at 0.9597-0.9502, price retested this beauty as demand and rallied higher yesterday into the close 0.9644, which, like the weekly timeframe, also shows room to move north until price reached the daily Quasimodo resistance level at 0.9755.
In more detail, 4hr timeframe action reveals that after price shook hands with the 0.9600 handle yesterday, the USD/CHF extended north reaching highs of 0.9647. For those who read our previous report on this currency pair, you may recall us mentioning that we were interested in buying from the 0.9600 region, due to the room being seen above current price on both the 4hr timeframe and the higher timeframes. Unfortunately though, we did not manage to find an entry long at 0.9600 before price took off.
With all of the above taken into consideration, our outlook for this pair today is as follows… Price will likely stab north to trigger in offers at the mid-level hurdle 0.9650, which could send prices back down to 0.9600 support. Should this happen and 0.9600 holds firm, we’d most certainly be interested in buying here, since with 0.9650 out of the picture (consumed offers), the runway so to speak should then be clear up to the combined 4hr supply/round number area at 0.9717-0.9687/0.9700.
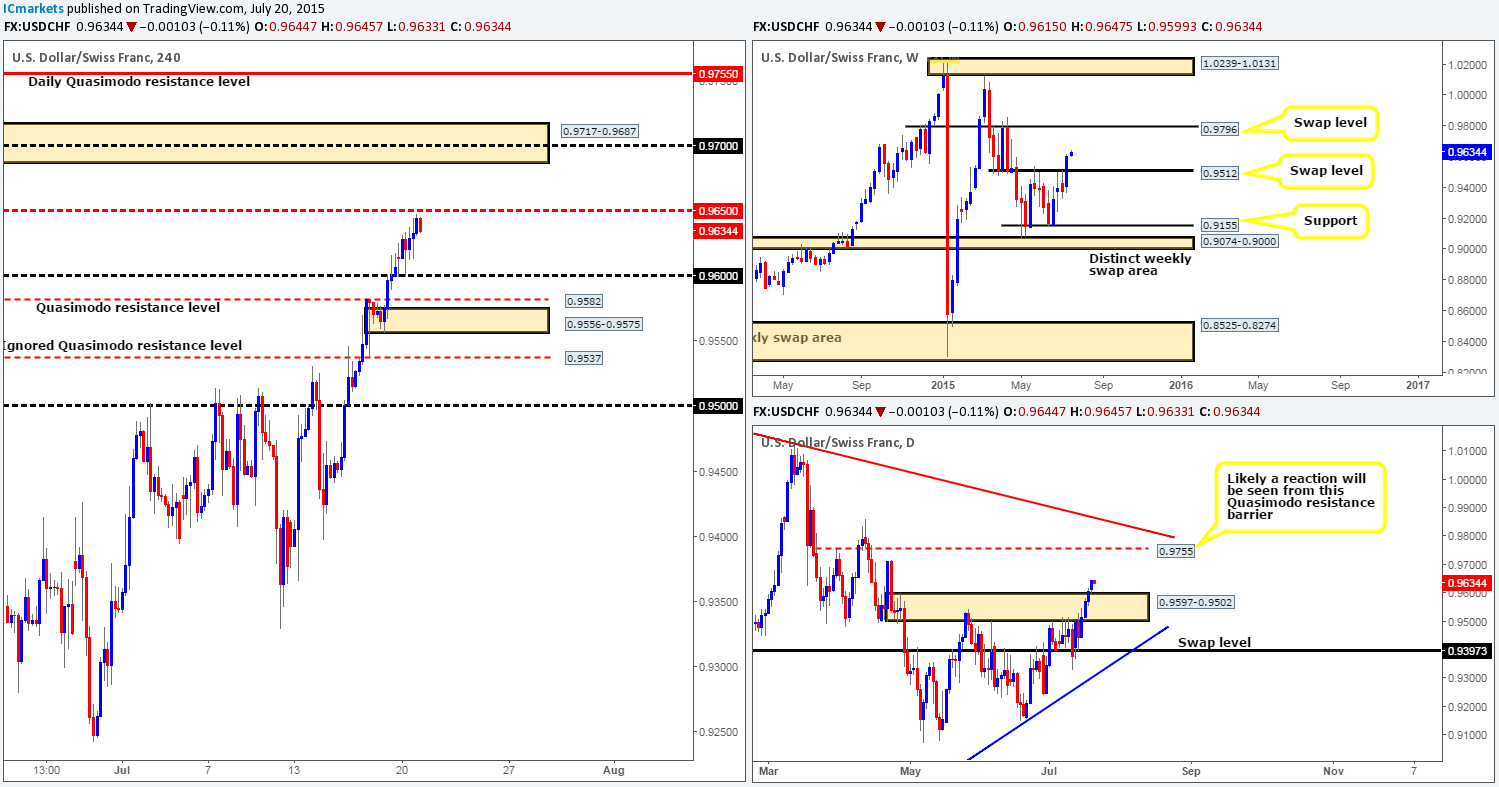
Levels to watch/ live orders:
- Buys: 0.9600 [Tentative – confirmation required] (Stop loss: dependent on where one confirms this level).
- Sells: Flat (Stop loss: N/A).
DOW 30:
The open 18078 saw price extend higher during yesterday’s London session. It was only once price connected with offers at 18136 into the U.S afternoon session, did the market sharply sell off back down to 4hr support at 18047. With this being seen, the DOW appears to be chiseling out the beginnings of a 4hr consolidation zone between the aforementioned 4hr levels.
The weekly timeframe shows price is still lingering within a weekly range at 18279/17547, albeit closer to the top than the bottom mind you! Daily timeframe action on the other hand, reveals that price printed a bearish pin-bar candle during yesterday’s trade off the back of a daily supply area seen at 18186-18103.
Although the daily timeframe looks prime to sell off at the moment, shorting on the basis of the daily pin-bar candle at supply is not something our team would feel comfortable doing, since let’s not forget that price is now nibbling at 4hr support at 18047, and we still consider the weekly timeframe to be mid-range in our book. Therefore, in the absence of clearer price action, our team has decided to remain flat going into to today’s sessions.
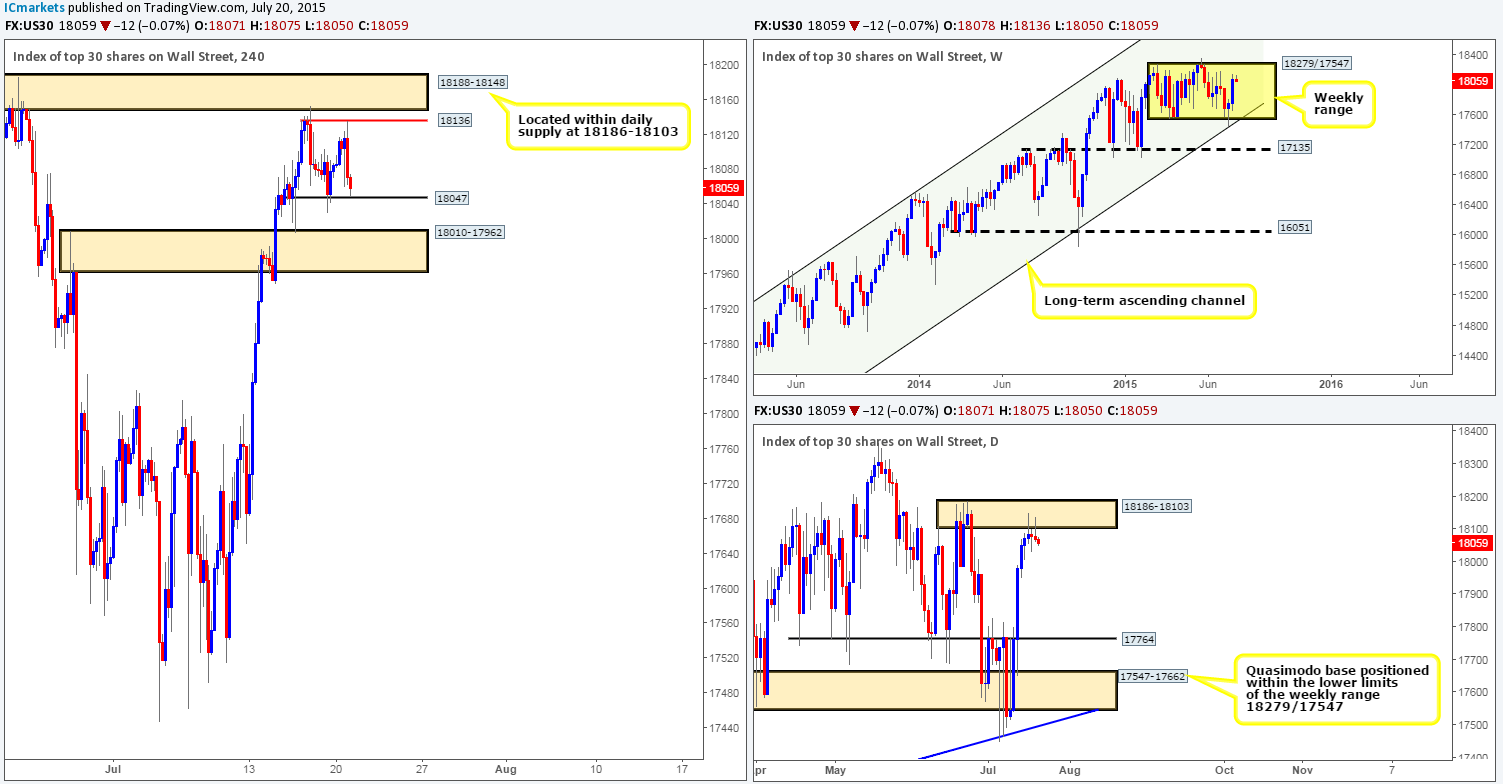
Levels to watch/ live orders:
- Buys: Flat (Stop loss: N/A).
- Sells: Flat (Stop loss: N/A).
XAU/USD: (Gold)
The Gold market took a right beating during yesterday’s trade. Factors affecting this drop likely stem from the rise in the USD and the prospect of the Federal Reserve Bank raising interest rates later this year – the first time in nearly ten years!
This, as you can see, caused price to obliterate the weekly swap level 1130.1 and cross swords with a long-term weekly Quasimodo support level coming in at 1074.6, which was defended going into the daily close 1096.4.
From a technical standpoint, we have two areas of interest on our watch list for today. The first comes in at a 4hr supply area at 1134.5-1128.9 (located around the aforementioned weekly swap level). Should this area be hit today, we’d begin watching how the lower timeframes react. If lower timeframe resistance holds strong, we’d likely consider taking a short position in this market. The second level can be seen at the recent weekly Quasimodo support barrier mentioned above at 1074.6. The initial rebound from this level was aggressive, and only pro money can cause this type of reaction, hence unfilled buy orders may still be lurking here. Therefore, if price re-visits this hurdle later on today, we’d look to take a long position in this market if the lower timeframe price action was agreeable.
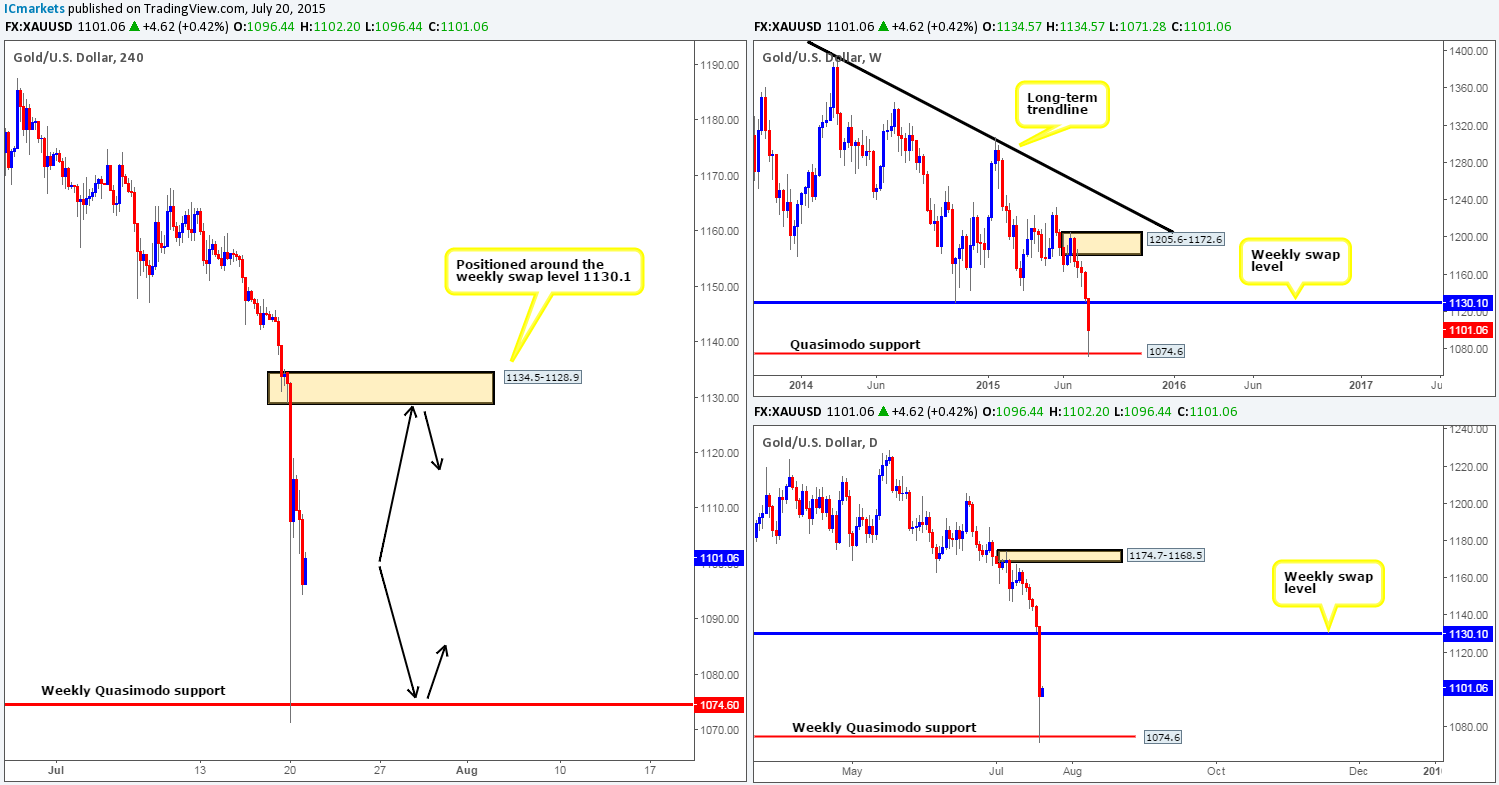
Levels to watch/ live orders:
- Buys: 1074.6 [Tentative – confirmation required] (Stop loss: dependent on where one confirms this level).
- Sells: 1134.5-1128.9 [Tentative – confirmation required] (Stop loss: 1135.5).


