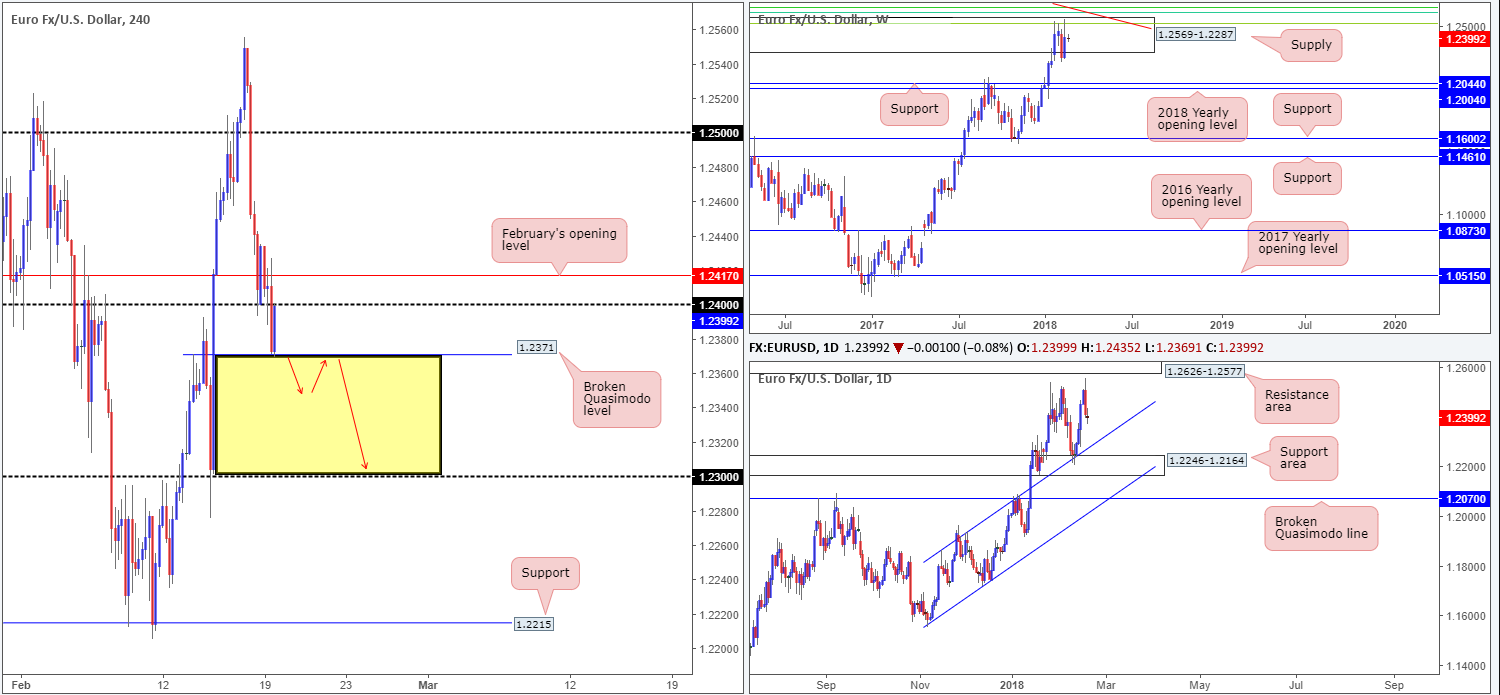
EUR/USD:
Despite attempts to bid price higher from the 1.24 handle seen on the H4 timeframe, the euro failed to sustain gains above February’s opening level based at 1.2417. This saw price action recently connect with a H4 broken Quasimodo line coming in at 1.2371, which, as you can see, has held firm and rotated price back up to the underside of 1.24.
Longer term, however, weekly price remains capped within a weekly supply base coming in at 1.2569-1.2287. Circling around the top edge of this area, traders may have also noticed a nice-looking Fibonacci resistance cluster (see below) and a long-term weekly trendline resistance taken from the high 1.6038.
- 61.8% Fib resistance at 1.2604 taken from the high 1.3993.
- 50.0% Fib resistance at 1.2644 taken from the high 1.4940.
- 38.2% Fib resistance at 1.2519 taken from the high 1.6038.
A little lower on the curve, we can see that daily action shows room to the downside at least until we reach the daily channel resistance-turned support extended from the high 1.1861, followed closely by a daily support area seen at 1.2246-1.2164.
Potential trading zones:
Overall, the team still believes lower prices could be the order of the week.
However, shorting at current prices is not something we’d label high probability! It would only be after a H4 break below the current H4 broken Quasimodo line would there be a clear void (yellow area on the H4 chart) for the H4 candlesticks to stretch as low as the 1.23 handle.
With that being the case, waiting for a H4 close below 1.2371 that’s followed up with a retest (and preferably a full or near-full-bodied H4 bearish candle) is likely the best path to take should you be looking to sell this market.
Data points to consider: German ZEW economic sentiment at 10am GMT.
Areas worthy of attention:
Supports: 1.23 handle; 1.2371; daily channel support; 1.2246-1.2164.
Resistances: 1.2569-1.2287; weekly Fib resistance cluster; weekly trendline resistance.
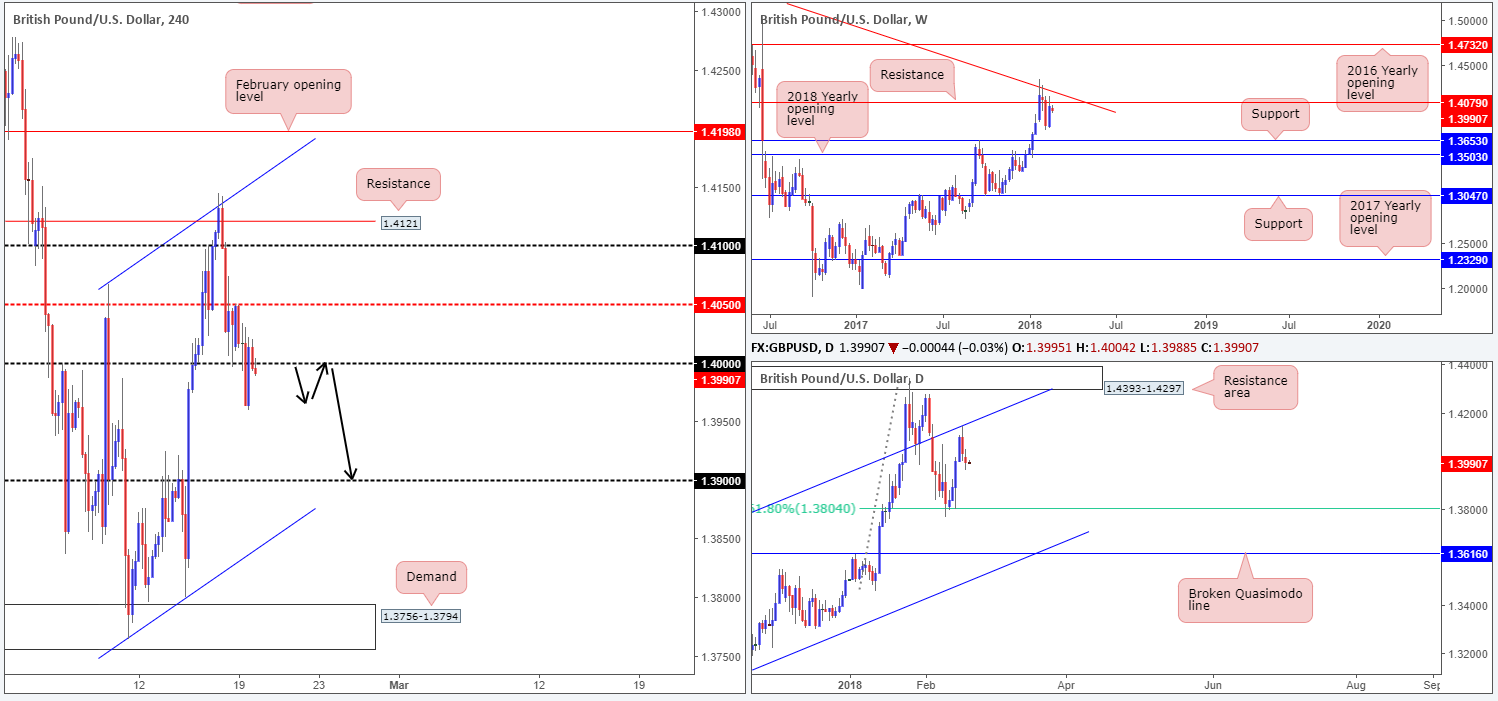
GBP/USD:
As anticipated, trade was quiet on Monday, with the large psychological handle 1.40 being the key talking point of the day.
Meanwhile, over on the weekly timeframe, the unit remains capped by a weekly resistance plotted at 1.4079, which, as you can see, is closely situated near a weekly trendline resistance etched from the high 1.5930. A closer look at price action on the daily timeframe also shows that the unit recently extended Friday’s pullback from a daily channel resistance extended from the high 1.2903.
Potential trading zones:
With both weekly and daily structure establishing a base around noted resistances, and H4 price looking as though it wants to retake the 1.40 band to the downside, further selling could be the order of the day.
Ultimately though, a decisive H4 close below 1.40 is what we’re looking for. This, alongside a successful retest, would, in our technical opinion, be enough to warrant attention. From this point, we do not see a whole lot stopping the H4 candles from driving lower and shaking hands with the 1.39 handle.
Data points to consider: No high-impacting news events on the docket.
Areas worthy of attention:
Supports: 1.40/39 handle.
Resistances: 1.4079; daily channel resistance 1.40 handle (possible).
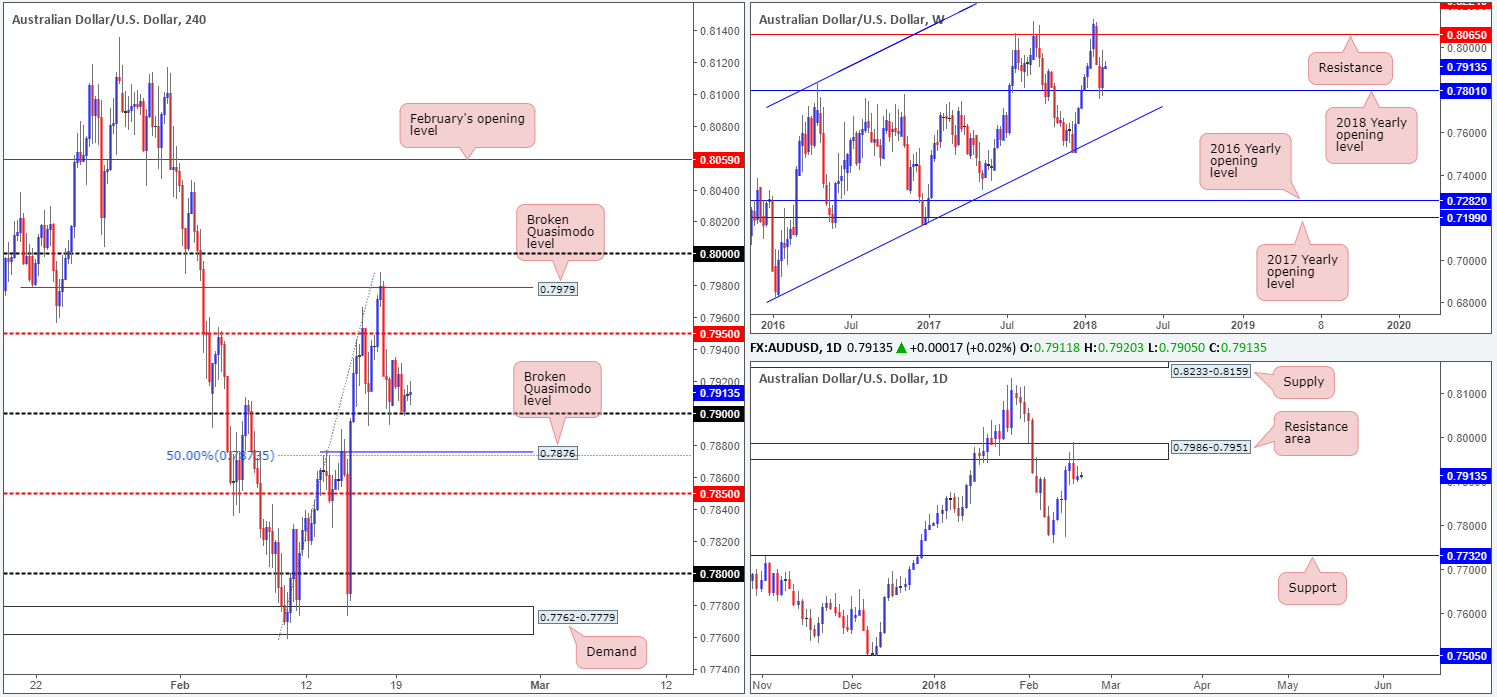
AUD/USD:
The Aussie market traded flat on Monday, with China and the US both on vacation. As you can see, though, the unit refused to give up the 0.79 handle, despite several breaches prior.
On the bigger picture, the commodity currency is seen standing tall off the 2018 yearly opening level at 0.7801. Sustained upside from this point may eventually pull the unit back up to the weekly resistance level pegged at 0.8065. The story on the daily timeframe, however, reveals that price is establishing a topside base around a daily resistance area drawn from 0.7986-0.7951.
Potential trading zones:
Similar to Monday’s report, the pair is still not really offering much to shout about in terms of trading opportunities.
A long from the 0.79 handle (or even the H4 broken Quasimodo line seen just below at 0.7876/50.0% support at 0.7873) is overshadowed by the current daily resistance area, despite backing from weekly structure.
Selling this market is also just as challenging given the collection of noted H4 supports in view!
On account of the above, opting to stand on the sidelines for the time being may be a path to consider.
Data points to consider: No high-impacting news events on the docket.
Areas worthy of attention:
Supports: 0.79 handle; 0.7876/0.7873; 0.7801.
Resistances: 0.7986-0.7951.
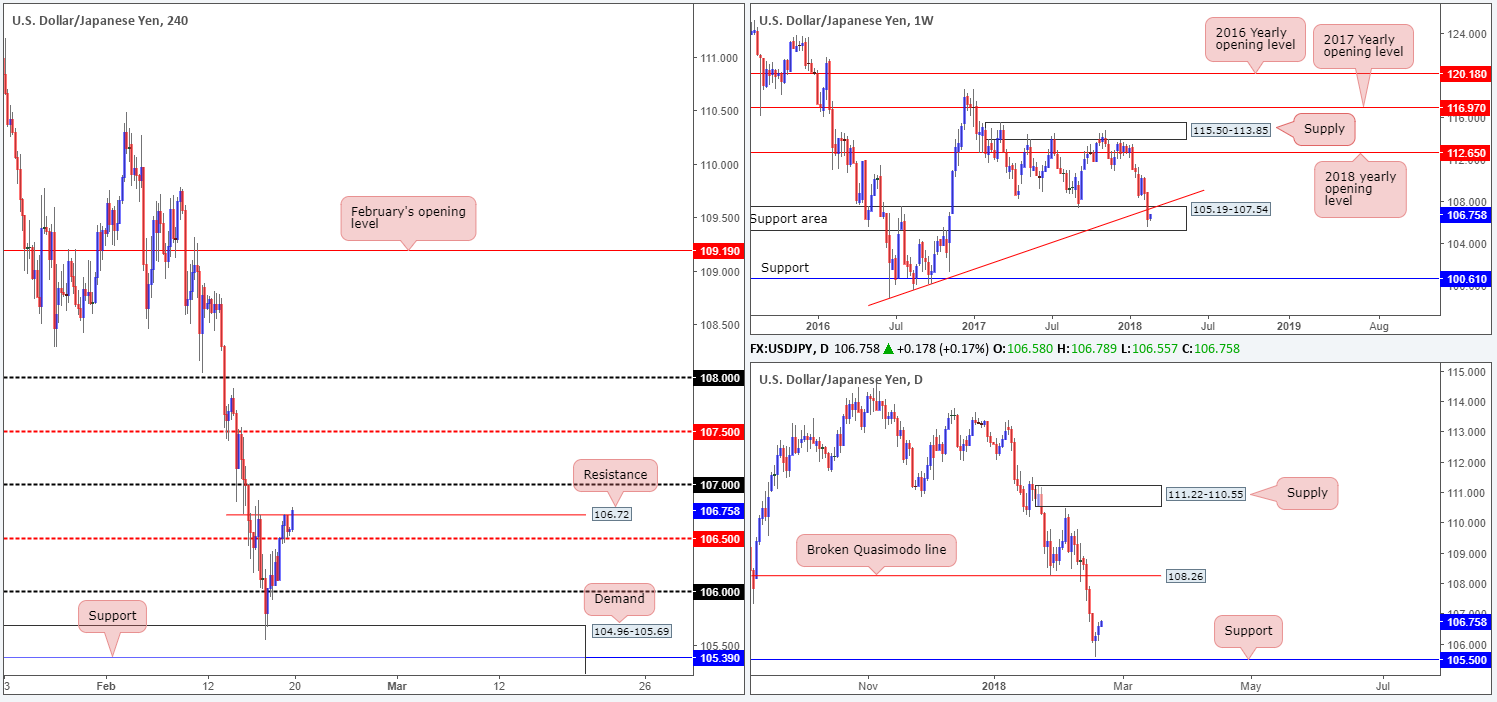
USD/JPY:
Coming in from the top this morning, we can see that weekly movement is showing signs of recovery from within the lower limits of a weekly support area at 105.19-107.54. However, before any meaningful progress can be made, traders will have to contend with the recently broken weekly trendline support-turned resistance extended from the low 98.78.
Looking down on the daily candles, the unit recently managed to find a footing just ahead of a daily support level marked at 105.50. Should this prompt a recovery this week, we could see the daily candles target the broken Quasimodo line at 108.26.
As expected, market action was somewhat subdued on Monday given the US holiday. This saw H4 price tightly consolidate between a H4 resistance level at 106.72 and a H4 mid-level support at 106.50. With the noted H4 resistance looking fragile at this point, the next upside objective falls in at the 107 handle.
Potential trading zones:
According to our technicals, upside remains limited thanks to the 107 number, despite peeking above H4 resistance. There’s also the possibility that we may face resistance from the underside of the recently broken weekly trendline support.
Data points to consider: No high-impacting news events on the docket.
Areas worthy of attention:
Supports: 105.19-107.54; 105.50; 106.50.
Resistances: 106.72; 107 handle; weekly trendline resistance.
USD/CAD:
The USD/CAD, as you can see, remains capped below both the 2018 yearly opening level at 1.2597, the daily resistance level at 1.2590 and the 1.26 handle. Directly above this angle, there’s a nearby H4 Quasimodo resistance level at 1.2625 and H4 supply noted at 1.2669-1.2632.
Both weekly and daily structures are major levels. Therefore, one can expect active sellers to reside here!
Potential trading zones:
The green zone marked on the H4 timeframe at 1.26/1.2579 is a zone worthy of attention today. Downside will likely be free until we reach the 1.2550ish point, and then likely on to the 1.25 handle.
Data points to consider: Canadian wholesale sales m/m at 1.30pm GMT.
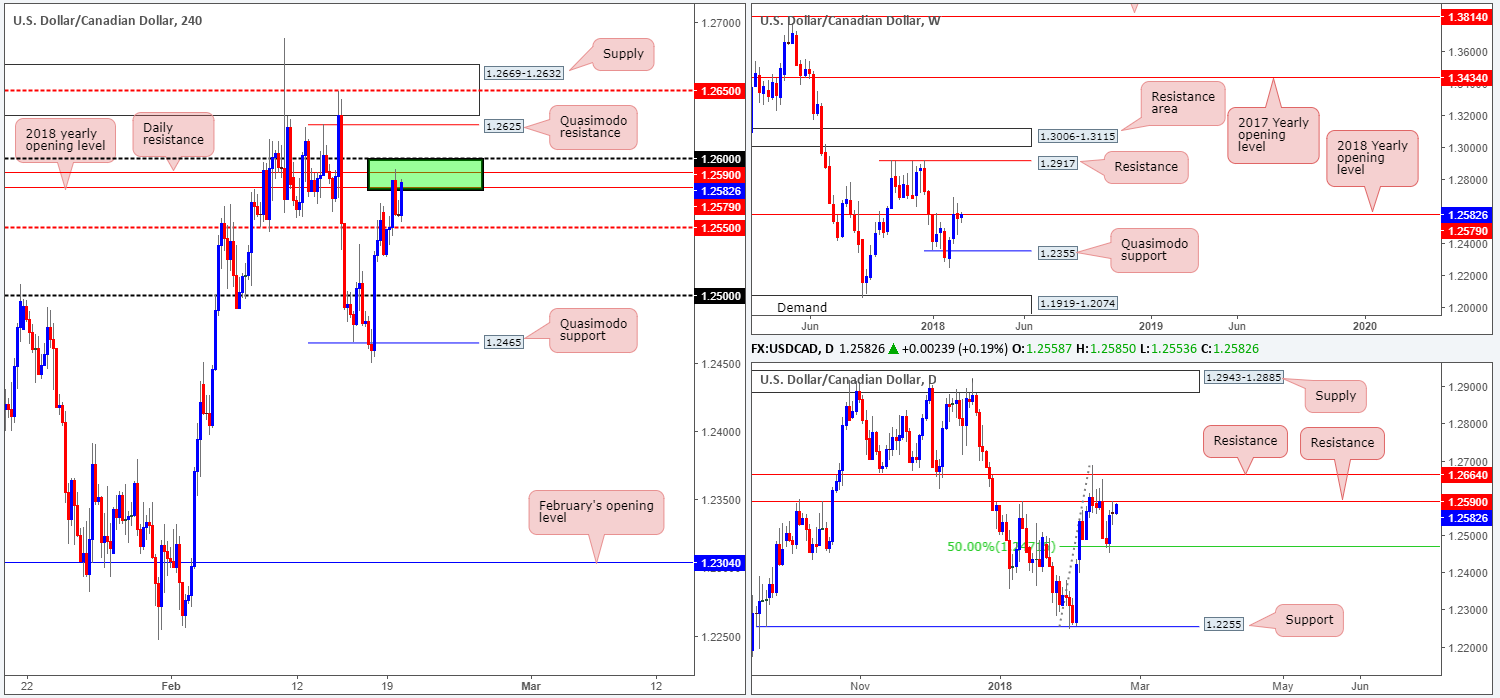
Areas worthy of attention:
Supports: 1.2550; 1.25 handle.
Resistances: 1.26/1.2579.
USD/CHF:
The US dollar is marginally stronger against its Swiss counterpart today, despite ranging only 57 pips on Monday.
As can be seen from the H4 timeframe this morning, February’s opening level at 0.9313 played a key role in yesterday’s movement, capping upside as we moved into the US segment.
Weekly flow is currently trading mid-range between a major resistance area drawn from 0.9443-0.9515 and a weekly support coming in at 0.9163. Daily price, on the other hand, is showing promise from a daily Quasimodo support at 0.9233. In the event that price continues on this path, the next upside target on the daily timeframe can be seen at 0.9444.
Potential trading zones:
A decisive push beyond 0.9313 would be worthy of attention, since H4 upside is then free until we reach resistance plotted at 0.9360. Beyond here, the next port of call would be the 0.94 handle. As such, looking for an intraday pullback to 0.9313 following a H4 close higher could be something to consider.
Data points to consider: No high-impacting news events on the docket.
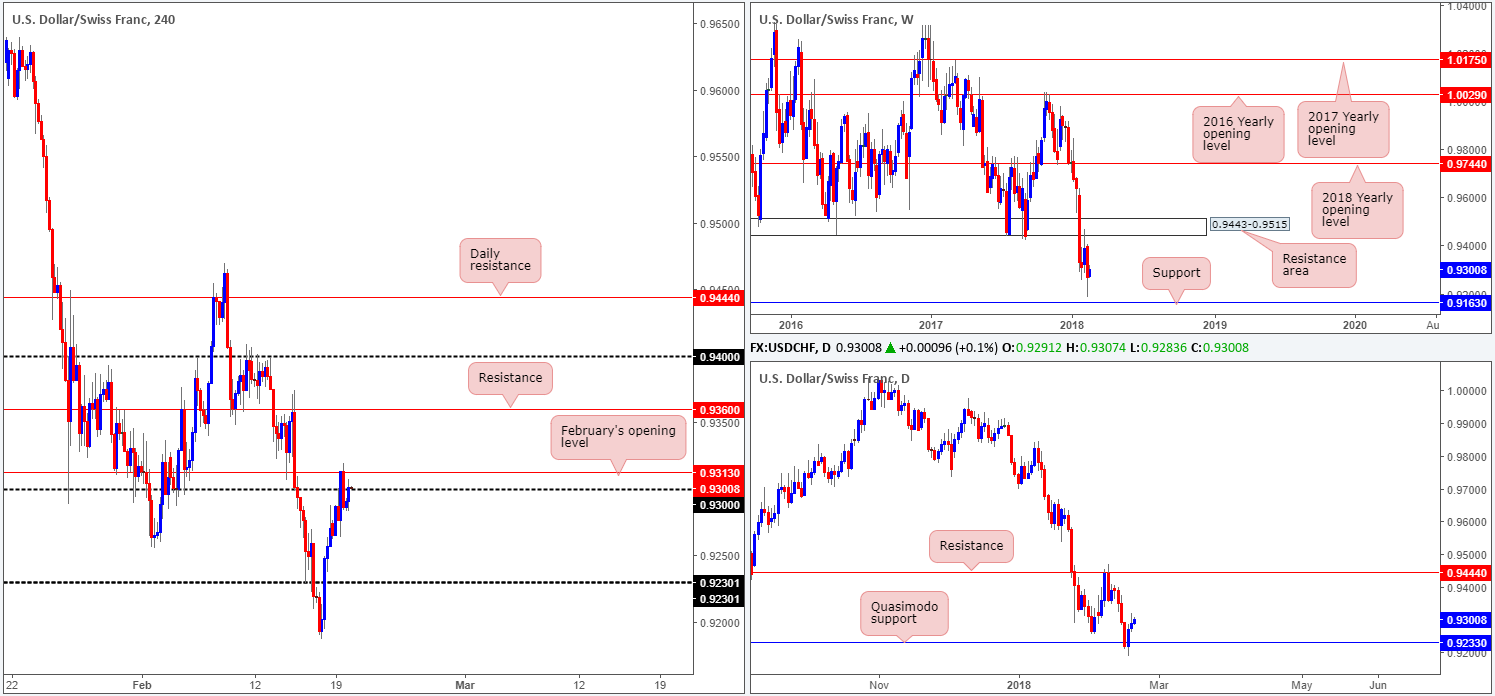
Areas worthy of attention:
Supports: 0.9233; 0.9163.
Resistances: 0.9443-0.9515; 0.9313/0.93 handle; 0.9444.
DOW 30:
After striking the small weekly demand base coming in at 23242-23494, US equities reclaimed the 2018 yearly opening level at 24809 and recouped the majority of the prior week’s downside. Assuming that the buyers maintain a presence above 24809 this week, the next port of call can be seen at 26616-25974: a weekly supply area.
Turning over a page to the daily timeframe, however, it is clear to see that Friday’s action chalked up a strong-looking bearish selling wick at a daily resistance area plotted at 25256-25404. We would not be surprised if this encourages a pullback this week down to the 2018 yearly opening level noted on the weekly timeframe.
Seen within the walls of the aforementioned daily resistance area, there’s a H4 resistance zone drawn from 25256-25394 which also houses a H4 61.8% Fib resistance value at 25381. While weekly price shows support at 24809, the next downside target on the H4 scale does not come into view until we reach demand pegged at 24421-24540.
Potential trading zones:
Despite weekly price showing room to challenge higher prices, buyers may want to begin exercising some caution given the close proximity of H4/daily structures.
Does this mean we should be looking for shorts? Well, knowing how close by the 2018 yearly opening level is located; selling is also likely going to be a challenge!
Data points to consider: No high-impacting news events on the docket.
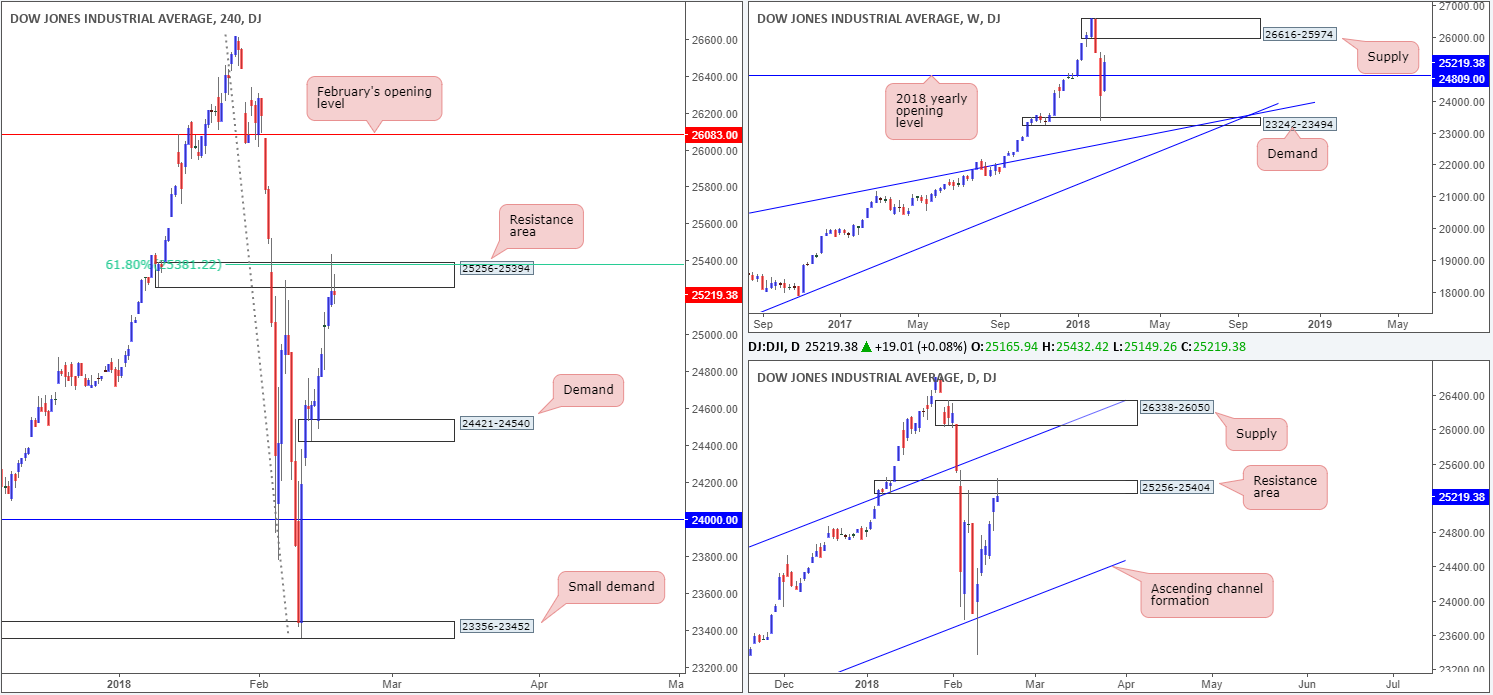
Areas worthy of attention:
Supports: 24421-24540; 23242-23494; 24809.
Resistances: 25256-25394; 25381; 26616-25974; 25256-25404.
GOLD:
In recent movement, the price of gold has extended losses and ripped through February’s opening level at 1345.1 seen on the H4 timeframe. From a technical standpoint, this may have set the stage for a continuation move down to H4 support at 1330.1.
Weekly structure shows price topping ahead of the 1396.8/1375.5 weekly zone marked in green (comprised of a 127.2% weekly Fib ext. point at 1396.8, a 38.2% weekly Fib resistance and a weekly resistance level at 1375.5). The next area of interest to the downside can be seen at the 2018 yearly opening level drawn from 1302.5/weekly channel support etched from the low 1122.8. By the same token, we do not see a whole lot stopping this market from diving as low as the 38.2% daily Fib support at 1316.9/daily support at 1308.4 (blue zone).
Potential trading zones:
The one setup that really stands out this morning is a retest of 1.345.1: Feb’s opening level mentioned above on the H4 timeframe. A strong rejection off of this line in the shape of a full or near-full-bodied H4 bearish candle, is, we believe, enough evidence to suggest a short, targeting H4 support at 1330.1 and an initial take-profit zone.
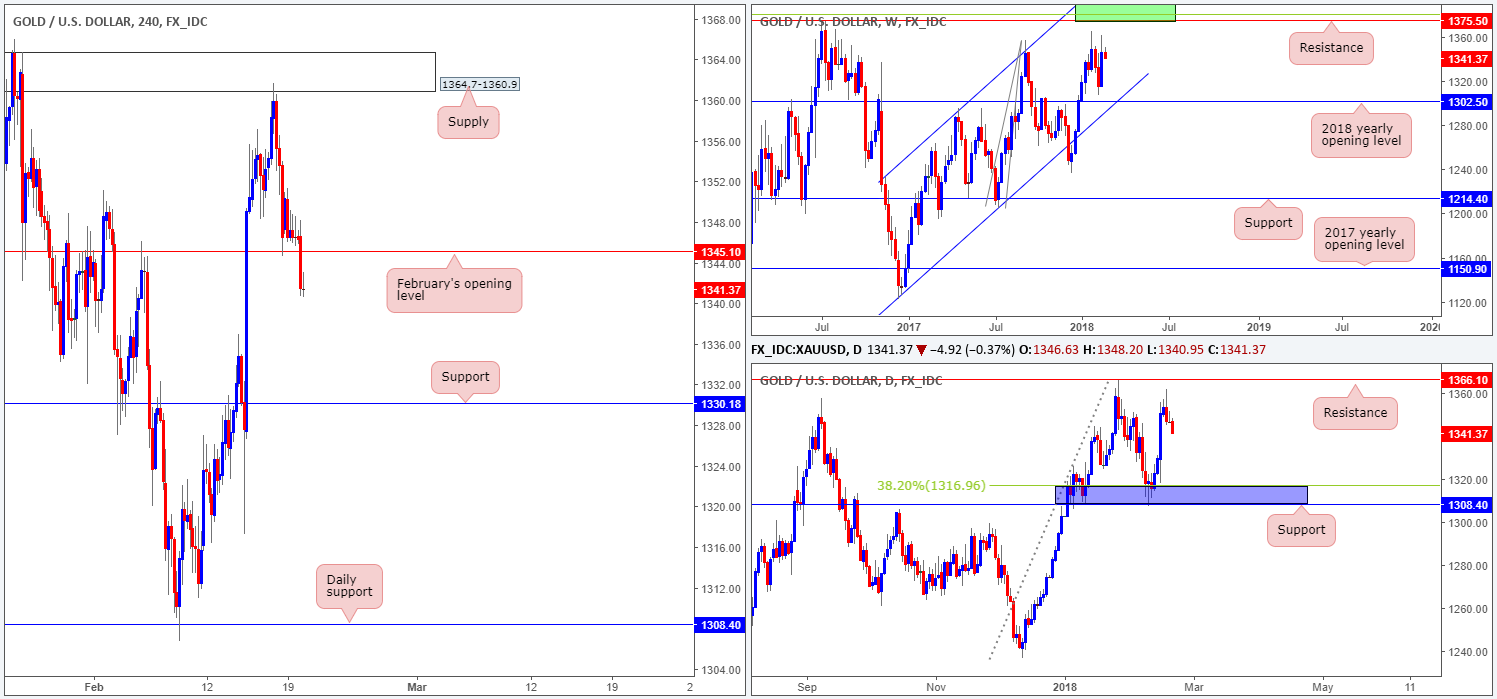
Areas worthy of attention:
Supports: 1330.1; 1308.4/1316.9; 1302.5; weekly channel support.
Resistances: 1366.1; 1396.8/1375.5; 1345.1.
This site has been designed for informational and educational purposes only and does not constitute an offer to sell nor a solicitation of an offer to buy any products which may be referenced upon the site. The services and information provided through this site are for personal, non-commercial, educational use and display. IC Markets does not provide personal trading advice through this site and does not represent that the products or services discussed are suitable for any trader. Traders are advised not to rely on any information contained in the site in the process of making a fully informed decision.
This site may include market analysis. All ideas, opinions, and/or forecasts, expressed or implied herein, information, charts or examples contained in the lessons, are for informational and educational purposes only and should not be construed as a recommendation to invest, trade, and/or speculate in the markets. Any trades, and/or speculations made in light of the ideas, opinions, and/or forecasts, expressed or implied herein, are committed at your own risk, financial or otherwise.
The use of the site is agreement that the site is for informational and educational purposes only and does not constitute advice in any form in the furtherance of any trade or trading decisions.
The accuracy, completeness and timeliness of the information contained on this site cannot be guaranteed. IC Markets does not warranty, guarantee or make any representations, or assume any liability with regard to financial results based on the use of the information in the site.
News, views, opinions, recommendations and other information obtained from sources outside of www.icmarkets.com.au, used in this site are believed to be reliable, but we cannot guarantee their accuracy or completeness. All such information is subject to change at any time without notice. IC Markets assumes no responsibility for the content of any linked site. The fact that such links may exist does not indicate approval or endorsement of any material contained on any linked site.
IC Markets is not liable for any harm caused by the transmission, through accessing the services or information on this site, of a computer virus, or other computer code or programming device that might be used to access, delete, damage, disable, disrupt or otherwise impede in any manner, the operation of the site or of any user’s software, hardware, data or property.


