EURUSD:
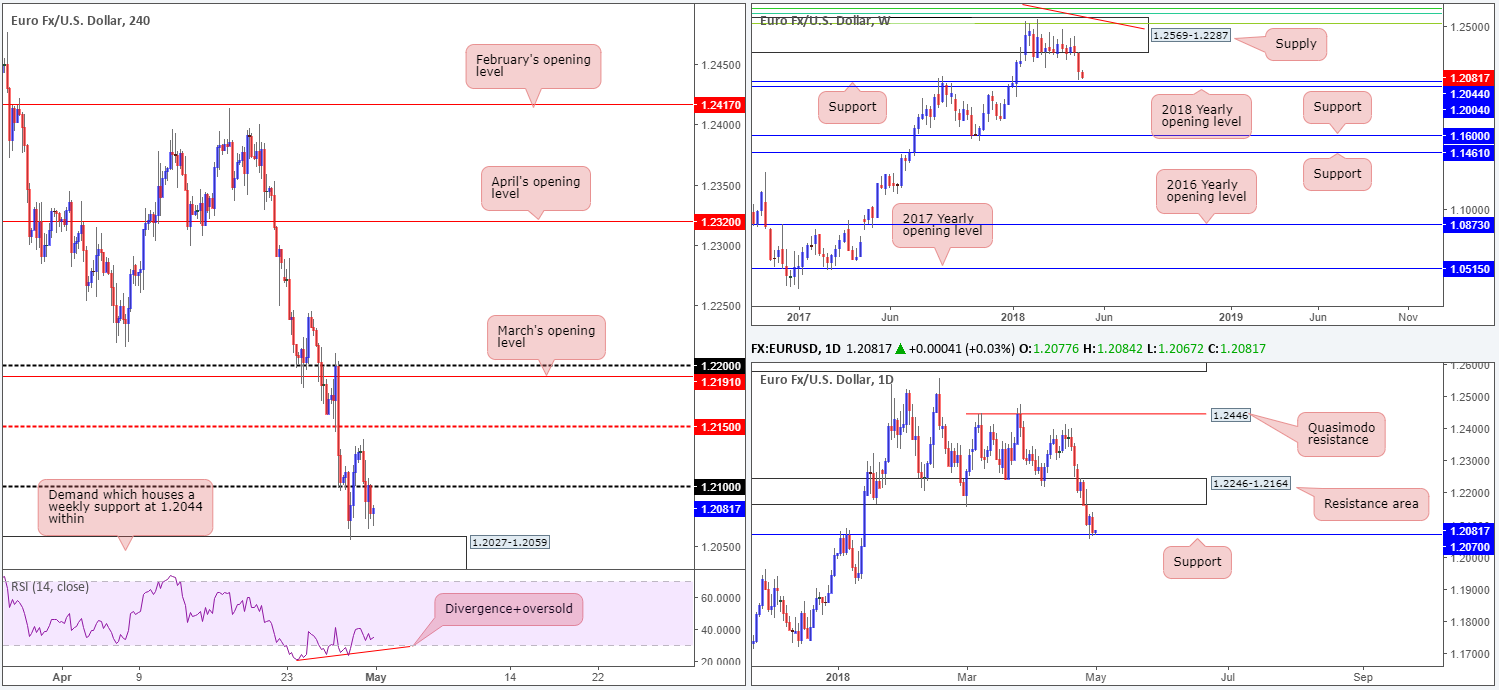
During the course of Monday’s sessions the USD climbed higher and reconnected with a major monthly resistance level plotted at 91.92 (seen on the US dollar index). The euro, on the other hand, breached the 1.21 handle amid London’s session, exacerbated by disappointing inflation figures out of Germany, and concluded the day closing just north of a H4 demand coming in at 1.2027-1.2059.
As highlighted in Monday’s weekly report, the longer-term picture shows weekly price trading within touching distance of a weekly support drawn from 1.2044, shadowed closely by the 2018 yearly opening level at 1.2004. In terms of daily movement, Friday’s daily bullish pin-bar formation formed off of daily support at 1.2070 failed to generate much upside on Monday. The support level remains intact, but for how long is anybody’s guess given yesterday’s action ended the session forming a near-full-bodied daily bearish candle.
Potential trading zones:
An area to watch we believe is the H4 demand mentioned above at 1.2027-1.2059 – more specifically the weekly support level housed within it at 1.2044.This could, given the USD seen testing monthly resistance, be an area to consider for longs, targeting 1.21 as an initial take-profit zone. A break of the said H4 demand, nevertheless, would almost immediately expose the 2018 yearly opening level mentioned above on the weekly timeframe at 1.2004.
Traders are reminded that the majority of European banks are closed today due to Labor Day. Therefore, liquidity could be affected.
Data points to consider today: European banks closed in observance of Labor Day; US ISM manufacturing PMI.
GBP/USD:
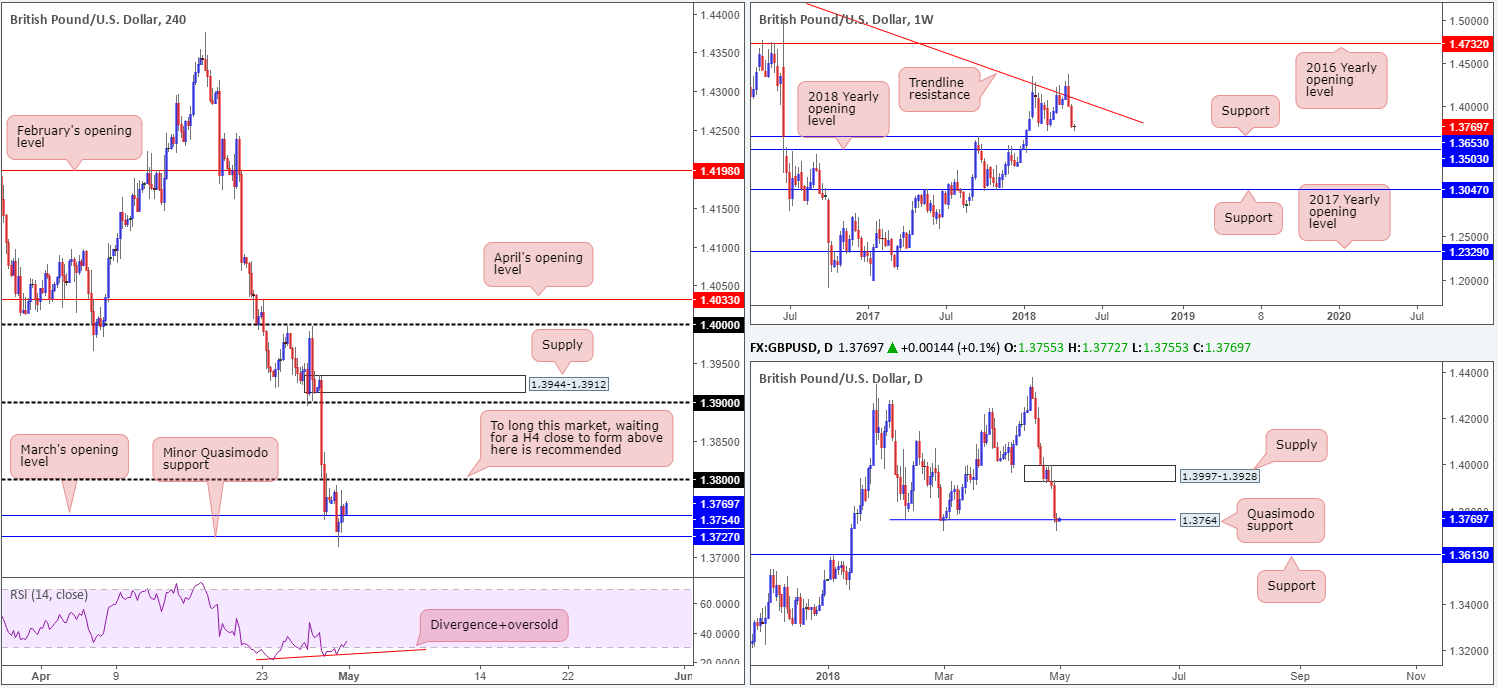
Cable managed to recover off a minor H4 Quasimodo support level marked at 1.3727 on Monday, following a brief decline during early London hours. The selloff was triggered on news of another political fall-out and doubts about a Brexit transition deal.
Despite recent movement, the team’s outlook remains unchanged…
Last week’s downside move, following a strong weekly bearish engulfing candle that nose-dived back beneath a long-term weekly trend line resistance (taken from the high 1.5930), has placed weekly support at 1.3653 in the firing range. In regards to the daily timeframe, a daily Quasimodo support level at 1.3764 continues to hold ground, despite an attempt to push lower yesterday. A bounce from this vicinity could lead to the unit challenging a newly-formed daily supply zone registered at 1.3997-1.3928, whereas a break of 1.3764 has the daily support at 1.3613 to target.
Potential trading zones:
Considering daily price remains trading from a Quasimodo support, and H4 movement appears reasonably firm above March’s opening level at 1.3754, which, as you can probably see, is also bolstered by H4 RSI divergence/oversold readings, a pop higher could be in store. The only grumble, however, is the fact that weekly price indicates lower levels may be seen.
With this in mind, the team has noted to sit tight and wait for a H4 close above 1.38 to materialize before contemplating a long position. Although this does not guarantee further bidding in this market, what it does point to is buyer intent that could ultimately lead to a retest of 1.38 as support (an ideal buy signal should it hold in the shape of a H4 bullish close) and a move being seen up to 1.39.
Data points to consider today: UK manufacturing PMI; UK net lending to individuals m/m; US ISM manufacturing PMI.
AUD/USD:
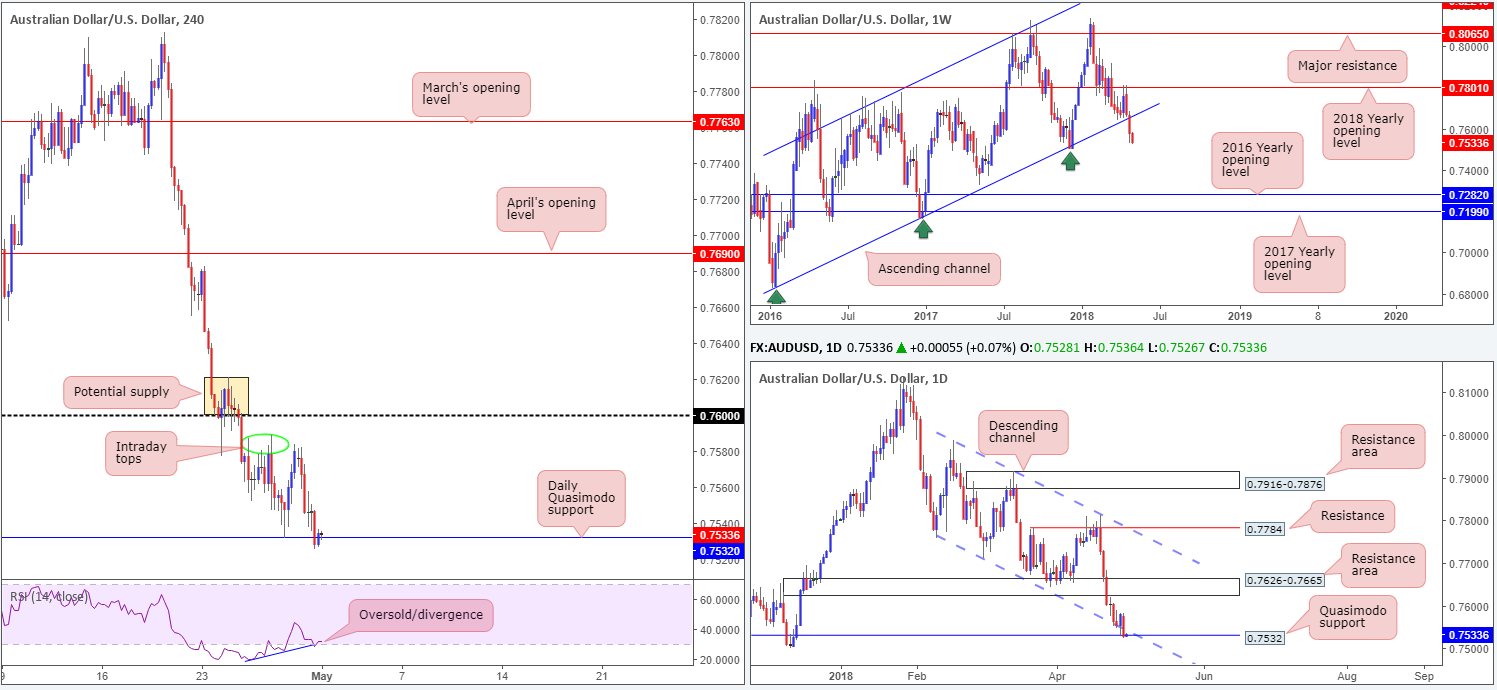
The Australian dollar racked up another day of losses on the back of an upbeat US dollar during Monday’s session. The candles geared up to begin staging a recovery off the daily Quasimodo support at 0.7532, but failed to sustain gains beyond intraday tops (H4) sited at 0.7580ish (green circle).
Although the daily Quasimodo support is somewhat bolstered by the fact that it converges with a daily channel support extended from the low 0.7758, weekly price could potentially pressure this market lower after aggressively breaking out of a long-term weekly ascending channel formation (taken from the low 0.6827). A breach of the weekly low 0.7502 would, as far as we can see, likely trigger further downside on this scale.
Potential trading zones:
In light of the pair’s recent selloff, traders may be cautious at entering long from the current daily Quasimodo support. We understand this. However, seeing as the US dollar index is seen trading from a monthly resistance at 91.92 right now, we could see a USD decline materialize and a potential rally in major G10 currencies, including the Aussie dollar. As such, should a H4 full or near-full-bodied rotation candle present itself from here, longs could still be in order, targeting 0.76s, followed by the daily resistance area at 0.7626-0.7665.
Traders are reminded that we also have the RBA meeting later on today. Therefore, do keep an eye on the AUD/USD during this time!
Data points to consider today: RBA meeting; RBA Gov. Lowe speaks; US ISM manufacturing PMI.
USD/JPY:
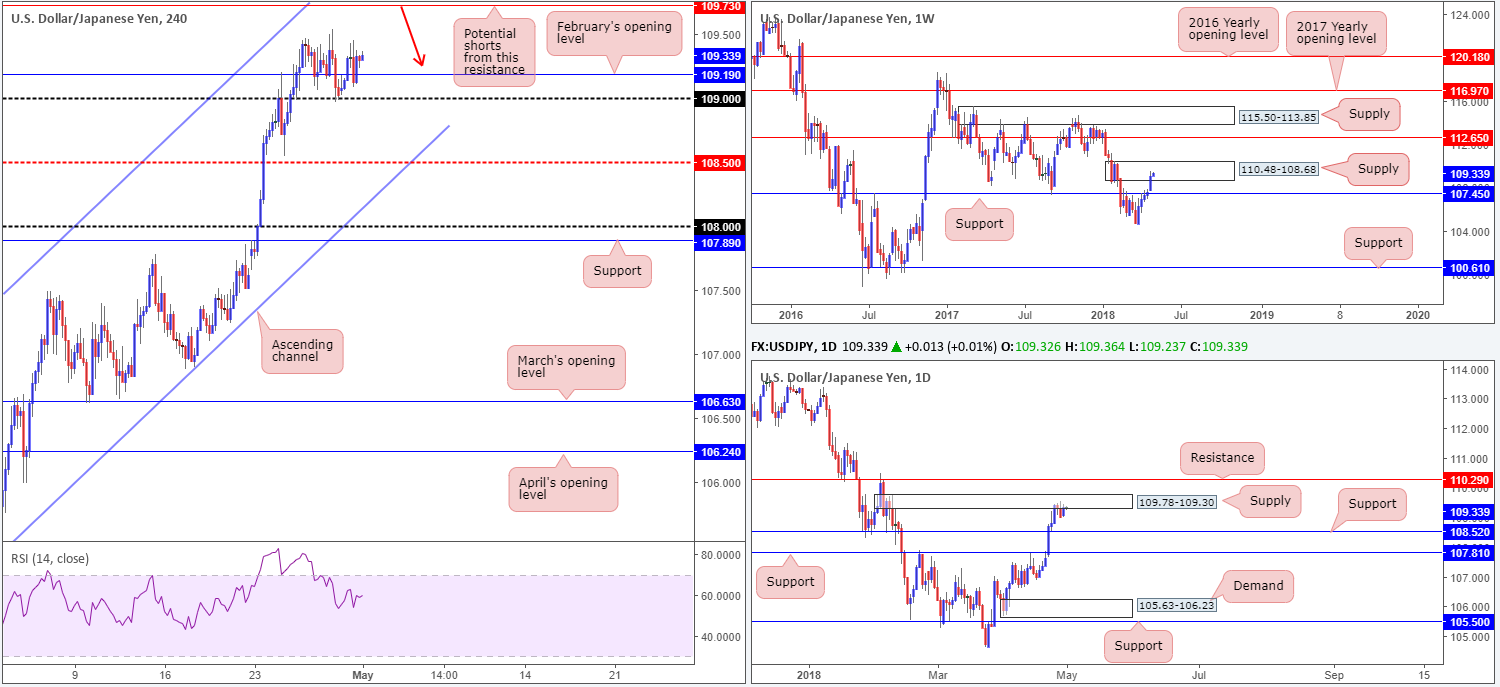
Since Wednesday, the USD/JPY market has been entrenched within a tight range between the 109 handle and a H4 mid-level resistance at 109.50. Initially, the team was watching for a break of 109, but this failed to come to fruition. This has positioned H4 resistance at 109.73 on the hit list.
The reason behind taking a fancy to 109.73 simply boils down to where it is positioned on the higher timeframes. Although the pair chalked up its fifth consecutive weekly gain last week, weekly price is currently seen trading within the walls of a weekly supply zone penciled in at 110.48-108.68. Glued within this area is also a daily supply zone pictured at 109.78-109.30, which, as you can see, continues to hold ground. The H4 resistance at 109.73 is positioned within the upper limits of the said daily supply!
Potential trading zones:
In light of the above, a short from the noted H4 resistance could be an option during today’s segment. The best part about this, though, is one is able to position stops ABOVE the daily supply, allowing an incredibly tight stop! Ultimately, the initial downside target falls in at February’s opening level at 109.19/109. A break of this region, however, would likely lead to a move down to the H4 mid-level resistance 108.50, which happens to converge with daily support at 108.52 (the next support target from the current daily supply).
Data points to consider today: US ISM manufacturing PMI.
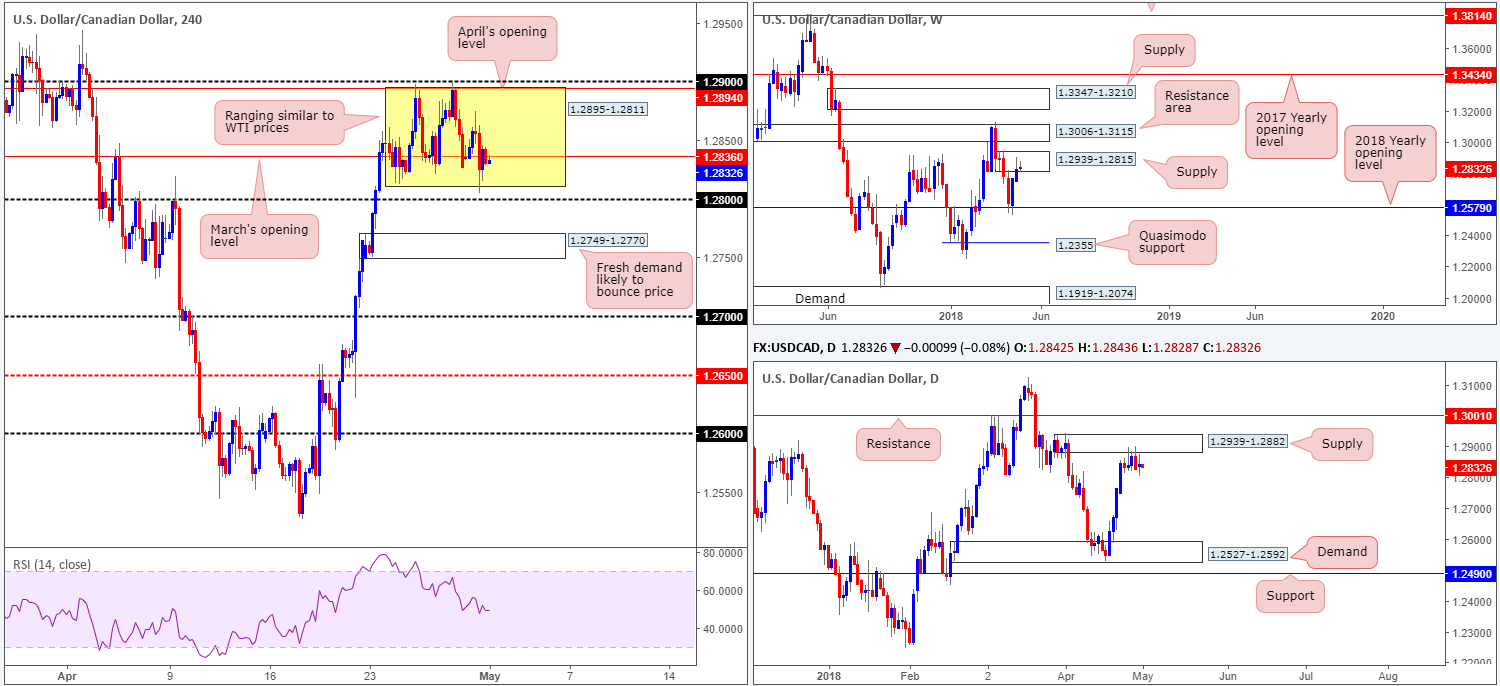
USD/CAD:
In similar fashion to WTI prices, which is seen fluctuating between 67.31/69.08, the USD/CAD is seen chalking up a reasonably tight range between 1.2895/1.2811 (within the area is March’s opening level seen at 1.2836). Despite this, the team remains biased to the downside.
Weekly action is seen trading from weekly supply at 1.2939-1.2815, following a stronger-than-expected rebound off the 2018 yearly opening level at 1.2579 two weeks ago. In conjunction with weekly flow, daily price crossed swords with a daily supply zone at 1.2939-1.2882 and has held ground since March 25.
Potential trading zones:
A break of 1.28 would likely spark a round of selling. However, the fresh H4 demand based at 1.2749-1.2770 is highly likely to bounce price. That being the case, we would recommend waiting for the current H4 demand area to be engulfed before considering short positions. Yes, the next downside target is relatively close from an intraday perspective: 1.27, but given that the next support target on the bigger picture does not come into view until daily demand at 1.2527-1.2592, it’s possible that the unit could drop as far south as 1.26s!
Data points to consider today: US ISM manufacturing PMI; CAD GDP m/m; BoC Gov. Poloz speaks.
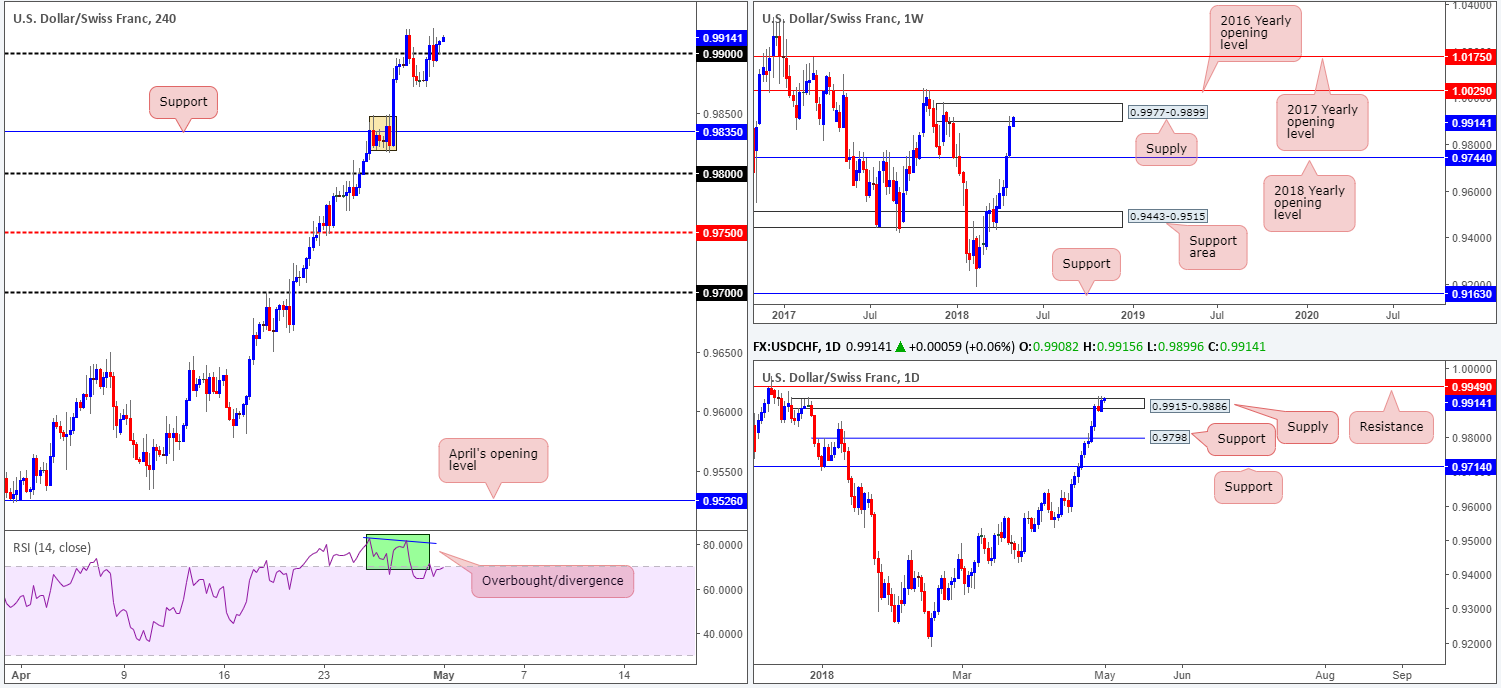
USD/CHF:
Talks of denuclearization between North and South Korea hurt demand for the save-haven CHF on Monday. The USD/CHF put in a strong bottom just ahead of 0.9870 and reclaimed the 0.99 handle. In addition to this, daily supply at 0.9915-0.9886 came under pressure as a result of the recent move higher. Stop-loss orders above this zone are likely being filled, as we write. Clearance of these orders automatically shines the spotlight on nearby daily resistance priced in at 0.9949. This, as far as we can see, is the last remaining notable higher-timeframe resistance level within the weekly supply zone at 0.9977-0.9899. Therefore, a break of this daily level could be an early indication that the current weekly supply is about to fall apart and higher prices are likely going to be seen to parity.
Potential trading zones:
Although USD strength is incredibly resilient at the moment, buying into weekly supply is not a path we would advise. Further adding to this, the US dollar index shows monthly price recently engaged with a monthly resistance level at 91.92. This is a substantial level, traders. Do not overlook it! Therefore, longs above 0.99 are not recommended.
In regard to potential shorts, the team has their eyes on the daily resistance level mentioned above at 0.9949. While this is effectively selling against current sentiment, we like the fact that not only is the level positioned within weekly supply, it also represents a mid-level psychological base at 0.9950. Should a H4 fill or near-full-bodied bearish candle be seen off this number, shorting this market would be valid, according to the technicals. Expect possible buying pressure to materialize from 0.9915-0.9886. Reducing risk to breakeven following a touch of this area is advised.
Data points to consider today: US ISM manufacturing PMI; majority of Swiss banks closed in observance of Labor Day.
This site has been designed for informational and educational purposes only and does not constitute an offer to sell nor a solicitation of an offer to buy any products which may be referenced upon the site. The services and information provided through this site are for personal, non-commercial, educational use and display. IC Markets does not provide personal trading advice through this site and does not represent that the products or services discussed are suitable for any trader. Traders are advised not to rely on any information contained in the site in the process of making a fully informed decision.
This site may include market analysis. All ideas, opinions, and/or forecasts, expressed or implied herein, information, charts or examples contained in the lessons, are for informational and educational purposes only and should not be construed as a recommendation to invest, trade, and/or speculate in the markets. Any trades, and/or speculations made in light of the ideas, opinions, and/or forecasts, expressed or implied herein, are committed at your own risk, financial or otherwise.
The use of the site is agreement that the site is for informational and educational purposes only and does not constitute advice in any form in the furtherance of any trade or trading decisions.
The accuracy, completeness and timeliness of the information contained on this site cannot be guaranteed. IC Markets does not warranty, guarantee or make any representations, or assume any liability with regard to financial results based on the use of the information in the site.
News, views, opinions, recommendations and other information obtained from sources outside of www.icmarkets.com.au, used in this site are believed to be reliable, but we cannot guarantee their accuracy or completeness. All such information is subject to change at any time without notice. IC Markets assumes no responsibility for the content of any linked site. The fact that such links may exist does not indicate approval or endorsement of any material contained on any linked site.
IC Markets is not liable for any harm caused by the transmission, through accessing the services or information on this site, of a computer virus, or other computer code or programming device that might be used to access, delete, damage, disable, disrupt or otherwise impede in any manner, the operation of the site or of any user’s software, hardware, data or property.


