A note on lower timeframe confirming price action…
Waiting for lower timeframe confirmation is our main tool to confirm strength within higher timeframe zones, and has really been the key to our trading success. It takes a little time to understand the subtle nuances, however, as each trade is never the same, but once you master the rhythm so to speak, you will be saved from countless unnecessary losing trades. The following is a list of what we look for:
- A break/retest of supply or demand dependent on which way you’re trading.
- A trendline break/retest.
- Buying/selling tails – essentially we look for a cluster of very obvious spikes off of lower timeframe support and resistance levels within the higher timeframe zone.
- Candlestick patterns. We tend to only stick with pin bars and engulfing bars as these have proven to be the most effective.
EUR/USD:
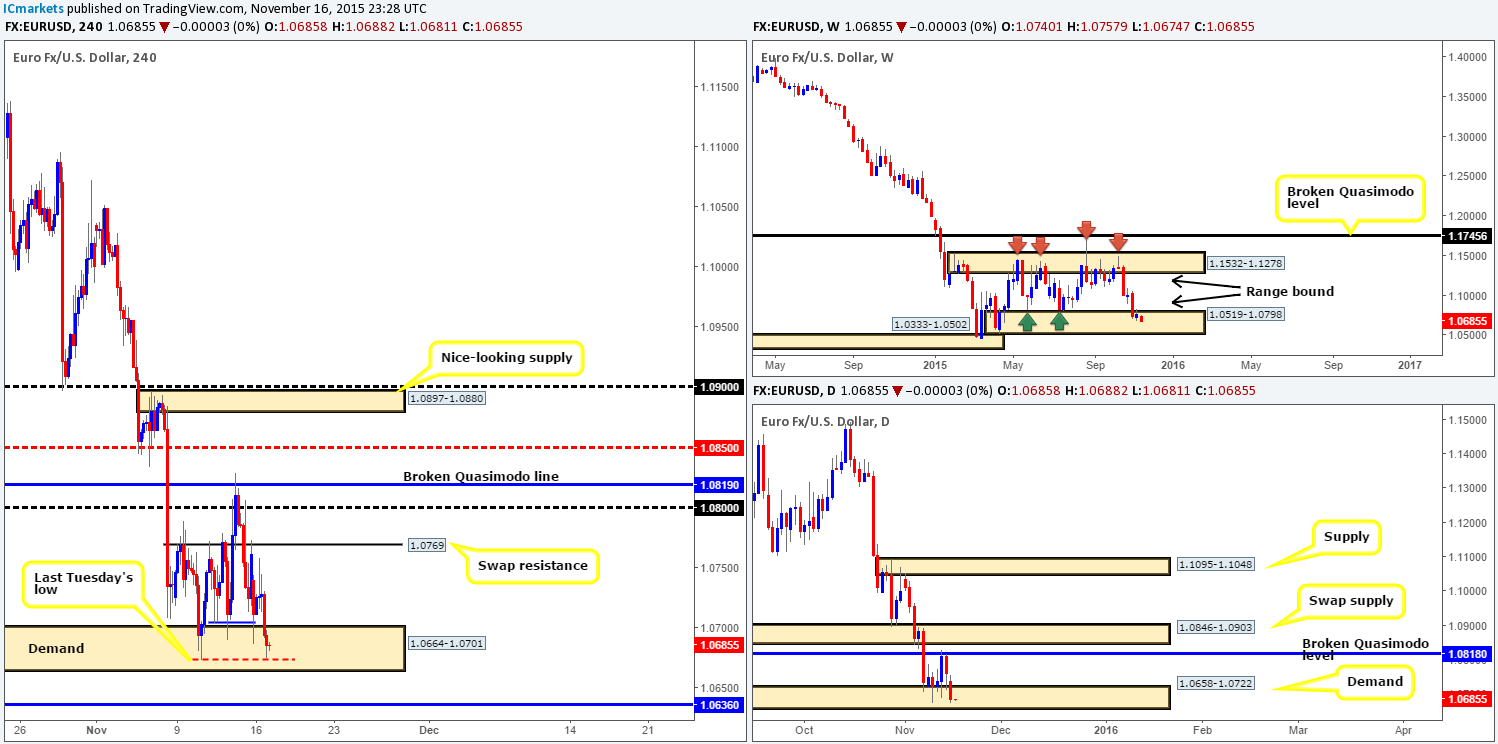
In our previous report (http://www.icmarkets.com/blog/monday-16th-november-weekly-technical-outlook-and-review/), we mentioned that we were on the lookout for confirmed buys around the H4 Quasimodo support at 0.7040 (blue line). Unfortunately, we missed this bounce altogether as no confirming (lower timeframe) price action was seen. It turns out we did not miss much anyway as shortly after price bounced from here, strong sellers stepped in around the London opening and aggressively drove the EUR lower, surpassing the Quasimodo level and diving into demand at 1.0664-1.0701.
As far as we see, things are looking rather bleak for the EUR right now – the trend is clearly southbound and fundamentals seem to be against the currency. While this may be true, we cannot ignore the fact that price is still trading within both a weekly (range) demand at 1.0519-1.0798, and a daily demand coming in at 1.0658-1.0722. Given this, there is some buying interest being seen within the current H4 demand zone at the moment, specifically around last Tuesday’s low 1.0673 (dashed-red line). As such, the only option we see at present is to look for a confirmed long off the back of this low (see above), targeting 1.0700 first and foremost. Should this level give way, however, then we’re likely going to see a continuation move south down to H4 swap support drawn from 1.0636.
Levels to watch/live orders:
- Buys: 1.0673 [Tentative – confirmation required] (Stop loss: dependent on where one confirms this level).
- Sells: Flat (Stop loss: N/A).
GBP/USD:
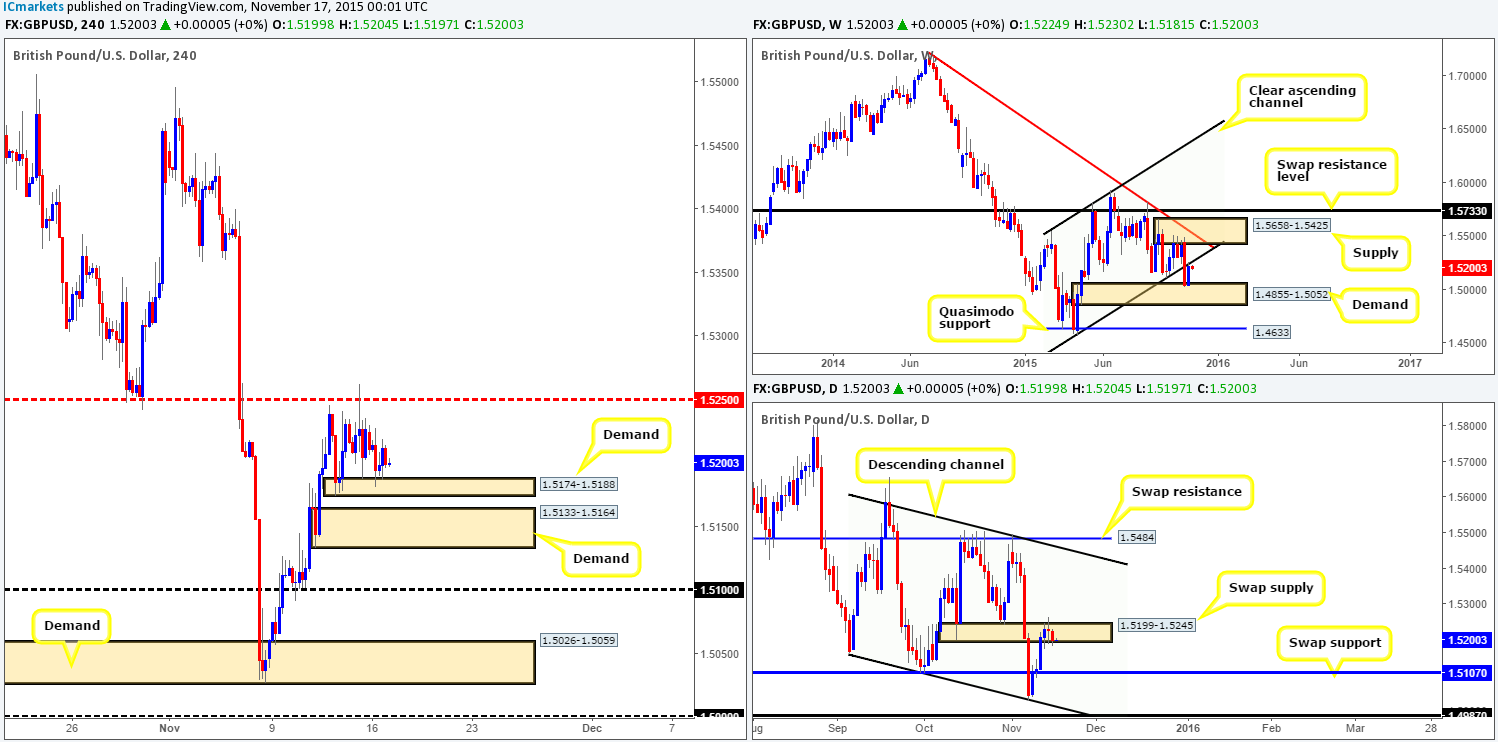
During the course of yesterday’s sessions, we saw Cable shake hands with H4 demand seen at 1.5174-1.5188, which, as you can see, managed to reach highs of 1.5219 going into the American afternoon session.
With price still trading around the underside of the recently broken weekly channel support-turned resistance line (1.4564), and also within a daily swap (supply) area at 1.5199-1.5245, we remain biased to the downside for now. That being the case, the 1.5250 barrier is once again the level to watch above – given the right lower timeframe confirmation pattern, we would look to short from here again this week.
Below, however, both the current H4 demand at 1.5174-1.5188 and the one lurking just below it at 1.5133-1.5164 are not areas we’d enter long from due to the clear higher timeframe resistances seen directly above it (see above). On top of that, these areas have absolutely no connection with the higher timeframes whatsoever, thus making them low probability and, in our opinion, only good for a bounce at best. It would only be around the around the psychological support level 1.5100 would our team begin looking to buy this market again, owing to it converging nicely with a daily swap (support) barrier at 1.5107 (the next downside target from the aforementioned daily swap [supply] area).
Levels to watch/ live orders:
- Buys: 1.5100 [Tentative – confirmation required] (Stop loss: dependent on where one confirms this level).
- Sells: 1.5250 [Tentative – confirmation required] (Stop loss: dependent on where one confirms this level).
AUD/USD:
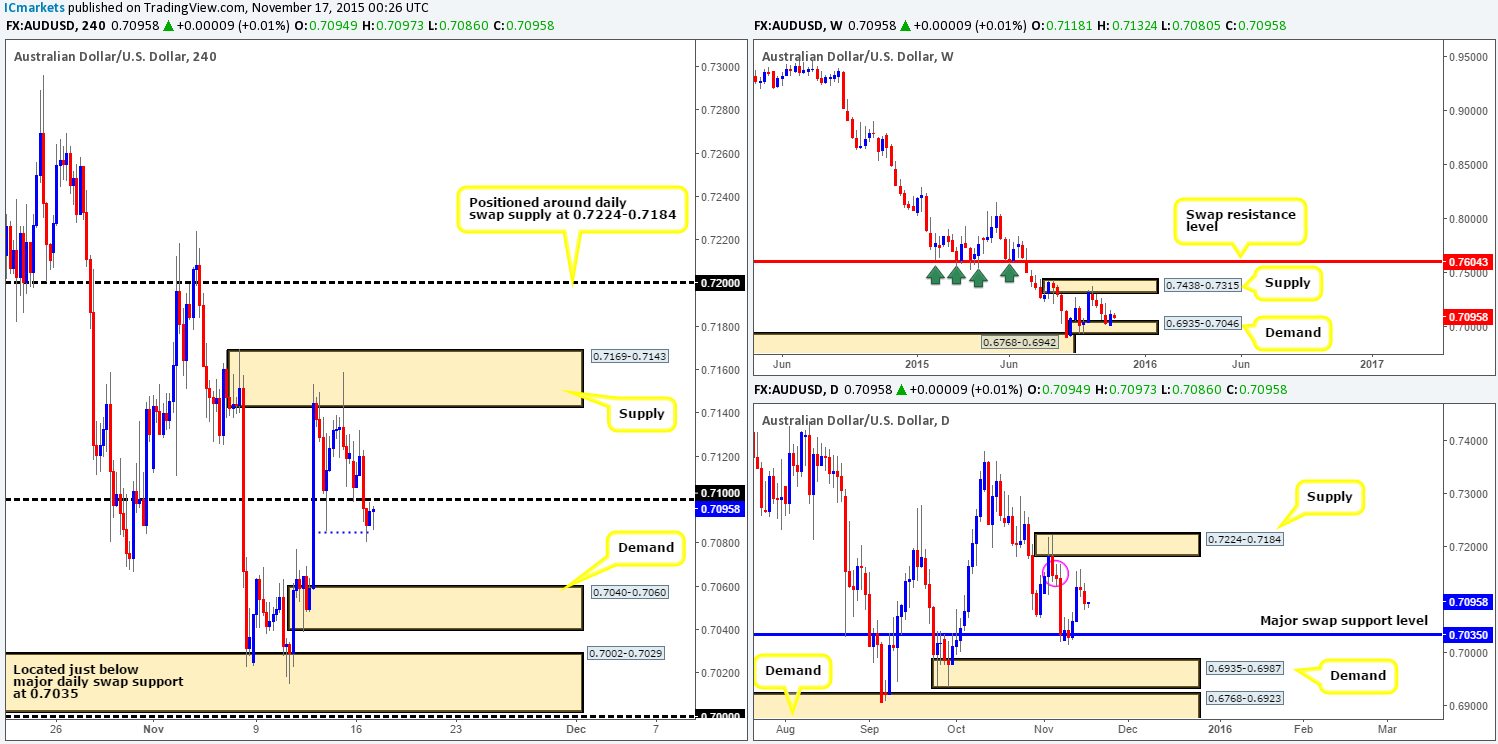
Shortly after the markets opened, price shook hands with the psychological support 0.7100, and managed to reach highs of 0.7132. It was from here – the London open, we saw things take a turn for the worst. A strong wave of offers was seen entering the market, taking out not only 0.7100, but also jabbing below Thursday’s low 0.7085 (dashed-blue line).
Given that most of the bids around Thursday’s low are now likely consumed/stopped out, and if 0.7100 holds as resistance, we see little in the way of price dropping down to connect with at least demand drawn from 0.7040-0.7060 today. In support of this, we can see daily action currently responding nicely to a minor supply area circled in pink at 0.7168-0.7141, with a downside target coming in at 0.7035 – a major swap support level. However, scrolling up to the weekly timeframe, its clear price is trading from demand seen at 0.6935-0.7046. Therefore, to be safe, in order for us to be permitted to short from 0.7100 today, lower timeframe confirming price action would be required.
Given that the profit target from 0.7100 is around the 0.7060 mark, the maximum stop-loss permissible on this short-term sell trade is best kept at twenty pips or lower to keep risk/reward at a ratio of at least 1:2.
Levels to watch/ live orders:
- Buys: Flat (Stop loss: N/A).
- Sells: 0.7100 region [Tentative – confirmation required] (Stop loss: dependent on where one confirms this level).
USD/JPY:
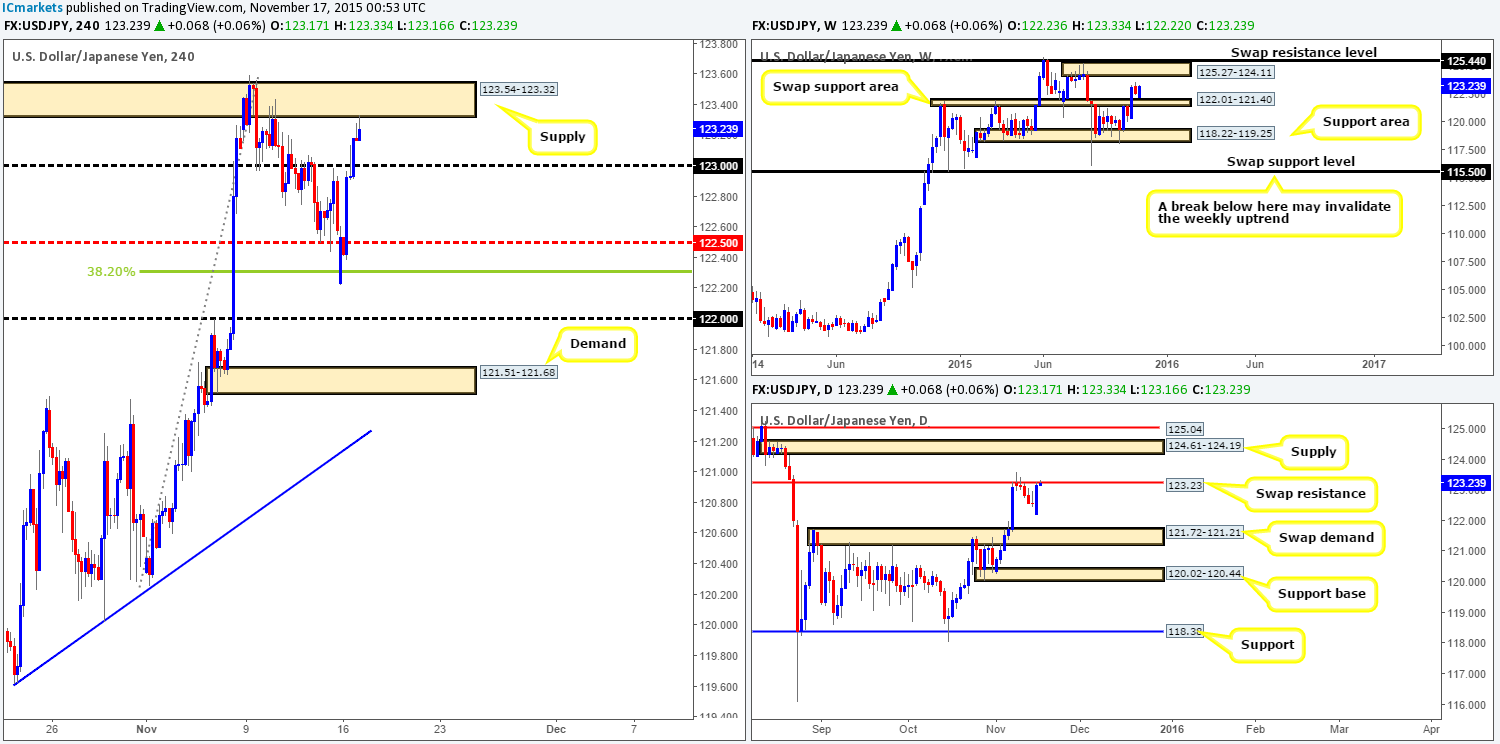
Following the open 122.23, the USD/JPY remained well-bid from the 38.2% Fibonacci support level at 122.30, consequently wiping out offers at both mid-level resistance 122.50 and psychological resistance 123.00.
As a result of yesterday’s rally, price is now kissing the underside of supply coming in at 123.54-123.32, which could put a halt on any further buying today, due to it lining up nicely with a daily swap (resistance) level at 123.23. Therefore, we may, dependent on how the lower timeframe action responds here, look to take a small intraday short trade down to 123.00.
A break above this supply zone on the other hand would likely see a further advance up into the jaws of another supply coming in at 124.14-123.88. This area could provide us with a very stable zone to sell from. The reason for why is that not only is it located nicely below a daily supply visible at 124.61-124.19, but is also glued to the underside of a weekly supply at 125.27-124.11 as well.
Levels to watch/ live orders:
- Buys: Flat (Stop loss: N/A).
- Sells: 123.54-123.32 [Tentative – confirmation required] (Stop loss: dependent on where one confirms this area) 124.14-123.88 (this area looks to be good enough for a market short – no confirmation required).


