A note on lower timeframe confirming price action…
Waiting for lower timeframe confirmation is our main tool to confirm strength within higher timeframe zones, and has really been the key to our trading success. It takes a little time to understand the subtle nuances, however, as each trade is never the same, but once you master the rhythm so to speak, you will be saved from countless unnecessary losing trades. The following is a list of what we look for:
- A break/retest of supply or demand dependent on which way you’re trading.
- A trendline break/retest.
- Buying/selling tails/wicks – essentially we look for a cluster of very obvious spikes off of lower timeframe support and resistance levels within the higher timeframe zone.
- Candlestick patterns. We tend to stick with pin bars and engulfing bars as these have proven to be the most effective.
We search for lower timeframe confirmation between the M15 and H1 timeframes, since most of our higher-timeframe areas begin with the H4. Stops are usually placed 3-5 pips beyond confirming structures.
EUR/USD:
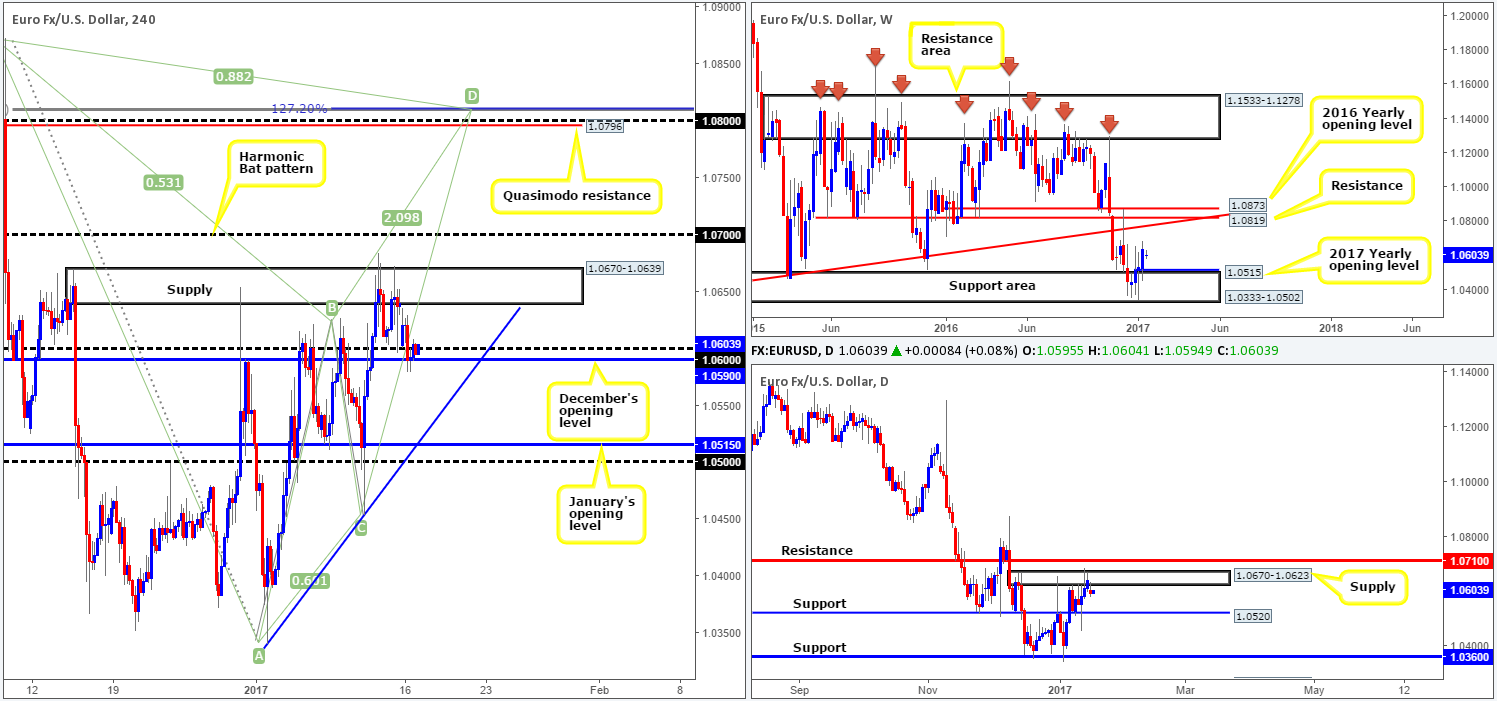
Going into the early hours of yesterday’s London segment a wave of offers flooded the market, resulting in price breaking beneath the psychological band 1.06 and attacking December’s opening level at 1.0590. From there on price entered into somewhat of a lackluster phase, likely due to both a relatively light docket and also the fact that US banks were closed in observance of Martin Luther King Day.
In light of recent movement, much of the following report will echo similar thoughts put forward in Monday’s analysis.
The EUR was seen flexing its financial muscle last week with price tapping highs of 1.0684. Should we see a similar picture this week, it’s likely that the unit will shake hands with the long-term weekly trendline resistance extended from the low 0.8231. Therefore, do keep an eyeball on this line this week.
Daily supply at 1.0670-1.0623, in our opinion, appears to be on the verge of giving way. Thursday’s candle, as you can see, stabbed through the top edge of this barrier, suggesting stops had likely been triggered. Following this, Friday’s candle printed its third consecutive bullish close to end the week. If indeed we’re correct here, the next objective seen beyond this base is a daily resistance coming in at 1.0710.
Our suggestions: With the H4 candles seen testing December’s opening level right now, a long trade could be a possibility (preferably with the backing of a reasonably sized H4 bull candle) from here given both H4 supply at 1.0670-1.0639 (located deep within the above noted daily supply) is looking incredibly weak, coupled together with what we’ve noted above in bold. The 1.07 handle would be an ideal take-profit target.
As you can probably see, 1.07 sits 10 pips below the aforementioned daily resistance, so we are expecting some sort of a reaction to be seen from this area. Dependent on the time of day and whether the lower-timeframe candles form a sell setup, we may look to sell from this hurdle. A lower-timeframe setup would, in our book, be considered either of the following: a break of demand followed by a retest as supply, a trendline break/retest or simply a collection of well-defined selling wicks around the higher-timeframe sell zone.
In the event that 1.07 is ignored, however, all eyes will then likely be on 1.0796 – a H4 Quasimodo resistance line that’s positioned nearby the tip of a H4 Harmonic (Bat) potential reversal zone at 1.0809. This – coupled with it also being located nearby the long-term weekly trendline resistance highlighted above and the 1.08 handle, makes for a strong place to watch this week for shorts. In addition to this, one may, should a H4 close be seen above 1.07, also want to contemplate taking a long on any retest of 1.07 (we’d advise waiting for a H4 bull candle to form following the retest as a way of confirming buyer intent), targeting the above said H4 Harmonic sell zone.
Data points to consider: FOMC member Dudley speaks at 1.45pm. At 3pm GMT both Treasury Secretary Lew and FOMC member Brainard take the stage.
Levels to watch/live orders:
- Buys: 1..0590/1.06 region ([a H4 bull candle is required here before a trade can be executed] stop loss: ideally beyond the trigger candle). Watch for price to close above the 1.07 handle and then look to trade any retest seen thereafter ([a H4 bull candle is required following the retest before a trade can be executed] stop loss: ideally beyond the trigger candle).
- Sells: 1.07 region ([lower-timeframe confirmation is required here before a trade can be executed] stop loss: depends on where one confirms the zone). 1.08 region ([this is an area where we would consider trading without confirmation] stop loss: 1.0815).
GBP/USD:
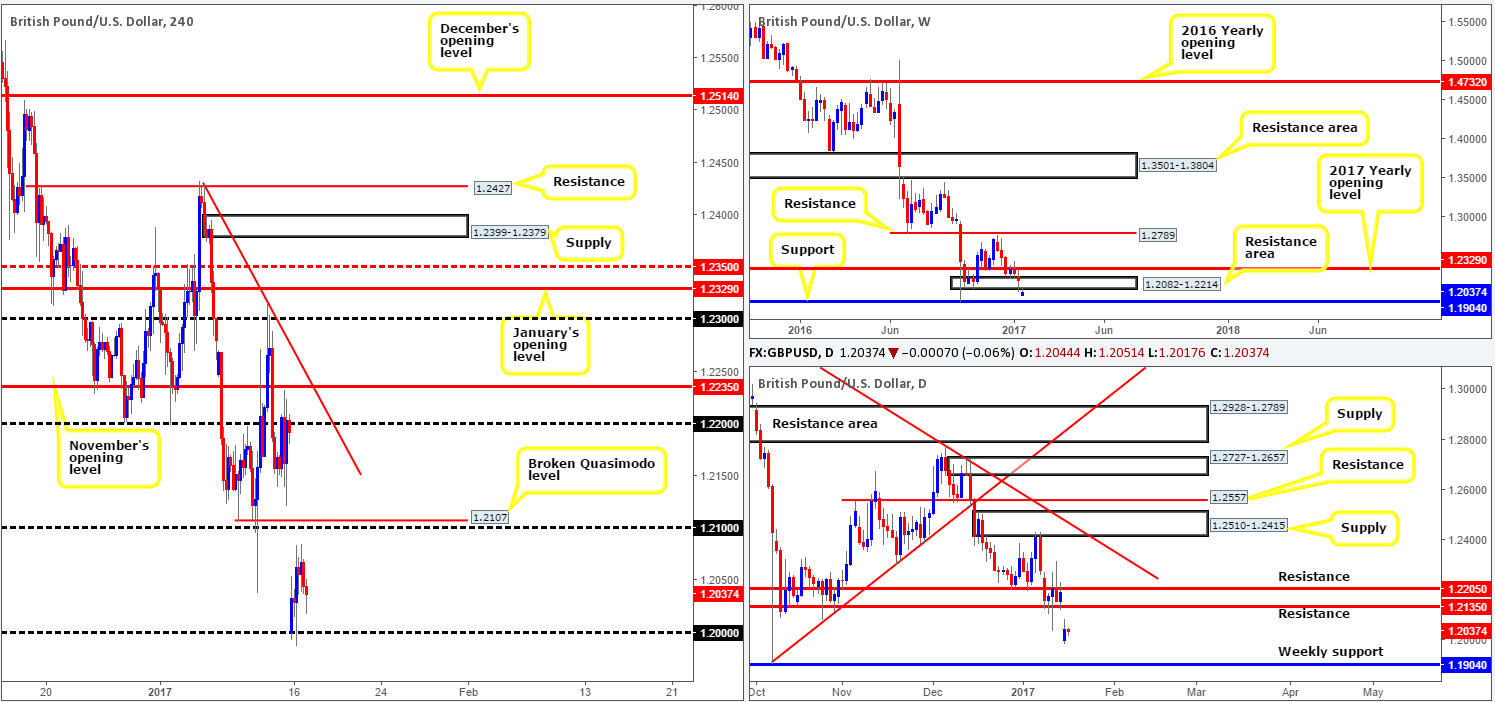
Following Monday’s 200-pip gap to the downside, we can see that the pair partially recovered some of its losses yesterday, reaching highs of 1.2084 on the day. In Monday’s report, the desk commented on the likelihood that this instrument would find a ceiling between the lower edge of the weekly resistance area at 1.2082 and the psychological level 1.21. As anticipated, the marked sold off from this zone nicely, leaving a large part of the weekend gap unfilled, and now looks to be on course to retest the major psychological boundary 1.20.
British Prime Minister Theresa May is due to speak in London today about Brexit, which will, all being well, offer some direction regarding the UK’s position on a ‘hard-Brexit’. This leaves the GBP market in a precarious position as far as trading is concerned. Although mainstream see the pound declining further, choosing a direction today, in our book, would be a rough finger-in-the-wind-assessment.
Our suggestions: In light of upcoming events, we are humbly going to take a back seat today as it could be very messy!
Data points to consider: UK’s CPI reading set for release at 9.30am, British Prime Minister Theresa May is due to speak in London today (tentative). FOMC member Dudley speaks at 1.45pm. At 3pm GMT both Treasury Secretary Lew and FOMC member Brainard take the stage.
Levels to watch/live orders:
- Buys: Flat (stop loss: N/A).
- Sells: Flat (stop loss: N/A).
AUD/USD:
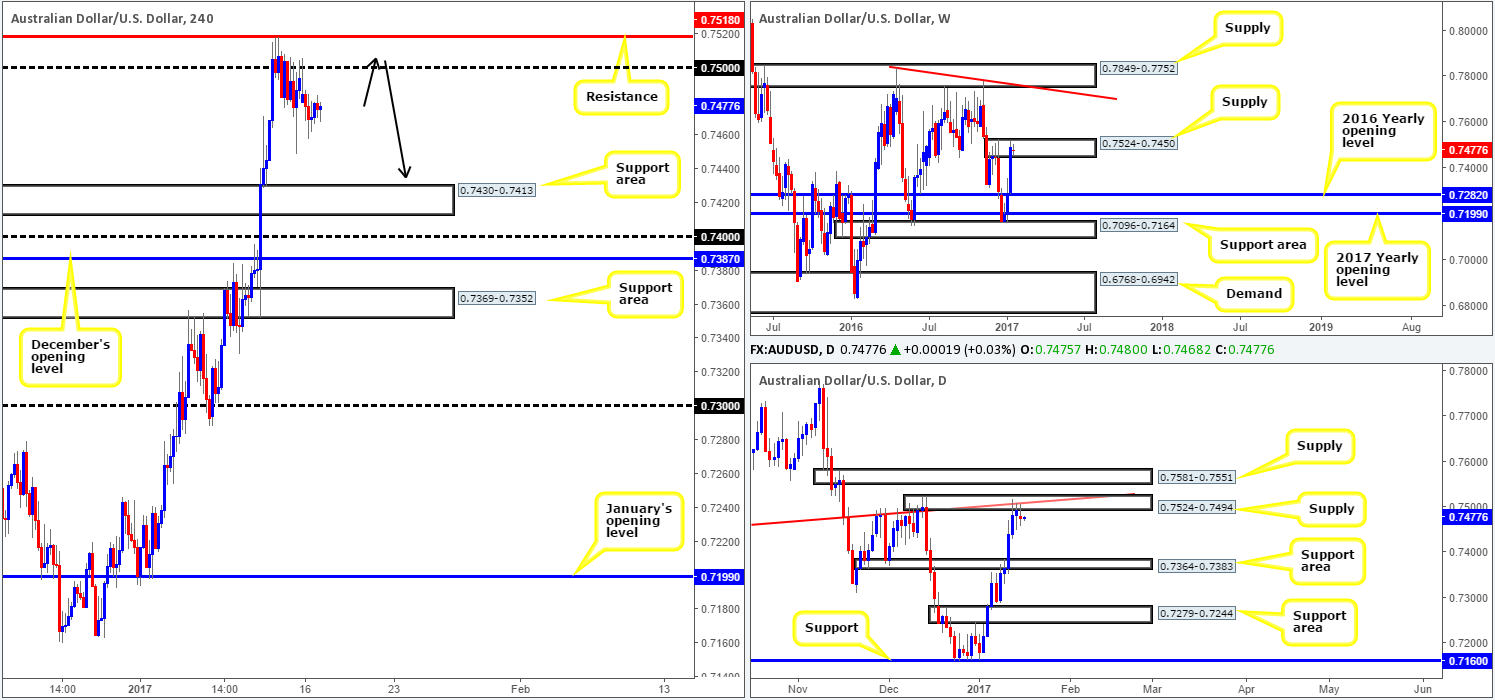
Buoyed by both weekly supply at 0.7524-0.7450 and daily supply at 0.7524-0.7494 (fuses with a daily trendline resistance taken from the low 0.7407), the Aussie daily candle printed its first bearish close in five days, albeit in the form of an indecision candle. According to daily structure, there’s leeway seen for further downside as the next support target comes in at 0.7364-0.7383.
With the above notes in mind, the H4 candles are likely to continue grinding lower from the 0.75 region for the time being. The next downside objective on the H4 scale falls in at 0.7430-0.7413 (a H4 support area), shadowed closely by the 0.74 handle and December’s opening level at 0.7387.
Our suggestions: Right now, despite the market’s structure suggesting further selling may be on the cards, we do not see much on offer at current prices. Should price retest the area comprised of a H4 resistance level at 0.7518 and the 0.75 handle, however, one could attempt to secure a position from this zone be it either by means of a lower-timeframe confirming setup (see the top of this report), or waiting for a H4 bear candle to form.
Data points to consider: FOMC member Dudley speaks at 1.45pm. At 3pm GMT both Treasury Secretary Lew and FOMC member Brainard take the stage.
Levels to watch/live orders:
- Buys: Flat (stop loss: N/A).
- Sells: 0.7518/0.75 ([waiting for confirmation before pulling the trigger here is advised] stop loss: depends on where one confirms the zone).
USD/JPY:
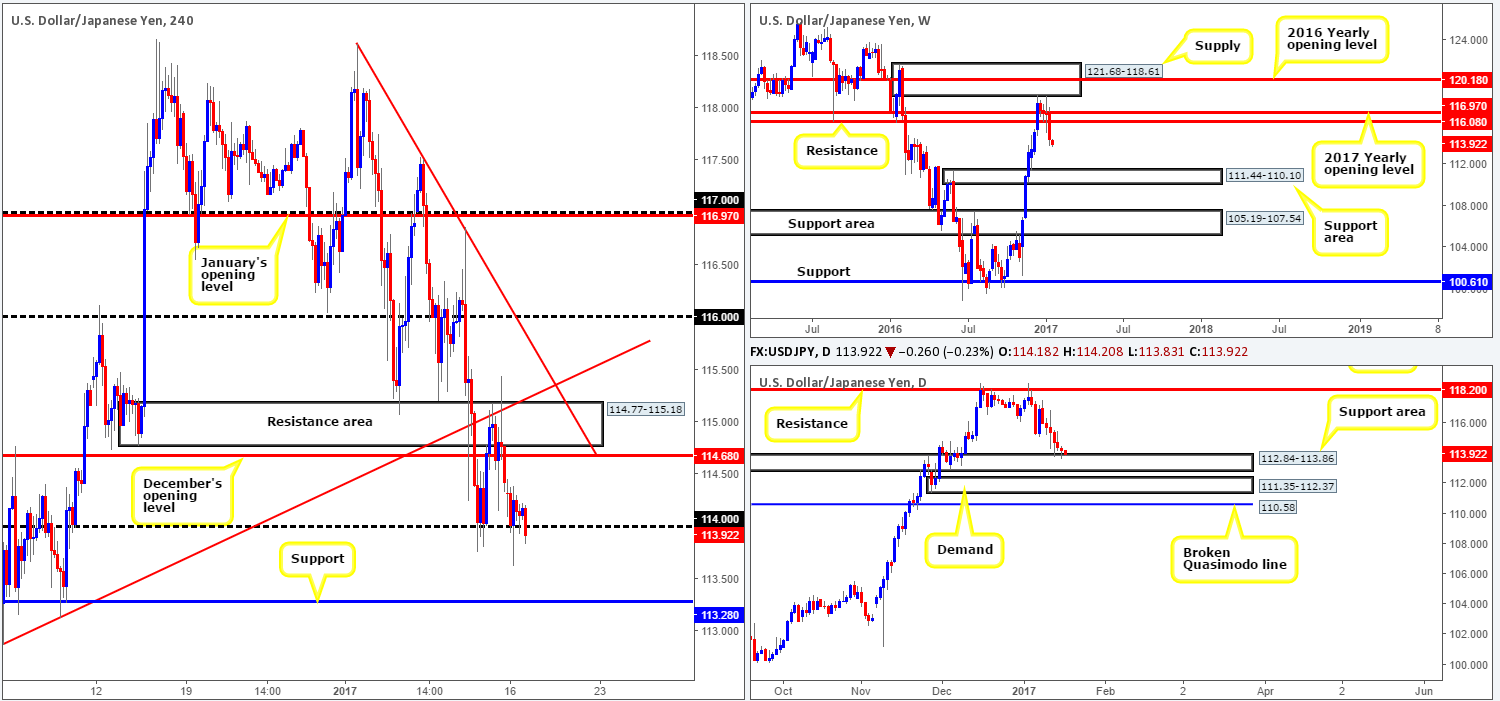
In view of weekly price still trading in bearish territory (following last week’s break through weekly support at 116.08 [now acting resistance]), the pair could, as far as we can see, continue to weaken down to as far as the weekly support area coming in at 111.44-110.10. The flipside to this, of course, is that daily movement recently checked in with a daily support area seen at 112.84-113.86, thus perhaps halting further selling. The response seen from this barrier, nevertheless, has been moderate, with little bullish intent registered thus far.
Over on the H4 chart, nonetheless, the 114 handle (after spending all day yesterday supporting this market) now looks to be on the verge of giving way. While this is considered a bearish signal and potentially opens the doors for price to challenge H4 support seen at 113.28, selling beyond 114 would be risky considering the daily support area currently in play.
Our suggestions: Selling beyond 114 is out of the question for our team, despite weekly structure supporting such a setup. If you still believe a sell beyond 114 is viable, we would strongly advise waiting for price to not only retest the underside of 114 as resistance, but also to wait for a lower timeframe confirming sell setup (see the top of this report) following the retest. This will not guarantee a winning trade, but it will certainly add weight to the setup.
For us, being the conservative traders that we are, we have opted to remain on the sidelines for the time being.
Data points to consider: FOMC member Dudley speaks at 1.45pm. At 3pm GMT both Treasury Secretary Lew and FOMC member Brainard take the stage.
Levels to watch/live orders:
- Buys: Flat (stop loss: N/A).
- Sells: Flat (stop loss: N/A).
USD/CAD:
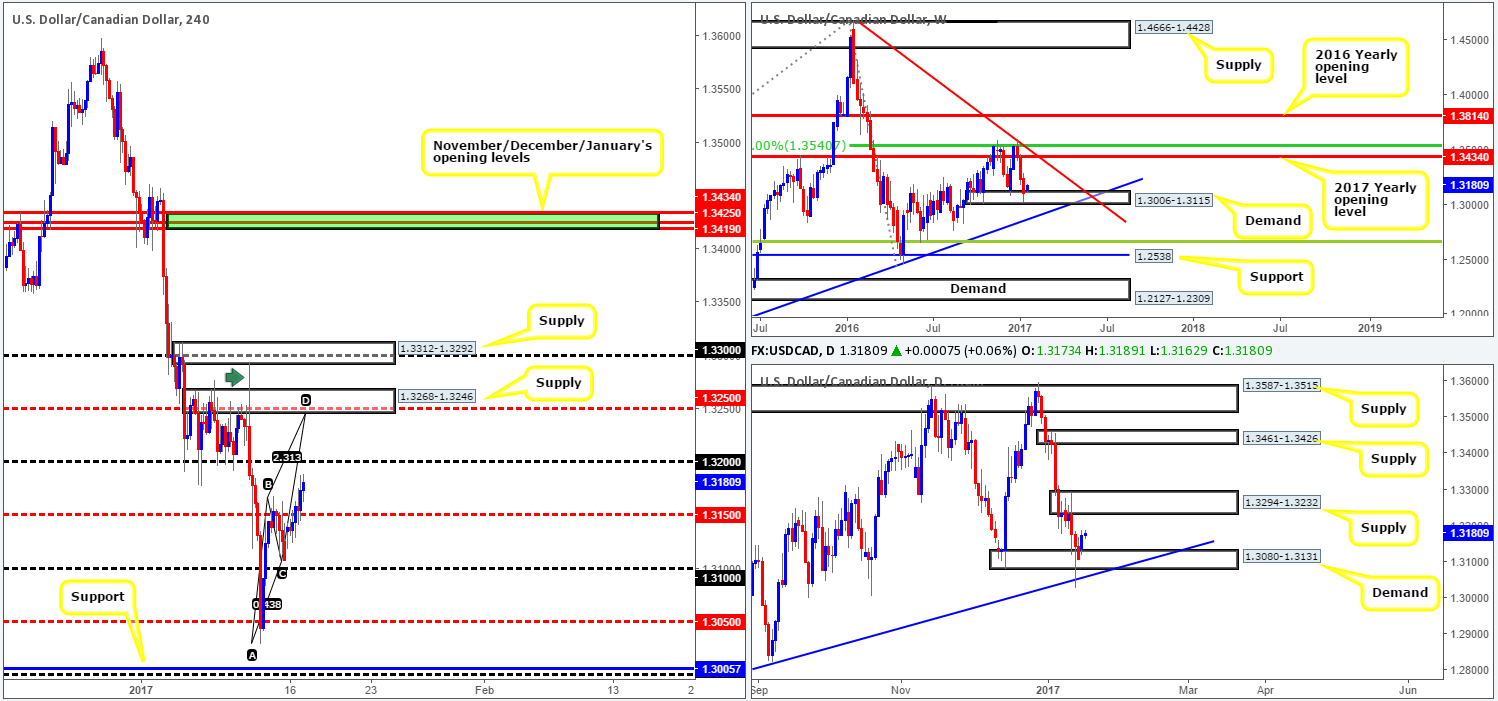
Kicking this morning’s report off with a look at the weekly chart indicates that buyers are beginning to make an appearance within weekly demand at 1.3006-1.3115. The next upside objective from this angle can be seen around the weekly trendline resistance extended from the high 1.4689. In conjunction with the weekly timeframe, price is also beginning to establish support around daily demand at 1.3080-1.3131. Although buying this market may seem a sound idea given weekly price, our team would not feel comfortable entering into any swing trades until the daily supply zone at 1.3294-1.3232 has been consumed.
Recent H4 action, as you can see, munched through offers around the H4 mid-way resistance at 1.3150 and now looks to be heading north towards the 1.32 barrier. While a reaction could be seen from here, the more attractive zone sits above at 1.3268-1.3246: a H4 supply area that blends with both a H4 mid-way resistance at 1.3250 and a H4 AB=CD bearish pattern taken from the low 1.3029.
Our suggestions: A short from the current H4 supply area is valid, in our opinion, due to the confluence surrounding the zone. However, as we saw back on the 11th Jan (green arrow), a fakeout through this area to the nearby H4 supply above at 1.3312-1.3292 is a possibility. Furthermore, let’s also not forget that by selling here you’re effectively shorting into weekly flow (see above). For that reason, the only way our team would be able to secure a green light to sell here is by pinning down a lower-timeframe confirming setup (see the top of this report). Should this come to fruition, the first take-profit target would be set at 1.32.
Data points to consider: FOMC member Dudley speaks at 1.45pm. At 3pm GMT both Treasury Secretary Lew and FOMC member Brainard take the stage.
Levels to watch/live orders:
- Buys: Flat (stop loss: N/A).
- Sells: 1.3268-1.3246 ([lower-timeframe confirmation is required here before a trade can be executed] stop loss: depends on where one confirms the zone).
USD/CHF:
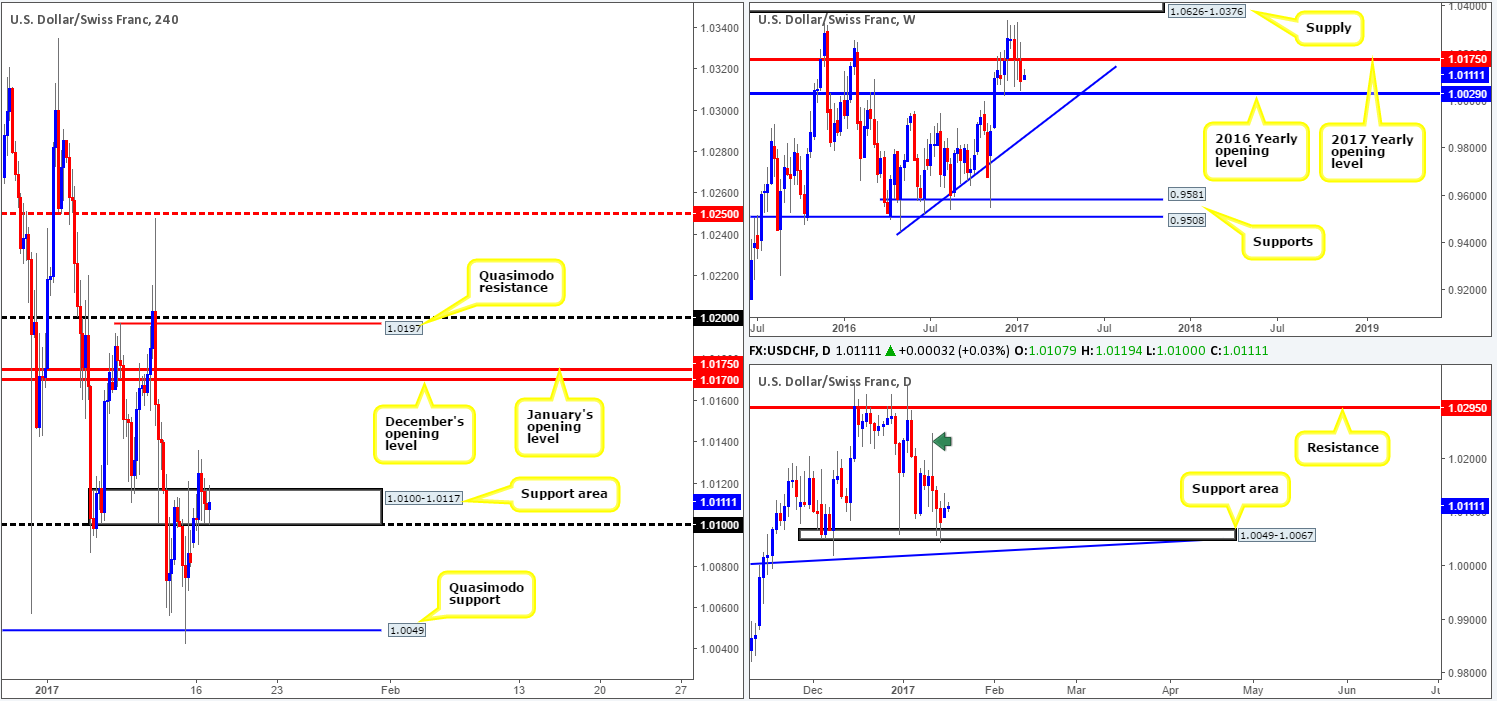
For those who read our previous report on the Swissy you may recall that we were looking for a decisive H4 close above the H4 resistance area carved from 1.0100-1.0117. As shown on the H4 chart, price closed above this zone during yesterday’s London open and is now seen retesting the area as support. We believe that should a reasonably sized H4 bullish close take shape within this area, a long trade from here would be considered valid.
In support of this setup, the daily support area at 1.0049-1.0067 was recently brought into the picture, and is currently seen holding firm. In the event that the bulls remain in the driving seat here, there’s a chance that we may see price tap the daily resistance level coming in at 1.0295 (the daily wick at 1.0248 denotes what we like to call: a supply consumption wick, hence why we believe price could rally as high as 1.0295).
Our suggestions: Put simply, keep an eye out for a reasonably sized H4 bull candle within the current H4 support area. Should this come into view, a long from here with a target objective set around December/January’s opening levels at 1.0175/1.0170 is, in our book, a legit trade call.
Data points to consider: FOMC member Dudley speaks at 1.45pm. At 3pm GMT both Treasury Secretary Lew and FOMC member Brainard take the stage.
Levels to watch/live orders:
- Buys: 1.0100-1.0117 ([a reasonably sized H4 bullish close is required before a trade can be executed] stop loss: ideally beyond the trigger candle).
- Sells: Flat (stop loss: N/A).
DOW 30:
Consequent to US banks being closed in observance of Martin Luther King Day and a relatively light news docket, much of the following report will be similar to Monday’s analysis…
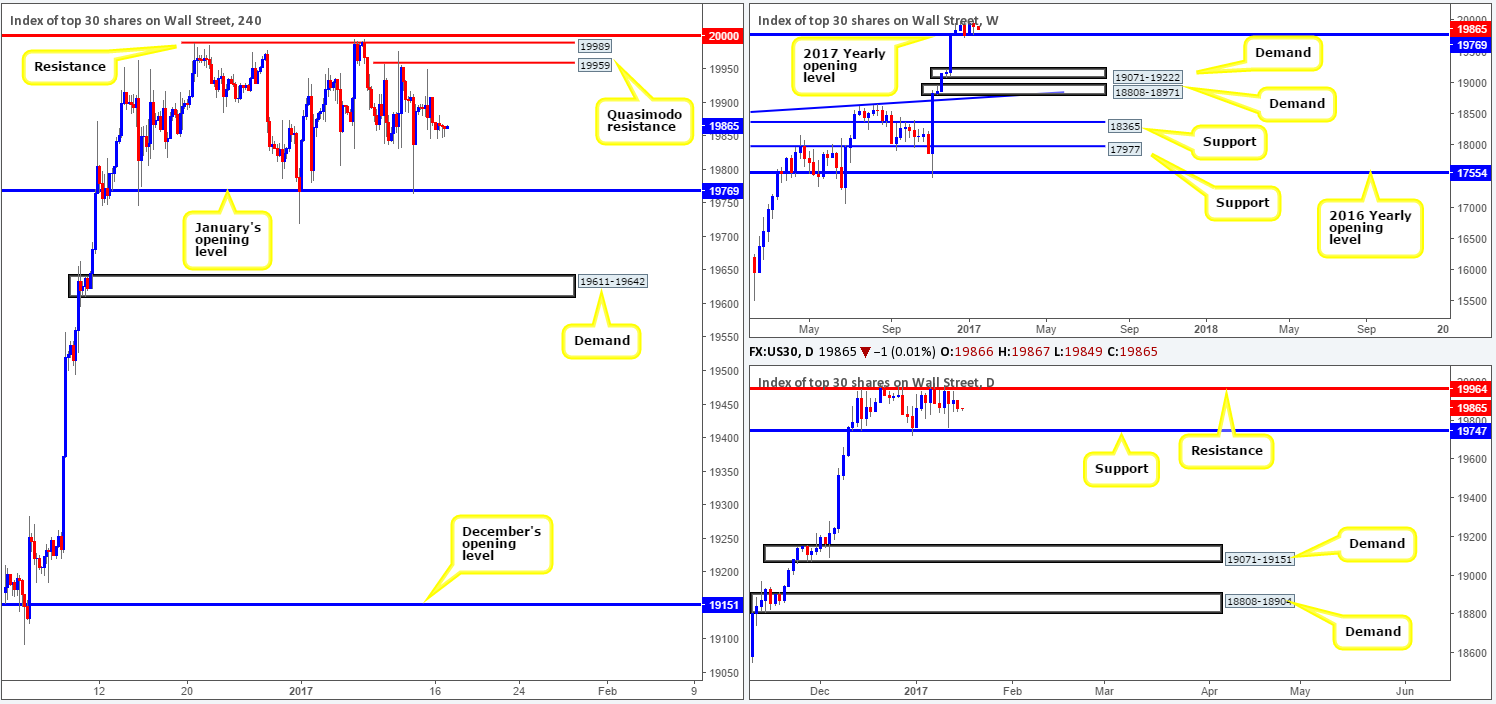
Although the week ended in the red, the DOW’s weekly chart printed a healthy-looking weekly buying tail off the 2017 yearly opening level at 19769. From our perspective, this suggests further buying could be on the horizon this week. Before weekly buyers can push to new highs, nonetheless, they’ll have to break through the top edge of the current daily range at 19964.
Stepping across to the H4 chart, one can see that movement was rather lackluster during yesterday’s session. As such, the next upside targets on this scale remain the same: the H4 Quasimodo resistance level at 19959 and neighboring H4 resistance at 19989. In view of this and the fact that the daily resistance level at 19964 is positioned between the two H4 zones mentioned above, a bearish response from this angle is still expected to be seen. How much of a response is difficult to judge seeing as how the weekly chart shows little resistance on the horizon.
Our suggestions: Despite weekly action effectively being free to rally north, we feel the H4 sell zone: 19989/19959 is worthy of attention. However, pulling the trigger without any supporting lower-timeframe price action is not something we’d be comfortable with (see the top of this report).
Data points to consider: FOMC member Dudley speaks at 1.45pm. At 3pm GMT both Treasury Secretary Lew and FOMC member Brainard take the stage.
Levels to watch/live orders:
- Buys: Flat (stop loss: N/A).
- Sells: 19989/19959 ([lower-timeframe confirmation is required before a trade can be executed] stop loss: depends on where one confirms the zone).
GOLD:
The majority of yesterday’s trading sessions were quiet. US banks were closed in observance of Martin Luther King Day causing the market to thin out. Despite this lack of volatility, the yellow metal did end the day closing above both the H4 resistance at 1202.7 (now acting support) and a daily supply at 1197.4-1187.7 (now an acting demand). From the H4 chart, this could portend further buying up to H4 supply at 1214.8-1211.9, which happens to be glued to the underside of daily supply at 1220.9-1212.0 – the next upside target on the daily timeframe.
In order for this area to be tested, however, the top edge of the weekly resistance area at 1205.6-1181.3 will have to be breached. Granted, the small break required for price to connect with the above noted H4 zone is minimal on the weekly scale!
Our suggestions: Based on recent movement, we feel that the yellow metal is heading north to test H4 supply at 1214.8-1211.9 today. This area, in our opinion, is worthy of attention. Not only because it is associated with daily supply at 1220.9-1212.0, but also because the H4 supply itself boasts strong downside momentum.
With the above points in mind, our team has set a pending sell order at 1211.6 and stop set above at 1215.0. We have purposely given the stop-loss order extra breathing space here due to the supply being relatively small in size.

Levels to watch/live orders:
- Buys: Flat (stop loss: N/A).
- Sells: 1211.6 ([pending order] stop loss: 1215.0).