Waiting for lower timeframe confirmation is our main tool to confirm strength within higher timeframe zones, and has really been the key to our trading success. It takes a little time to understand the subtle nuances, however, as each trade is never the same, but once you master the rhythm so to speak, you will be saved from countless unnecessary losing trades. The following is a list of what we look for:
- A break/retest of supply or demand dependent on which way you’re trading.
- A trendline break/retest.
- Buying/selling tails/wicks – essentially we look for a cluster of very obvious spikes off of lower timeframe support and resistance levels within the higher timeframe zone.
- Candlestick patterns. We tend to stick with pin bars and engulfing bars as these have proven to be the most effective.
We typically search for lower-timeframe confirmation between the M15 and H1 timeframes, since most of our higher-timeframe areas begin with the H4. Stops are usually placed 1-3 pips beyond confirming structures.
EUR/USD:
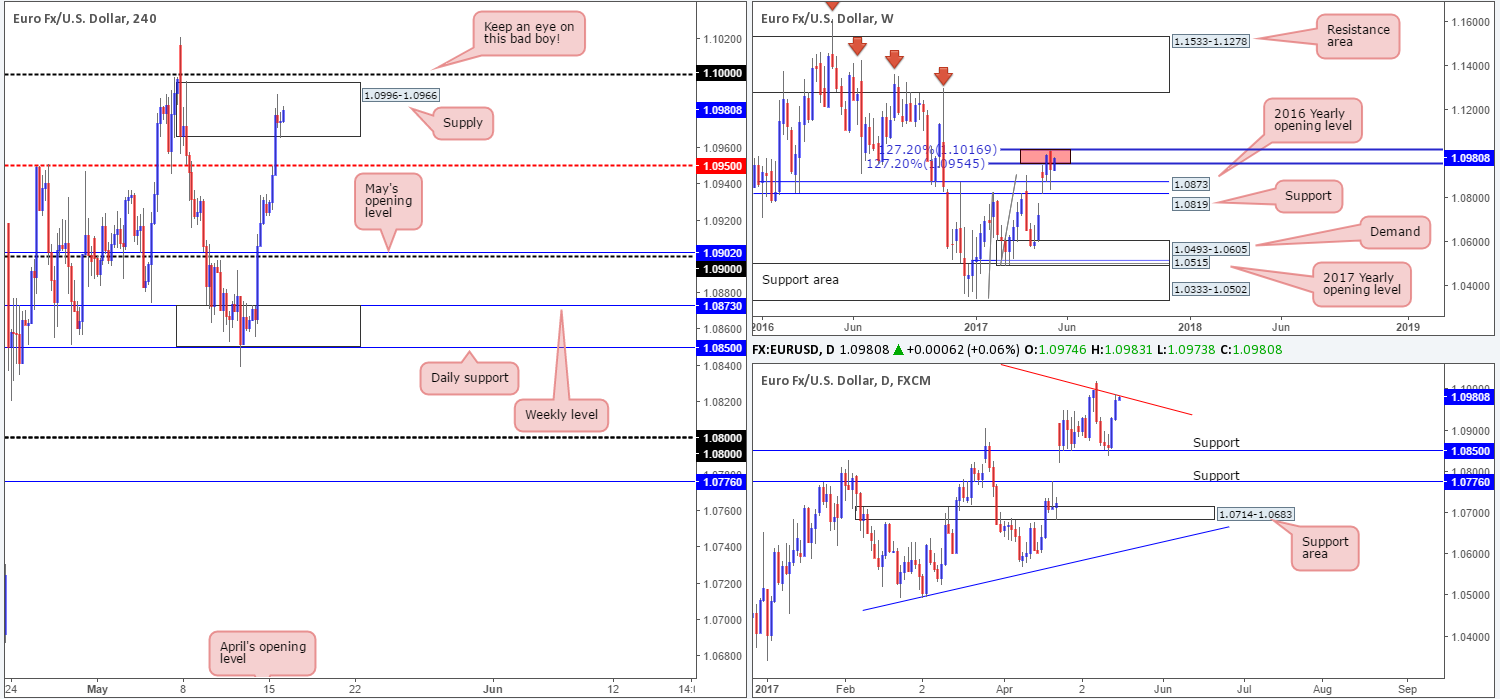
The US dollar, as you can see, continued to sag against the EUR during Monday’s trade. The H4 candles easily cleared the mid-level hurdle 1.0950, and are now seen flirting with supply coming in at 1.0996-1.0966. While the bears have registered some interest within this boundary, we feel the large psychological handle 1.10 is far superior. Apart from this number likely being watched by the majority of the market, it not only sits within the upper limits of two weekly 127.2% Fib extensions at 1.1016/1.0954 (red zone) taken from the lows 1.0340/1.0493, it also converges closely with a daily trendline resistance extended from the high 1.1616.
Our suggestions: Since 1.10 was recently tested; it could very well have been weakened. For that reason, waiting for a reasonably sized H4 bearish rotation candle to form (preferably a full-bodied candle) is recommended before pulling the trigger. Should this idea come to fruition, we’d be looking to reduce risk to breakeven around the 1.0950ish region, and look to liquidate 50% of our position. 1.09 would likely be our final destination given how closely it’s connected with the 2016 yearly opening level at 1.0873 (see weekly chart).
Data points to consider: EUR Flash GDP and German ZEW economic sentiment at 10am. US housing data at 1.30pm GMT+1.
Levels to watch/live orders:
- Buys: Flat (stop loss: N/A).
- Sells: 1.10 ([waiting for a reasonably sized H4 bear candle, preferably a full-bodied candle, to form before pulling the trigger is advised] stop loss: ideally beyond the candle’s wick).
GBP/USD:
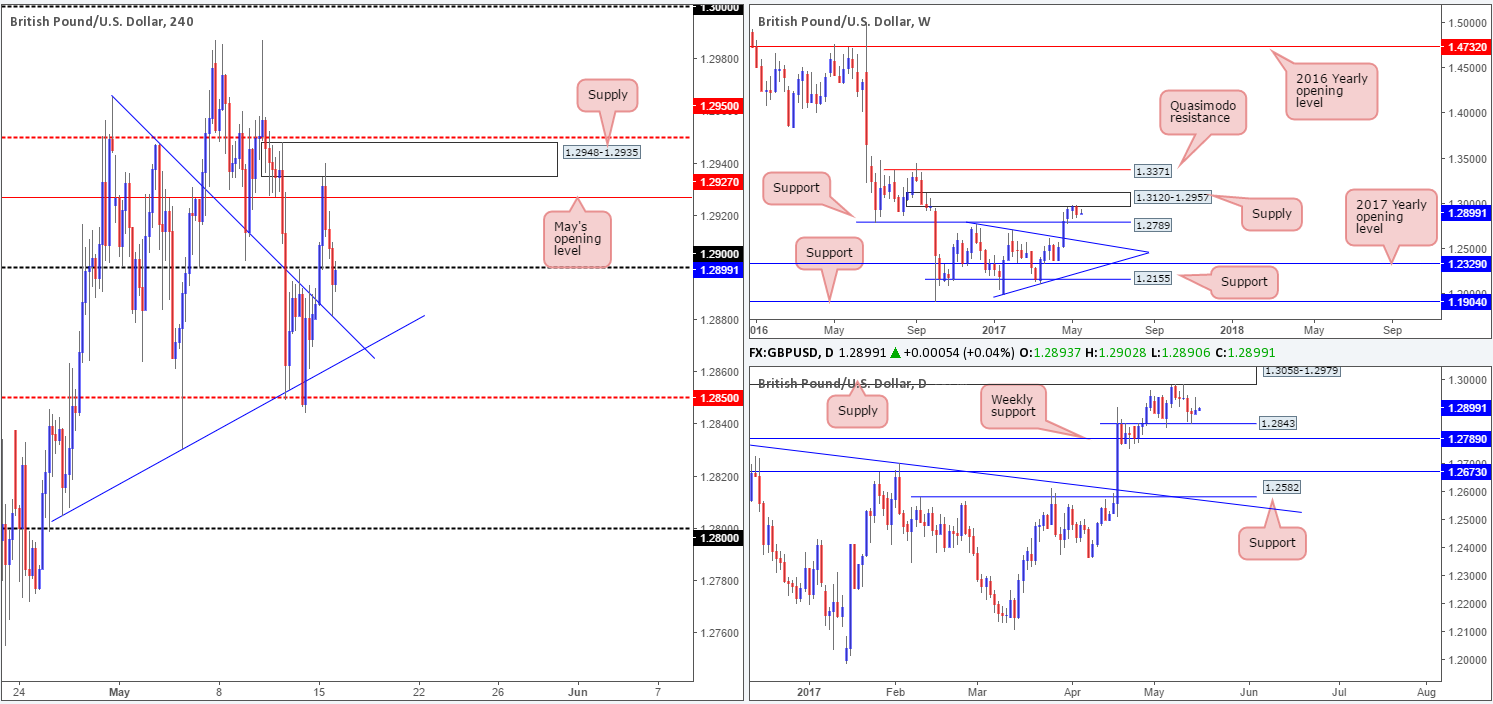
During the course of yesterday’s sessions, we saw the GBP push higher in early trading. The H4 candles whipsawed through May’s opening level at 1.2970 and connected beautifully with supply penciled in at 1.2948-1.2935. It was here that upside momentum began to diminish, forcing the unit to end the day closing back below the 1.29 handle and test a trendline support taken from the high 1.2965.
Over on the bigger picture, weekly action is currently lurking mid-range between supply at 1.3120-1.2957 and support marked at 1.2789. Meanwhile, daily price, after printing a rather substantial selling wick yesterday, is seen hovering above support at 1.2843.
Our suggestions: As far as H4 structure is concerned right now, we’re somewhat restricted by the current H4 trendline support and the 1.29 handle. However, we still feel downside is the more favored route this morning. Given the response seen at weekly supply last week and daily price showing room to drive down to at least 1.2843, the H4 mid-level hurdle at 1.2850 will likely be the next barrier on the hit list.
At the time of writing, our team’s focus remains on looking for a decisive H4 close beyond 1.2850/H4 trendline support. A close beyond this angle, followed with a retest as well as a lower-timeframe sell signal (see the top of this report for ideas on how to use the lower timeframes for entry) would, in our opinion, be enough confirmation to sell (intraday), targeting the 1.28 neighborhood (sits just above the aforementioned weekly support level).
Data points to consider: UK Inflation data at 9.30am. US housing data at 1.30pm GMT+1.
Levels to watch/live orders:
- Buys: Flat (stop loss: N/A).
- Sells: Watch for H4 price to engulf 1.2850 and then look to trade any retest seen thereafter ([waiting for a lower-timeframe sell signal to form following the retest is advised] stop loss: dependent on where one confirms this level).
AUD/USD:
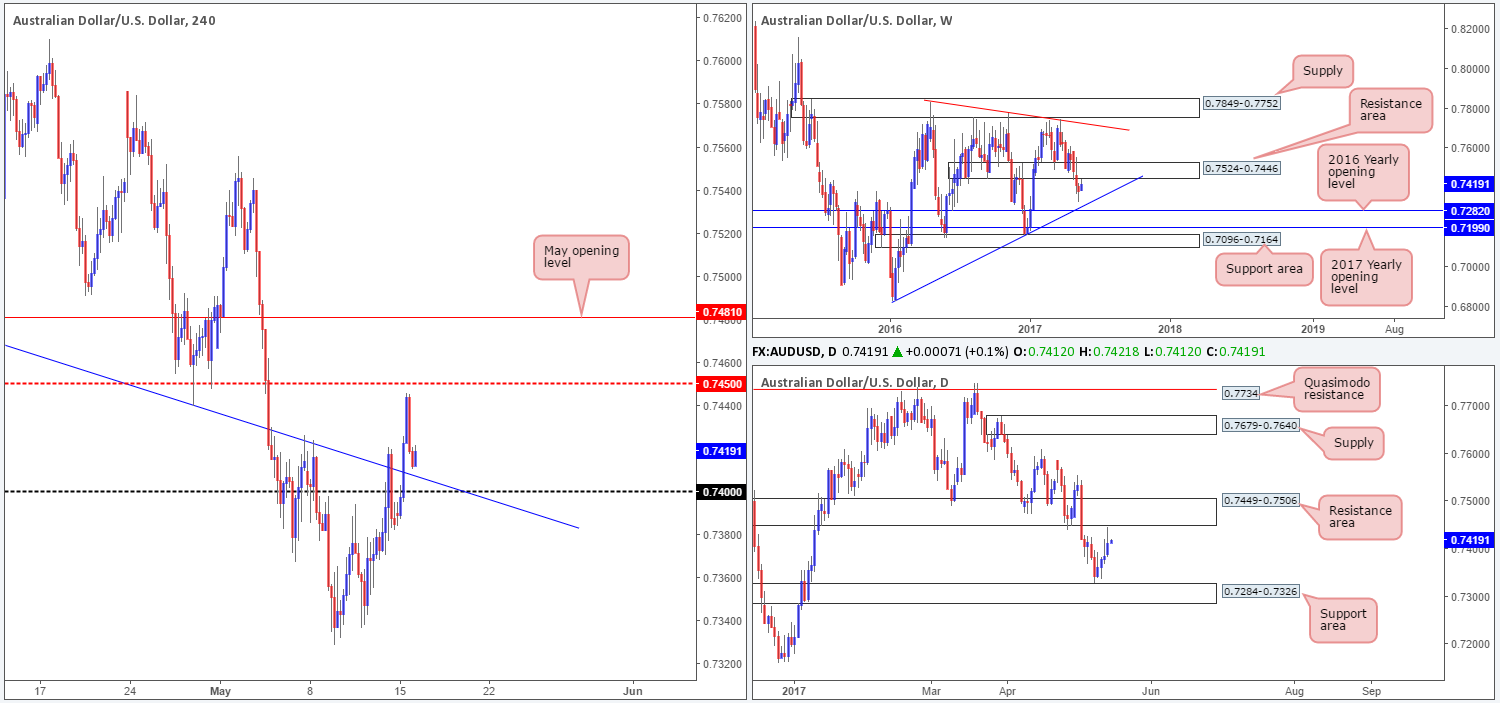
In recent trading, the Aussie H4 candles aggressively advanced higher and convincingly wiped out the trendline resistance extended from the low 0.7475. While this is considered a bullish cue on this scale, it’s advised to remain cognizant of the overall picture here. The weekly timeframe shows price recently touched base with the underside of a resistance area at 0.7524-0.7446, which has been in motion since mid-2016. In addition to this, the daily timeframe also reveals that price came within touching distance of a resistance area at 0.7449-0.7506: essentially the same zone as the weekly area.
Our suggestions: Entering long on a retest of the current H4 trendline is attractive – even more so considering that it converges closely with the 0.74 handle. However, as tempting as this may be, we would feel incredibly uncomfortable buying this market knowing that we are trading nearby two higher-timeframe resistance areas, and, not to mention, that the overall momentum of this market has been southbound since Feb 2017. So, right now, we are more than happy to sit on the sidelines today.
Data points to consider: Australian Monetary policy meeting minutes at 2.30am. US housing data at 1.30pm GMT+1.
Levels to watch/live orders:
- Buys: Flat (stop loss: N/A).
- Sells: Flat (stop loss: N/A).
USD/JPY:
Kicking this morning’s report off with a look-see at the weekly timeframe, we can see that the candles are currently kissing the underside of a supply zone drawn from 115.50-113.85. Should this area hold firm, the next downside target, apart from the weekly low of 108.13, is the support area coming in at 105.19-107.54. Daily price on the other hand, shows that the unit is trading mid-range between a resistance area at 115.62-114.60 and a support area at 111.35-112.37 (holds a 38.2% Fib support at 111.96 marked from the low 108.13).
Over on the H4 chart, price reclaimed the mid-level hurdle 113.50 yesterday and has therefore likely opened up the path north to the 114 handle. 114, in our opinion, could be a zone to watch seeing as how it’s positioned within the walls of the said weekly supply. With that being said however, there’s a chance that the unit may trade beyond this number up to the supply zone at 114.88-114.58, since then we’d have not only the current weekly supply in play, but also the aforementioned daily resistance area as well (the H4 supply is glued to the underside of this daily zone).
Our suggestions: However tempting a short from 114 may be, we favor the H4 supply seen above it at 114.88-114.58 for shorts this week for reasons stated above in bold.
Data points to consider: US housing data at 1.30pm GMT+1.

Levels to watch/live orders:
- Buys: Flat (stop loss: N/A).
- Sells: 114.88-114.58 ([given the higher-timeframe confluence surrounding this zone, a trade from here without additional confirmation is valid] stop loss: 114.90).
USD/CAD:
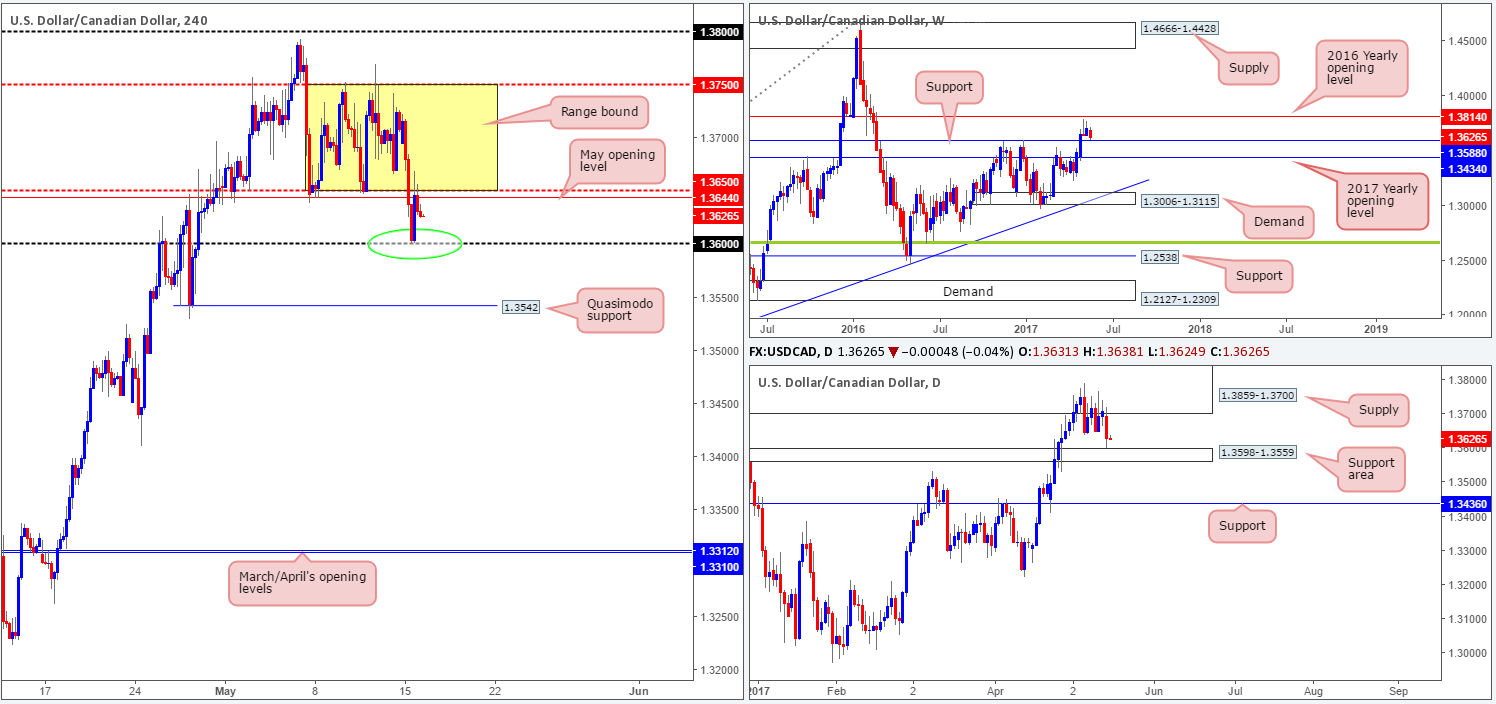
The ongoing rally seen over in the oil market has forced the USD/CAD to break below the current H4 range between 1.3750/1.3650 and come within a few pips of the 1.36 handle. As highlighted in Monday’s report, 1.36 was extremely attractive for longs considering that it merged closely with the top edge of a daily support area at 1.3598-1.3559 and nearby weekly support coming in at 1.3588. Well done to any of our readers who managed to net some green pips here!
The bounce from 1.36, however, is struggling to expand. Not only do we have the underside of the current H4 range in motion at 1.3650, we also have May’s opening level at 1.3644. While we’re reasonably confident that the H4 candles will eventually push back into the aforementioned range, it might not occur before seeing a deeper (fakeout) retest of 1.36. This would, of course, firmly bring the higher-timeframe supports into the action!
Our suggestions: Watch for H4 price to aggressively test the 1.36 boundary. A whipsaw of this number would be ideal! This would likely force H4 price back into the current range, and with a little bit of luck, touch the upper edge of the consolidation. Thus, the risk/reward here is rather attractive!
Data points to consider: US housing data at 1.30pm GMT+1.
Levels to watch/live orders:
- Buys: Watch for a fakeout of the 1.36 region (stop loss: ideally beyond the rejection candle’s tail).
- Sells: Flat (stop loss: N/A).
USD/CHF:
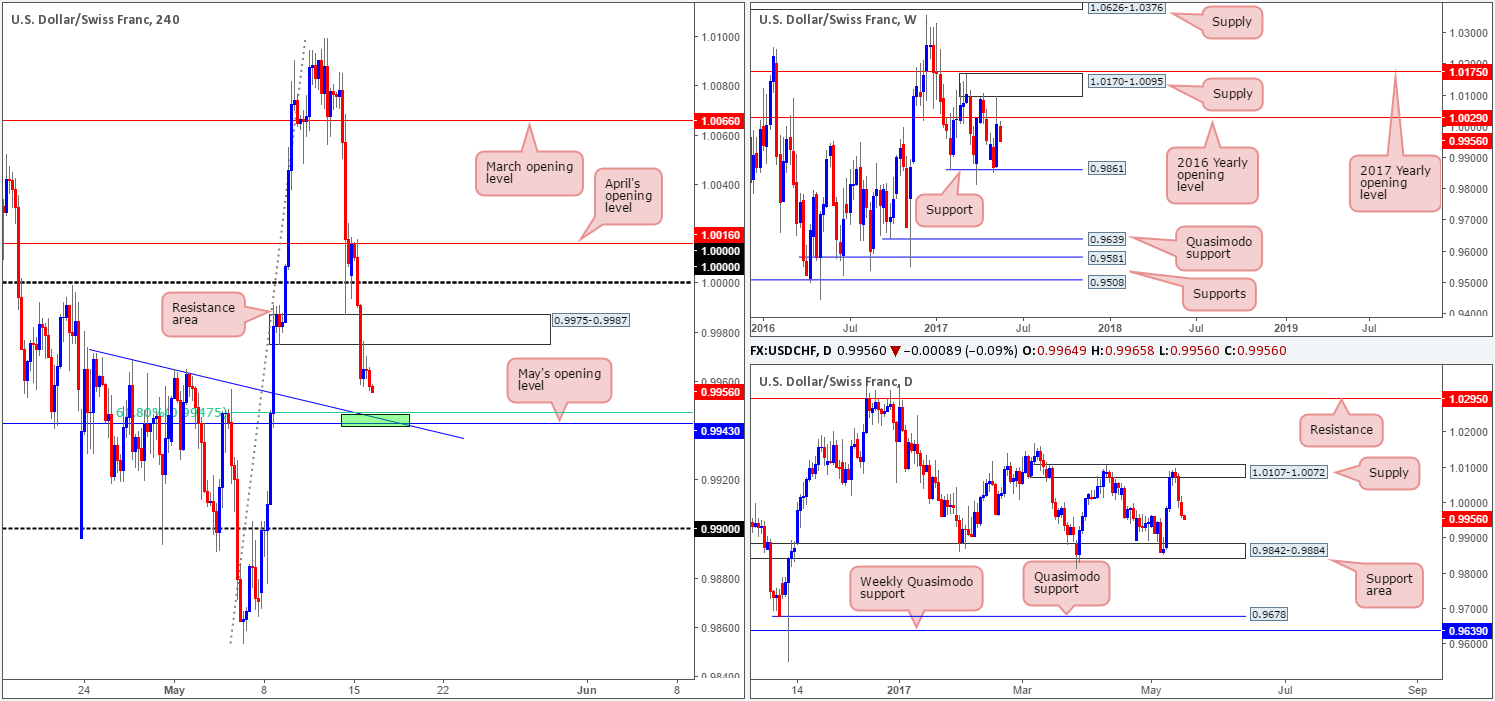
With the EUR/USD recently clocking fresh highs, it was of no surprise to see the Swissy trading lower this morning. Parity (1.0000) did initially hold as support in the early hours of yesterday’s segment, but gave way after H4 price failed to sustain gains beyond April’s opening level at 1.0016. This, as you can see, found price breaking through demand at 0.9975-0.9987 and opening up downside to May’s opening level at 0.9943 (merges with a trendline support taken from this high 0.9974 and a H4 61.8% Fib support at 0.9947 etched from the low 0.9853).
Both the weekly and daily charts show that further downside is likely upon us. The next downside hurdle in line is the daily support area coming in at 0.9842-0.9884, which happens to house weekly support at 0.9861 within its boundaries. Unfortunately, we missed the retest of the recently broken H4 demand, which was something our desk noted to keep an eye on!
Our suggestions: While we’re expecting H4 price to bounce from the 0.9943 neighborhood today (green zone), we do not expect much more than an intraday move, since let’s not forget that the higher timeframes indicate lower prices are likely. So, therefore, one could look to play the 0.9943 area today on the basis of the H4 confluence, but be sure to be aggressive with trade management and reduce risk as soon as possible. Personally, we do not see this unit bouncing higher than 0.9975: the underside of the recently broken H4 demand.
In the event that a decisive H4 close beyond the green H4 zone is seen, this would very likely open the runway down to the 0.99 handle, which is positioned a few pips above the said daily support zone! As a result, shorts could be an option should price retest 0.9943 as resistance.
Data points to consider: US housing data at 1.30pm GMT+1.
Levels to watch/live orders:
- Buys: Small bounce from the 0.9943 region is possible ([waiting for a lower-timeframe confirming signal to form is advised [see the top of this report] stop loss: dependent on where one confirms this area).
- Sells: Watch for H4 price to engulf 0.9943 and then look to trade any retest seen thereafter ([waiting for a reasonably sized H4 bearish candle to form following the retest is advised, preferably in the shape of a full-bodied candle] stop loss: ideally beyond the candle’s wick).
DOW 30:
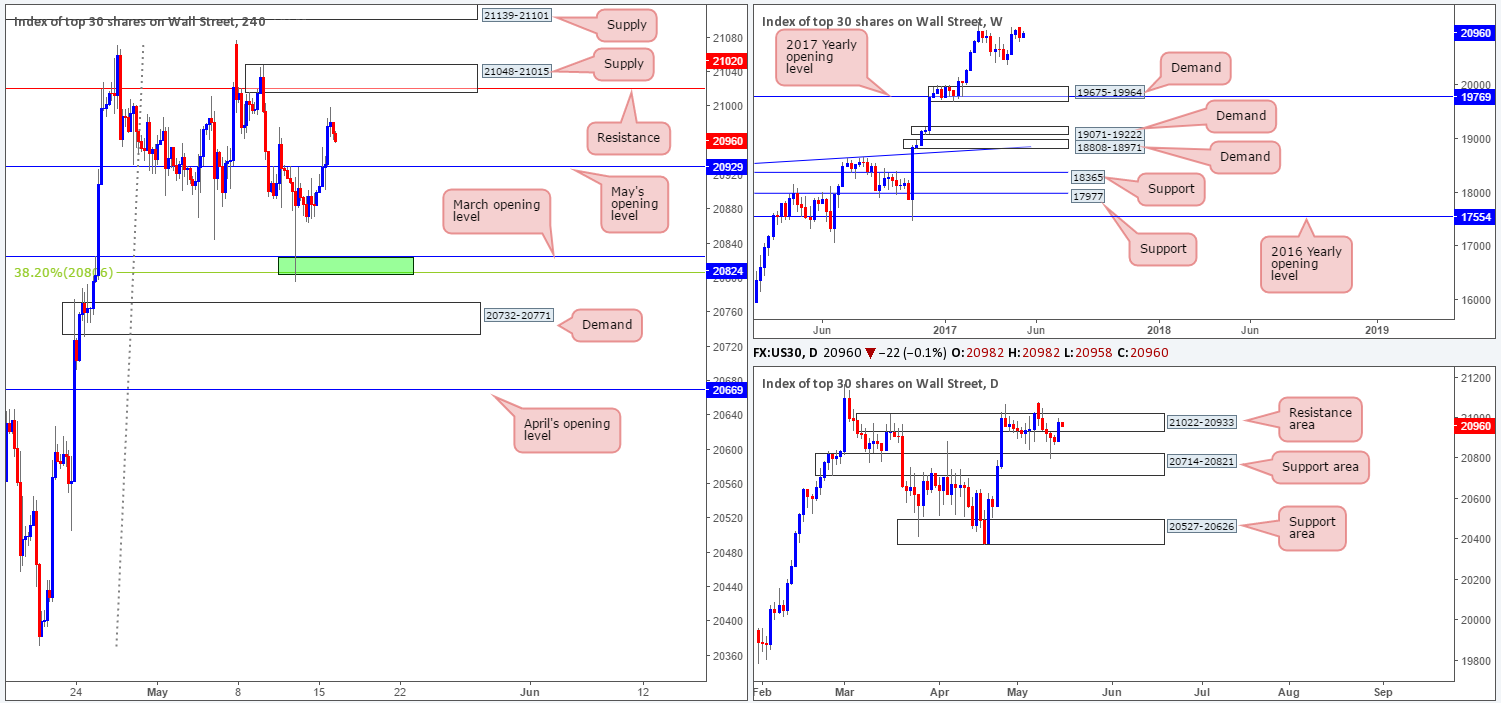
US equities climbed higher during Monday’s segment in response to a rally in financial shares. This brought daily action back up to within the walls of a resistance area formed at 21022-20933. As we explained in Monday’s analysis, this resistance zone, quite simply, looks worn out, as on two occasions we’ve seen the unit surpass its upper boundaries. This – coupled with weekly price showing the index lurking around record highs at 21170, we may eventually see this unit pop higher.
Swinging across to the H4 timeframe, we have May’s opening level seen below at 20929 which may provide support in this market today. To the upside, there’s the supply barrier coming in at 21048-21015 that intersects nicely with resistance at 21020.
Our suggestions: Entering long at May’s opening level, although upside is slightly favored right now, would be dicey. Buying into a daily resistance area, despite the overall trend pointing northbound, is just something we cannot permit. By the same token, shorting at the current H4 supply barrier, although it converges with resistance and is plotted nearby the said daily resistance area, is just too much of a risk for our team given the strength the buyers have shown since the beginning of the year. To that end, opting to stand on the sidelines may be the better path to take today.
Data points to consider: US housing data at 1.30pm GMT+1.
Levels to watch/live orders:
- Buys: Flat (stop loss: N/A).
- Sells: Flat (stop loss: N/A).
GOLD:
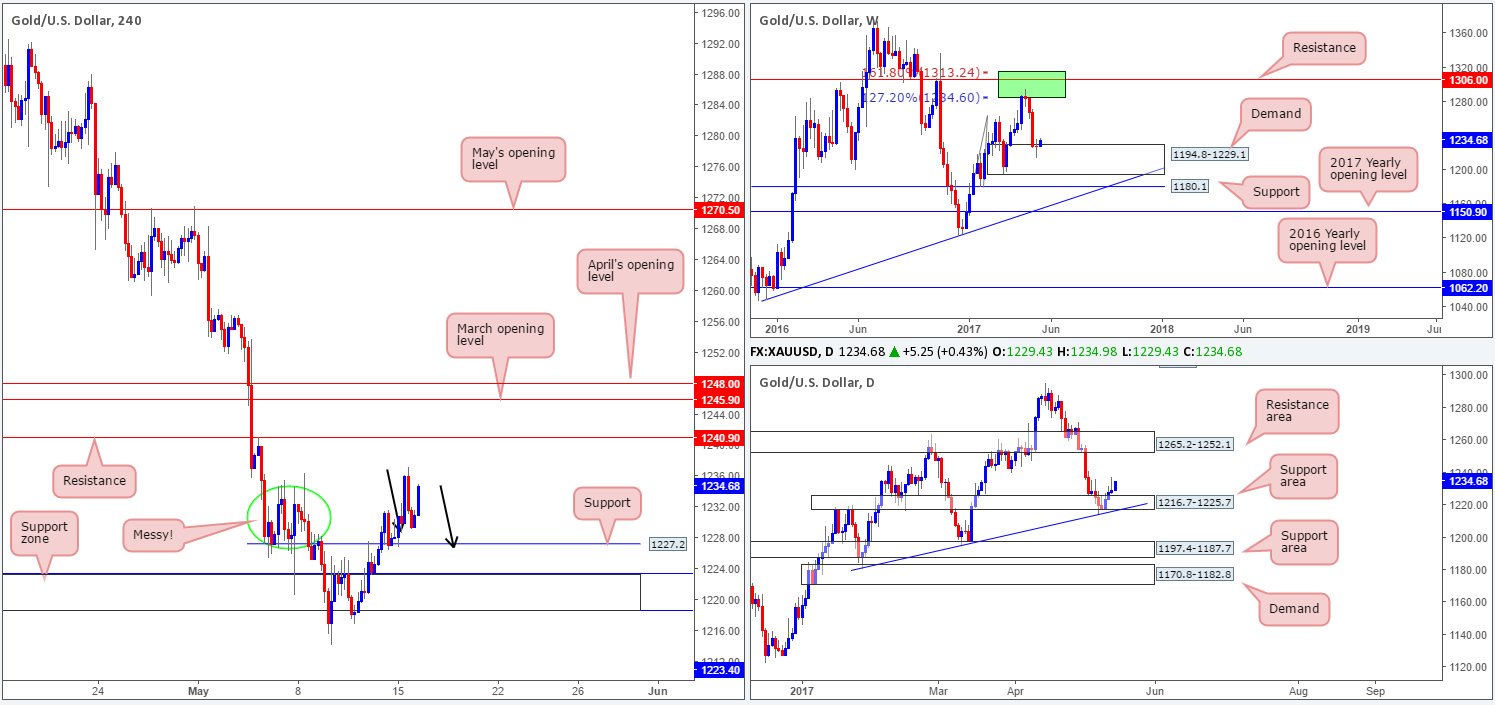
As the dollar continues to pile lower, the yellow metal continues to make headway! H4 price marginally spiked above a rather messy area marked with a green circle at 1236.0/1228.0. This is a fantastic sign for the bulls, since not only is the market trading within a weekly demand pegged at 1194.8-1229.1, it is also trading nicely from a daily support area at 1216.7-1225.7 (strengthened by a trendline support extended from the low 1180.4).
Despite the market advertising bullish strength right now, there’s a cautionary point to consider: the nearby H4 resistance positioned at 1240.9, followed closely by March/May’s opening levels at 1245.9/1248.0.
Our suggestions: Right now, we do not see a strong enough level to base a long from unfortunately. What would be ideal, however, is if the H4 candles printed a 1:1 correction (see black arrows) from current price down to support at 1227.2. A trade from this area would, as long as it was supported by a reasonably sized H4 bull candle (preferably a full-bodied candle), be somewhere our desk would look to go long from and target the above noted H4 resistances.
Levels to watch/live orders:
- Buys: 1227.2 region ([waiting for a reasonably sized H4 bull candle, preferably a full-bodied candle, to form before pulling the trigger is advised] stop loss: ideally beyond the candle’s tail).
- Sells: Flat (stop loss: N/A).


