A note on lower timeframe confirming price action…
Waiting for lower timeframe confirmation is our main tool to confirm strength within higher timeframe zones, andhas really been the key to our trading success. It takes a little time to understand the subtle nuances, however, as each trade is never the same, but once you master the rhythm so to speak, you will be saved from countless unnecessary losing trades. The following is a list of what we look for:
- A break/retest of supply or demand dependent on which way you’re trading.
- A trendline break/retest.
- Buying/selling tails – essentially we look for a cluster of very obvious spikes off of lower timeframe support and resistance levels within the higher timeframe zone.
- Candlestick patterns. We tend to only stick with pin bars and engulfing bars as these have proven to be the most effective.
For us, lower timeframe confirmation starts on the M15 and finishes up on the H1, since most of our higher timeframe areas begin with the H4.
EUR/USD:
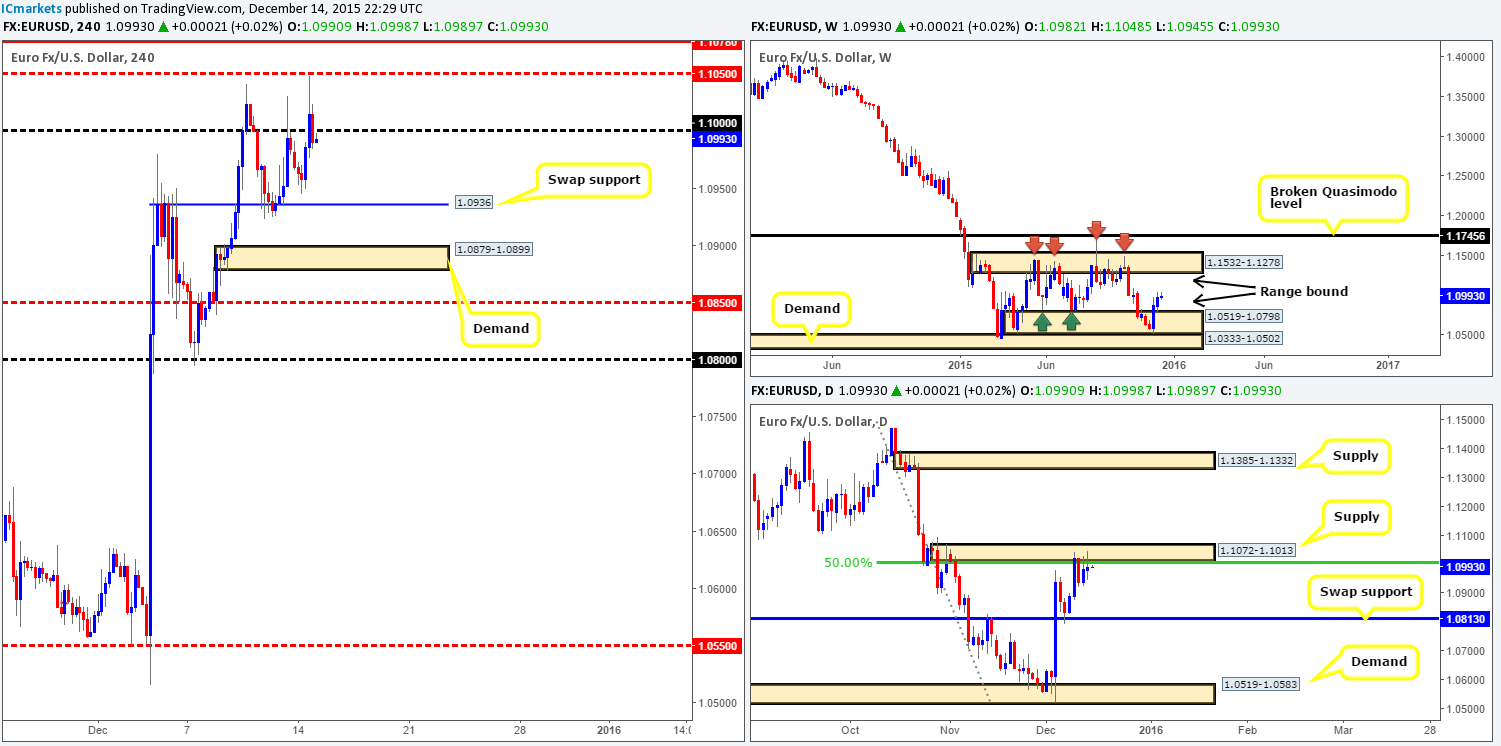
Following the open 1.0982, the single currency saw a mild pullback from Friday’s rebound at psychological resistance 1.1000, reaching lows of 1.0945 by London opening. It was around this time that bids begun stabilizing this market, which, as you can see, eventually whipsawed prices above 1.1000, just missing the mid-level resistance 1.1050 by a pip before retreating back below 1.1000 to end the day.
With weekly action still loitering mid-range between demand at 1.0519-1.0798 and supply drawn from 1.1532-1.1278, and price recently painting an indecision candle at supply taken from 1.1072-1.1013 on the daily chart (converges 50.0% Fibonacci level at 1.1011), where do we go from here?
Well, like we mentioned yesterday, our team has come to a general consensus that buying the EUR medium-term is out of the question unless either a decent break above daily supply is seen, or price connects with the daily swap (support) barrier at 1.0813.Selling medium-term, however, is also something we’re not confident with right now due to the lack of direction being seen on the weekly.
Regarding today’s trade nonetheless, the areas on our radar for intraday (confirmed) bounces are as follows:
Sells:
- Quasimodo resistance seen at 1.1078. This level, dependent on the time of day and the approach, may be good enough to condone a market order.
Buys:
- Swap support at 1.0936.
- Demand at 1.0879-1.0899 (converges nicely with psychological support 1.0900).
Levels to watch/live orders:
- Buys: 1.0936 [Tentative – confirmation required] (Stop loss: dependent on where one confirms this level). 1.0879-1.0899 [Tentative – confirmation required] (Stop loss: dependent on where one confirms this area). 1.0813 [Tentative – confirmation required] (Stop loss: dependent on where one confirms this level).
- Sells:1.1078 [Level looks strong enough to consider entering at market here] (Stop loss: 1.1099).
GBP/USD:
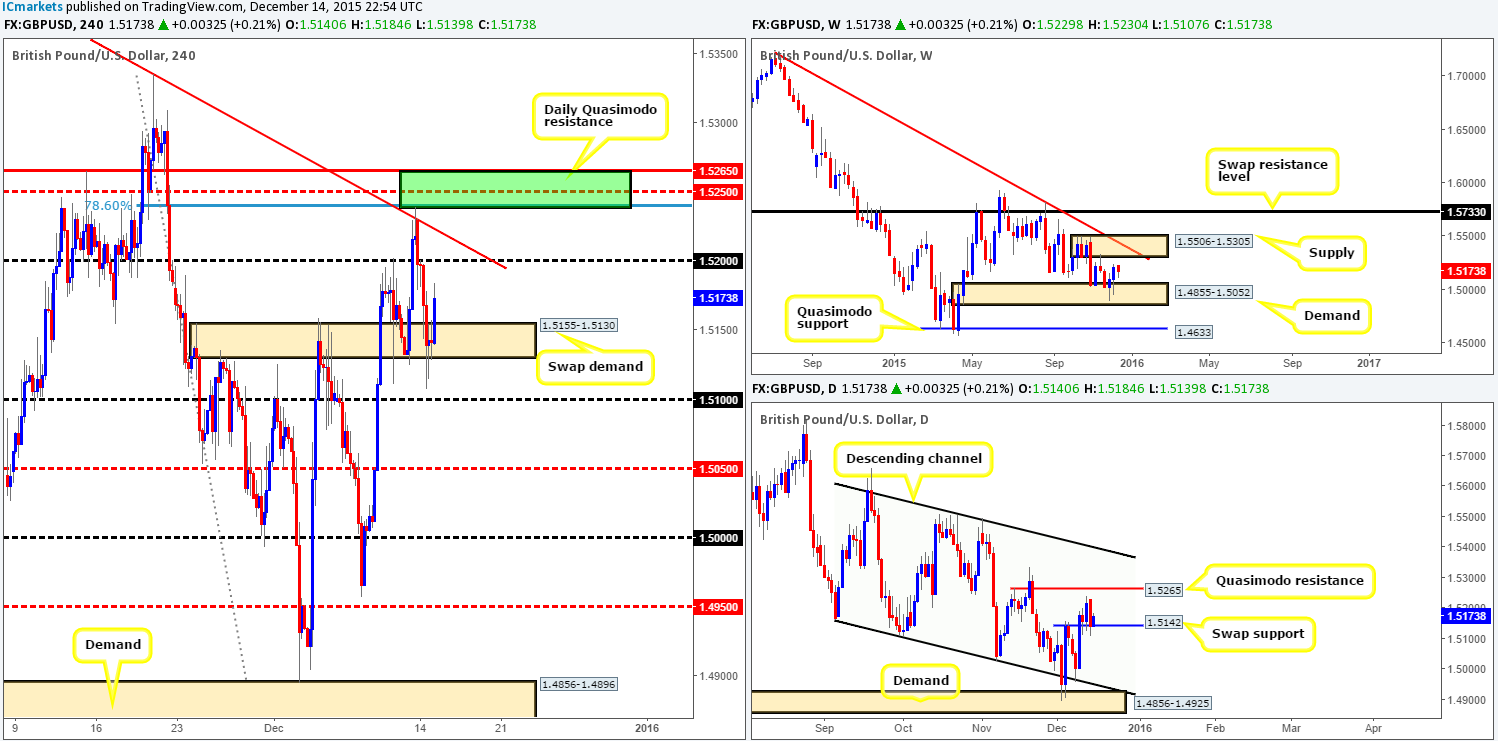
Shortly after the market opened for business, Cable began spiraling south from the underside of a H4 trendline taken from the high 1.5401, which, as you can see, also converges with a deep 78.6% Fibonacci level at 1.5239. This sell-off erased any gains the pair had accrued during Friday’s trade and stabbed violently below the H4 swap demand at 1.5155-1.5130, just missing psychological support 1.5100 by seven pips!
In view of today’s early explosion of bids from within the above said H4 swap demand, price appears to be heading in the direction of 1.5200. Nevertheless, right now, we only have interest in the above sell zone marked in green, which comprises of: the above said 78.6% Fibonacci level, mid-level resistance at 1.5250 and a daily Quasimodo resistance level at 1.5265.
To the downside, however, we have our beady little eye on 1.5100. Stops from the current H4 swap demand base are likely very weak now and 1.5100 has proved itself as a strong support and resistance in the past. Given that this is a fixed level (fakeouts likely), we’ll require lower timeframe confirmation before committing capital to this idea.
Levels to watch/ live orders:
- Buys: 1.5100 [Tentative – confirmation required] (Stop loss: dependent on where one confirms this level).
- Sells: 1.5265/1.5239 [Will consider a market order dependent on the approach and time of day] (Stop loss: will likely be placed around the 1.5270 mark).
AUD/USD:
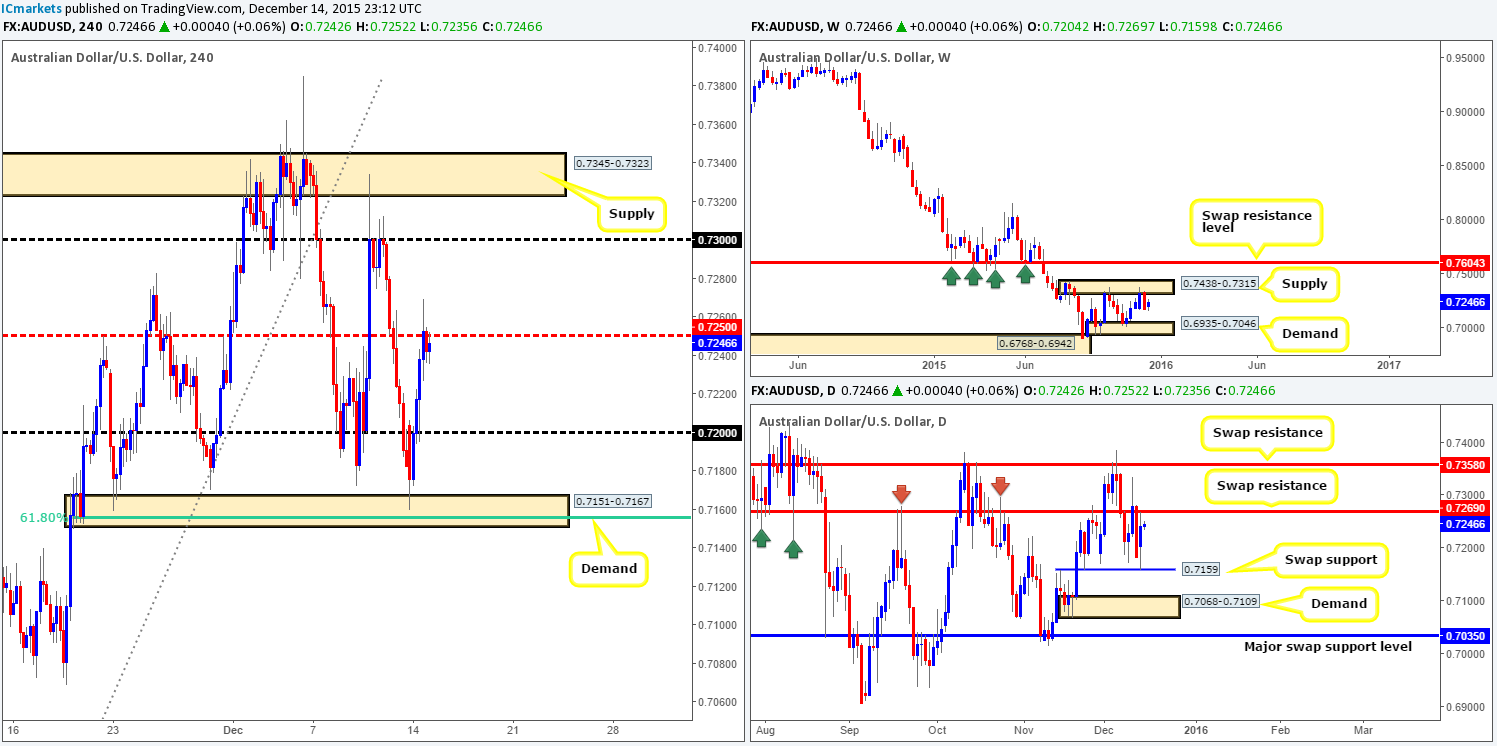
For those who read yesterday’s report (http://www.icmarkets.com/blog/monday-14th-december-weekly-technical-outlook-and-review/), you may recall us showing interest in the H4 demand coming in at 0.7151-0.7167. Not only did this barrier surround a daily swap (support) level at 0.7159, but it also encapsulated the 61.8% Fibonacci level at 0.7154. As you can see, price reacted beautifully to this zone. Unfortunately, however, we were unable to find a lower timeframe setup to enter long here – well done to any of our readers who did!
Now, with price currently being held lower by weekly supply at 0.7438-0.7315, alongside daily action responding to a swap resistance level at 0.7269 and price on the H4 holding below mid-level resistance at 0.7250 at the moment, we are biased to the sell-side of this market.
With this, our team is going to be looking for lower timeframe sell entries around the 0.7250 region today. Assuming that we manage to enter short here, we’ll be eyeing psychological support 0.7200 as our immediate take-profit target, followed closely by the aforementioned H4 demand area.
Levels to watch/ live orders:
- Buys: Flat (Stop loss: N/A).
- Sells: 0.7250 [Tentative – confirmation required] (Stop loss: dependent on where one confirms this level).
USD/JPY:
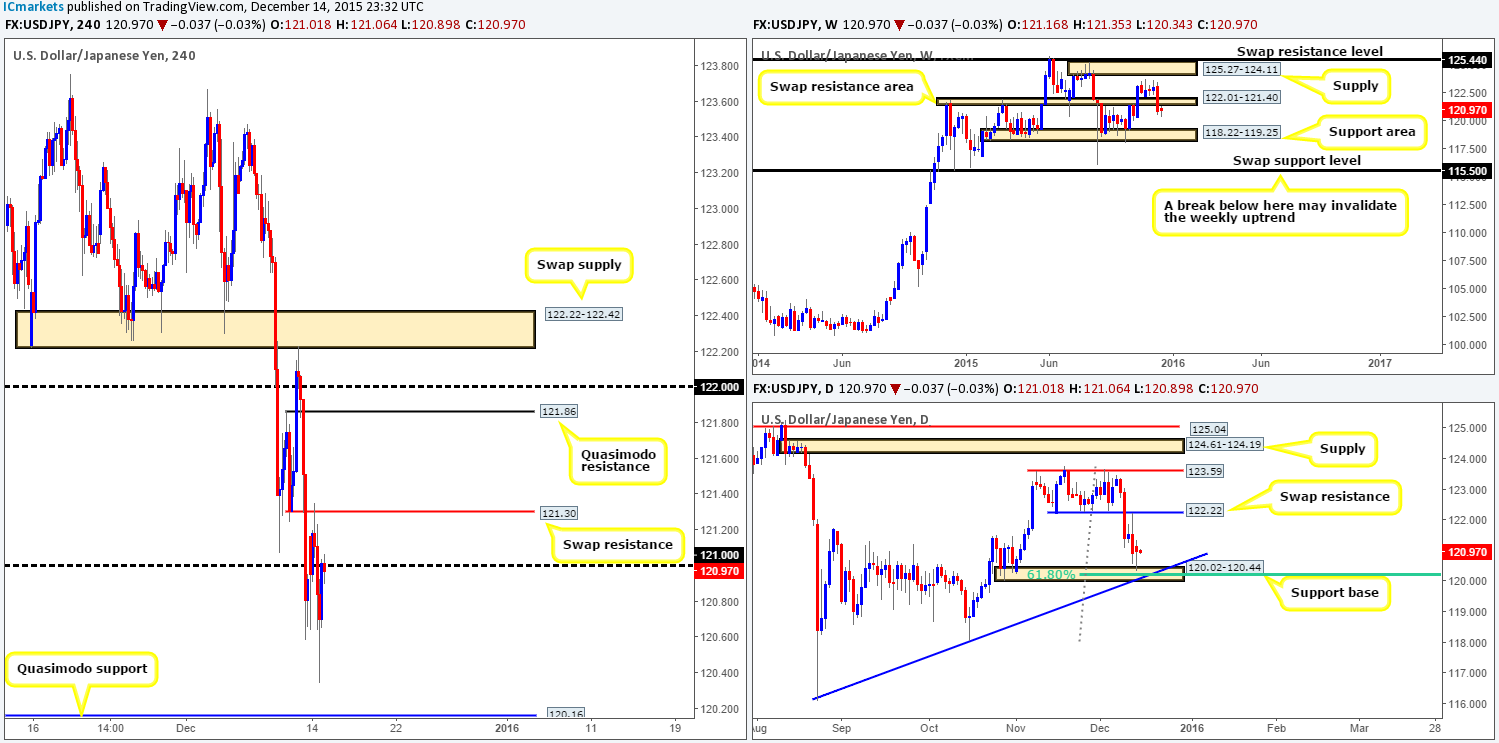
Going into London trade, the USD/JPY pair ran into a strong ceiling of offers at a H4 swap (resistance) level at 121.30, which, as can be seen from the chart, pushed this market aggressively south, reaching lows of 120.34 on the day.
In our previous report (http://www.icmarkets.com/blog/monday-14th-december-weekly-technical-outlook-and-review/), we noted that the daily support area seen at 120.02-120.44 (converges with trendline support taken from the low 116.07 and 61.8% Fibonacci level at 120.24) was a zone to keep an eye on. As we can all see, price reacted beautifully to this area yesterday, pushing the pair back up to psychological resistance 120.00. We did not enter long from the aforementioned daily zone simply because (as explained in our previous analysis) we were looking at the H4 Quasimodo support level lower down at 120.16 (located deep within the daily area itself) to get long.
This pair is now in a very tricky position in our opinion. Weekly action shows price responding to the underside of the recently broken swap support (now resistance) area at 122.01-121.40, whilst as we already know, daily price is reacting from demand. With this clear difference of opinion being seen right now, we’ll likely remain flat throughout today’s trade.
Levels to watch/ live orders:
- Buys: Flat (Stop loss: N/A).
- Sells: Flat (Stop loss: N/A).
USD/CAD:
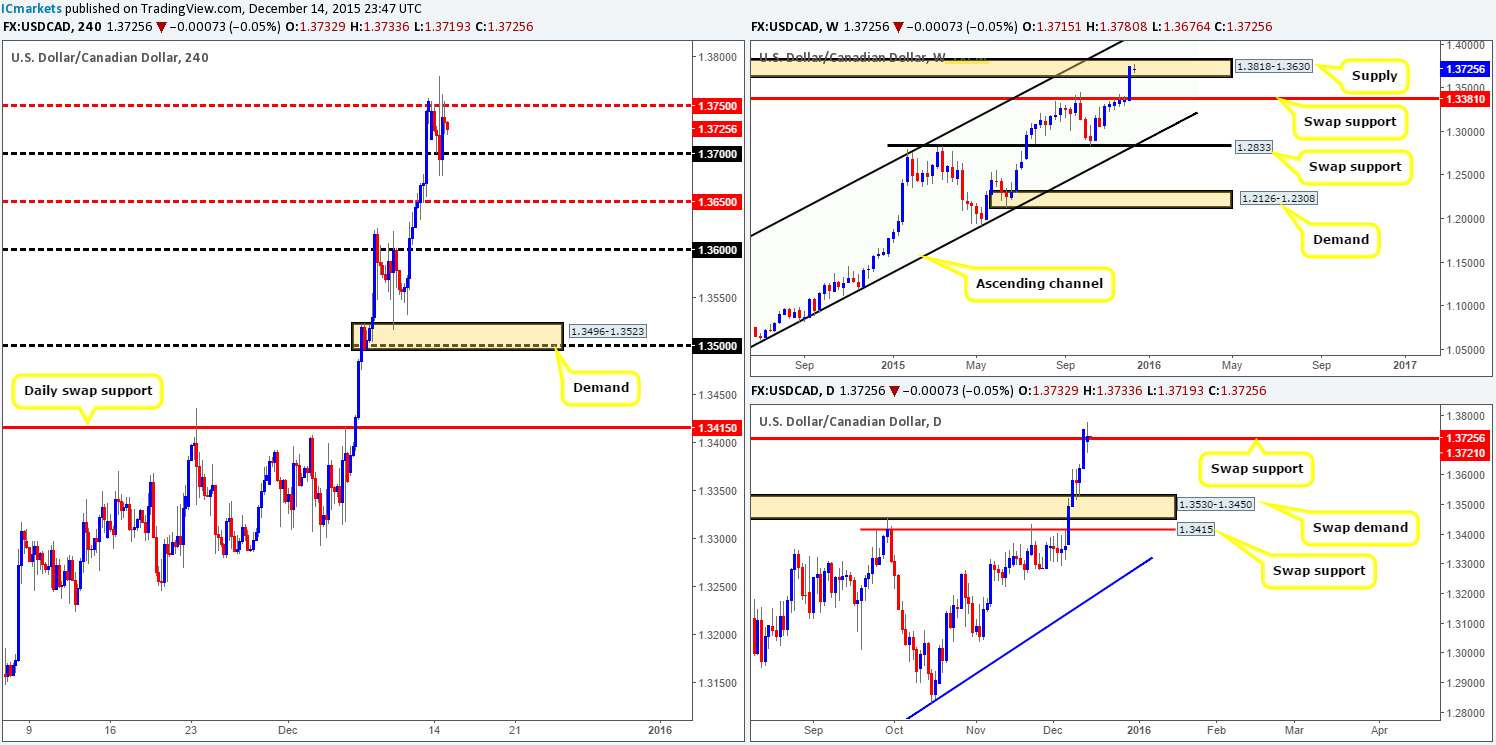
Kicking off this morning’s analysis with a look at the weekly chart shows that price remains trading within the jaws of supply coming in at 1.3818-1.3630. Moving down a notch to the daily chart, we can see that Friday’s close above the swap resistance (now support) at 1.3721 clearly caused uncertainty within this market yesterday, hence the indecision candle. In the event that the buyers are able to keep this pair above here this week, the next upside target to be aware of falls in at supply drawn from 1.4001-1.3904.
Moving down another level to the H4 chart, price is seen confined between psychological support 1.3700 and mid-level resistance 1.3750 right now. Seeing as how this pair is trending extremely strong at the moment, and the fact that price is currently holding above a daily swap (support) barrier (see above), we feel the only logical path for this pair is north! Granted, we cannot ignore that weekly trade is loitering within supply (see above), but one cannot deny that this weekly area has its work cut out for it if it is to halt this current buying frenzy.
With that being said, our team will be looking for 1.3750 to be taken out and retested as support today. This, in turn, will effectively be our cue to begin hunting for lower timeframe buy setups into this market. Should the above come to fruition, psychological resistance 1.3800 is the next obvious target.
Levels to watch/ live orders:
- Buys: Watch for offers to be consumed around 1.3750 and then look to trade any retest seen at this level (confirmation required).
- Sells: Flat (Stop loss: N/A).
USD/CHF:
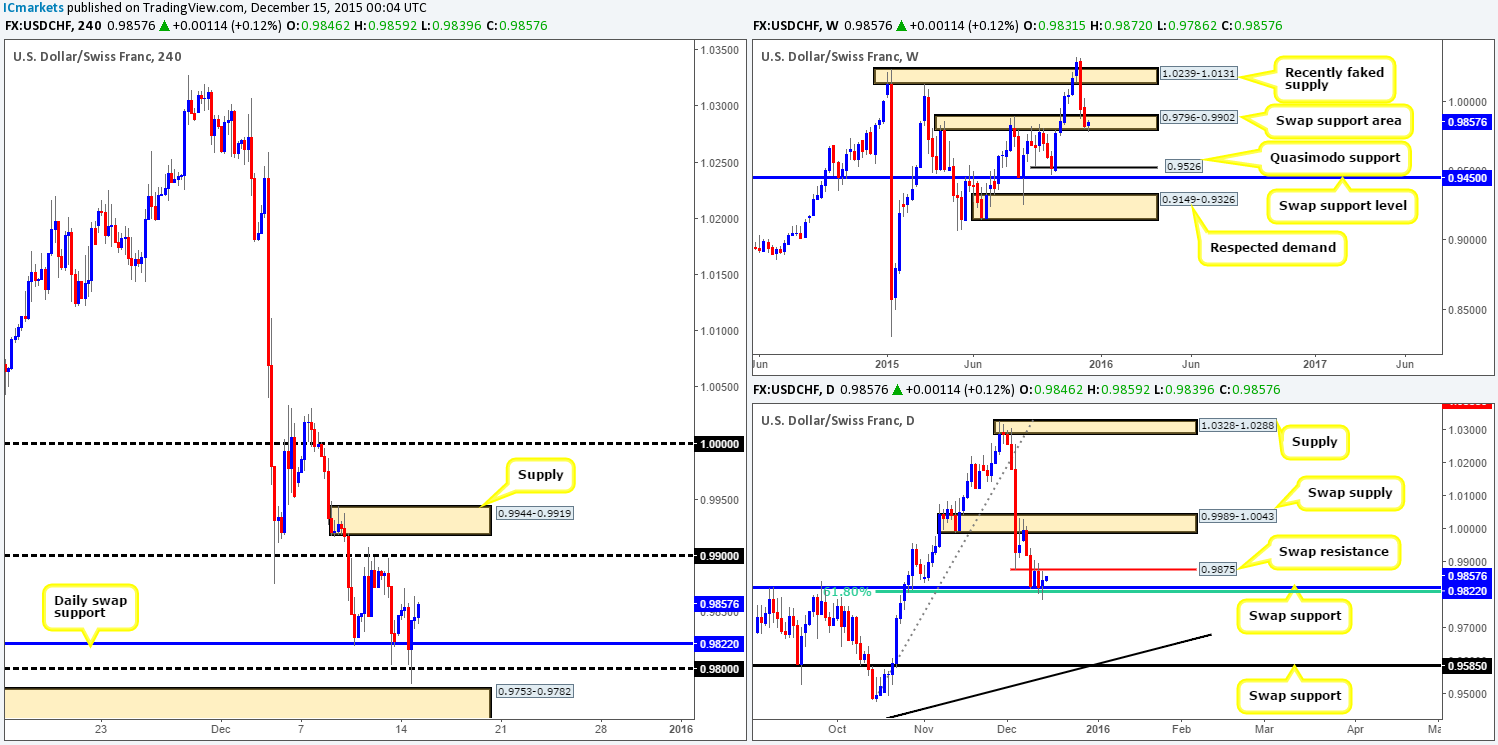
Coming at you directly from the weekly timeframe this morning shows that price recently whipsawed below the swap (support) area at 0.9796-0.9902 and is now trading in the green. Turning our attention to the daily chart, however, reveals that price remains sandwiched between a swap support level at 0.9822 (bolstered by a 61.8% Fibonacci level below it at 0.9803) and a minor swap resistance level at 0.9875. As we mentioned yesterday, a sustained move below this region could force this market down towards a swap support drawn from 0.9585, which, as you can see, converges nicely with a long-term trendline support taken from the low 0.9077. Conversely, a push above 0.9875 likely has the swap supply zone at 0.9989-1.0043 to target.
For those who read our previous report on this pair (http://www.icmarkets.com/blog/monday-14th-december-weekly-technical-outlook-and-review/), you’ll likely recall that we were looking for price to fake below the aforementioned daily swap (support) level and tag in bids sitting around psychological support 0.9800. As you can see, this in fact played out perfectly and we managed to enter long at 0.97964. With our position now trading nicely in the green and the stop planted at breakeven, we’re looking to take50% off the table around the aforementioned daily swap (resistance) level and then another 25% off at 0.9900. The remaining 25% will be left to run in case weekly buyers kick into action from the swap support area mentioned above at 0.9796-0.9902.
Levels to watch/ live orders:
- Buys: 0.97964[LIVE] Stop loss: breakeven).
- Sells: Flat (Stop loss: N/A).
DOW 30
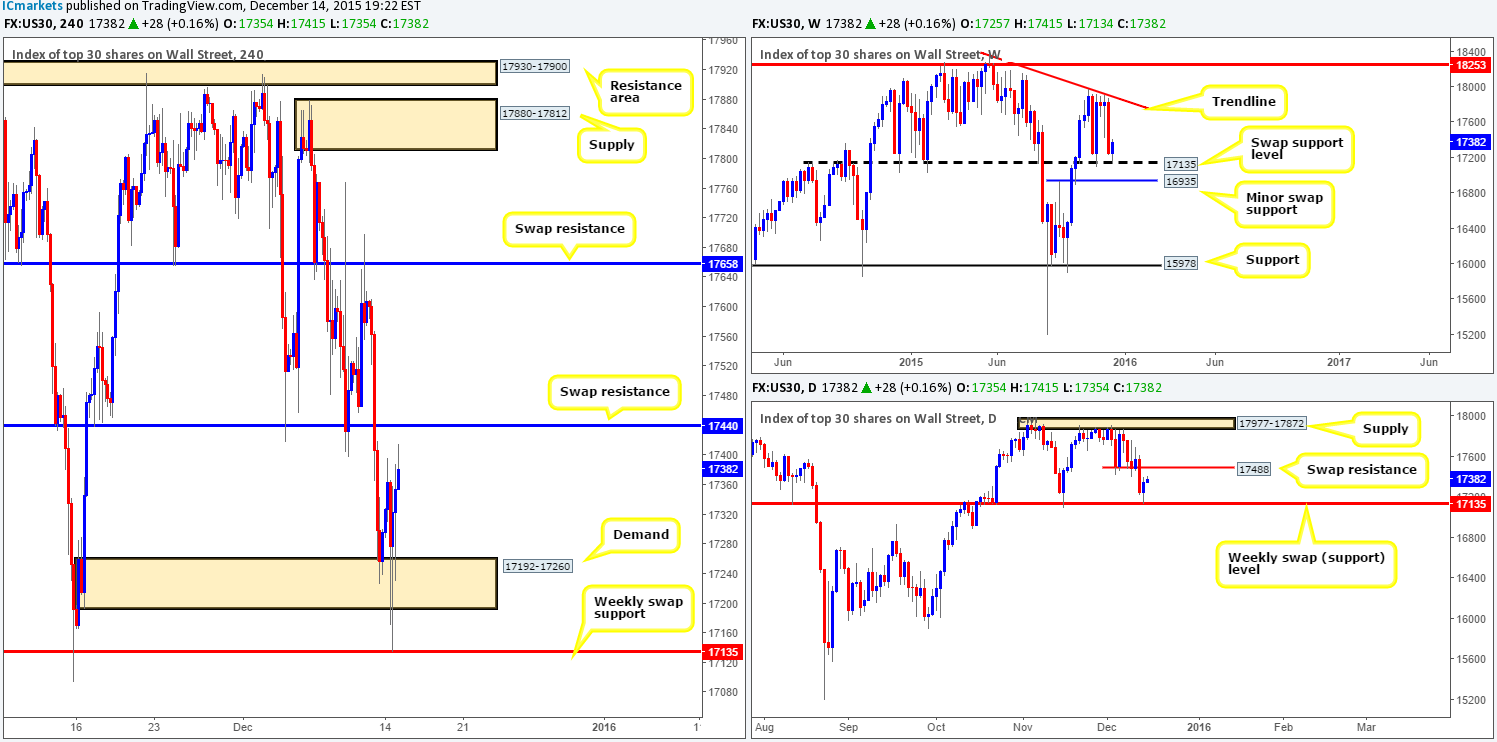
Following on from our previous report (http://www.icmarkets.com/blog/monday-14th-december-weekly-technical-outlook-and-review/), we can see price did indeed rebound from H4 demand drawn from 17192-17260 but only managed to reach highs of 17396 going into London. It was here that the sellers stepped in and drove this market aggressively lower, breaking below the aforementioned H4 demand and striking the weekly swap (support) level at 17135 to the pip! It was here that we noted that we’d be prepared to enter long at market due to how significant this number has been in the past.
Unfortunately, since we took the USD/CHF long we passed on this trade. We do hope some of our readers managed to get in on this move, since the upside could potentially be huge here. On the weekly, we see no reason, at least technically, why the DOW will not rally back up to where it came from – the underside of a weekly trendline resistance extended from the high 18365. However, before this can happen, both the H4 swap (resistance) level at 17440 and the daily swap (resistance) level at 17488 will need to be taken out.
Therefore, before we consider trading the bounce seen from the weekly level, we’ll need to see price close above both the H4 and daily levels – a perfect scenario would be to trade the break/retest. It will be interesting to see what today’s action brings…
Levels to watch/ live orders:
- Buys: Flat (Stop loss: N/A).
- Sells: Flat (Stop loss: N/A).
XAU/USD: (Gold)
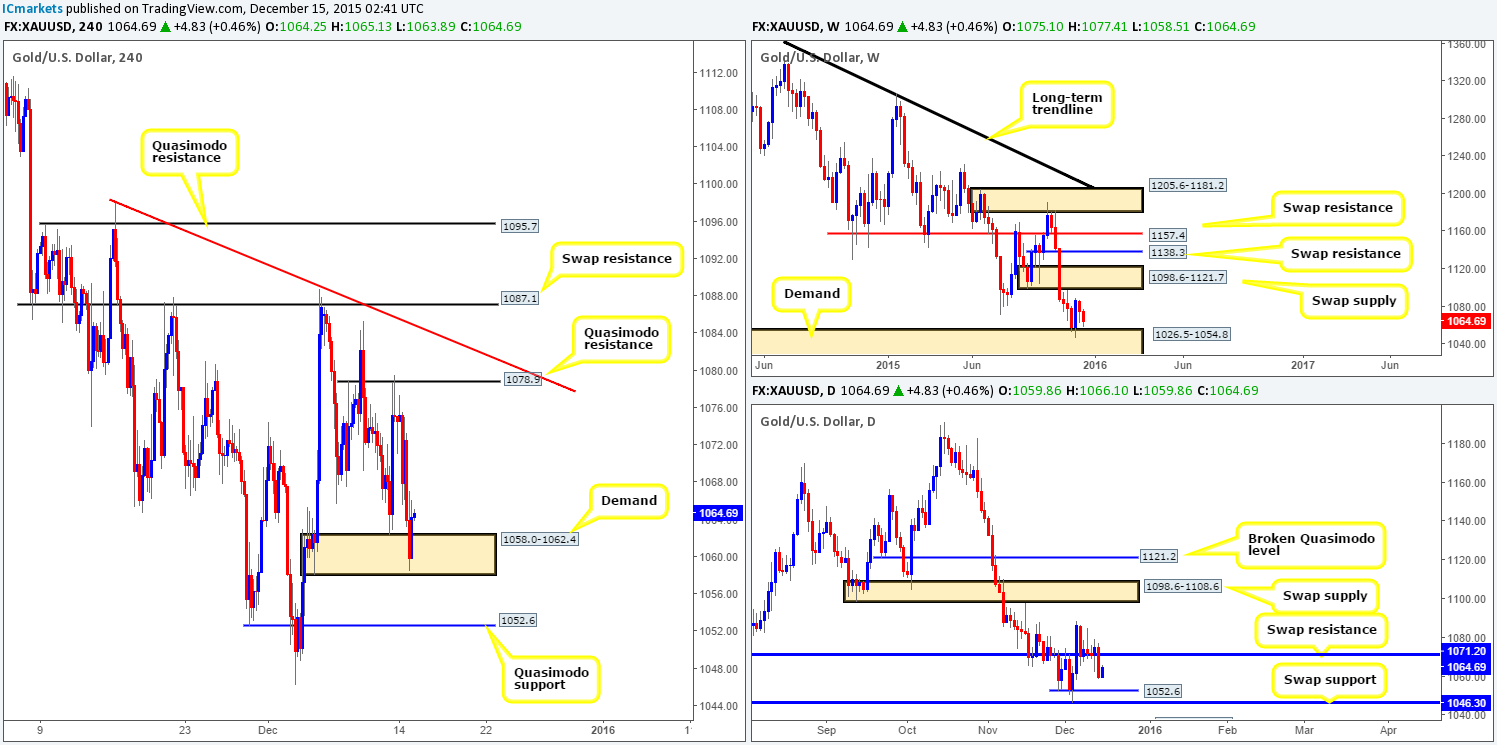
The precious metal is trading markedly lower this morning. A heavy round of selling took place yesterday following the rejection wicks printed at the underside of a Quasimodo resistance level at 1078.9 on Friday. This sell-off brought Gold deep into the jaws of an H4 demand zone coming in at 1058.0-1062.4, which, at the time of writing, appears to be holding firm.
In regard to price now trading within H4 demand, what’s the situation like over on the higher timeframe picture? Up on the weekly chart, we can see that market participants are hovering just above demand visible at 1026.5-1054.8. Meanwhile, down on the daily chart, price recently broke below a swap support (now resistance) level at 1071.2, and appears free to test Quasimodo support seen at 1052.6, followed by a swap support level at 1046.3.
Therefore, with the above points taken into consideration, we feel Gold will likely take out the remaining bids left within the current H4 demand and head lower before any noteworthy buying is seen. In the event that our analysis is correct, our plan of attack will consist of looking for confirmed lower timeframe entries long from the Quasimodo support level at 1052.6 and also the daily swap (support) barrier at 1046.3.
Levels to watch/ live orders:
- Buys: 1052.6 [Tentative – confirmation required] (Stop loss: dependent on where one confirms this level). 1046.3 [Tentative – confirmation required] (Stop loss: dependent on where one confirms this level).
- Sells: Flat (Stop loss: N/A).


