A note on lower-timeframe confirming price action…
Waiting for lower timeframe confirmation is our main tool to confirm strength within higher timeframe zones, and has really been the key to our trading success. It takes a little time to understand the subtle nuances, however, as each trade is never the same, but once you master the rhythm so to speak, you will be saved from countless unnecessary losing trades. The following is a list of what we look for:
- A break/retest of supply or demand dependent on which way you’re trading.
- A trendline break/retest.
- Buying/selling tails/wicks – essentially we look for a cluster of very obvious spikes off of lower timeframe support and resistance levels within the higher timeframe zone.
- Candlestick patterns. We tend to stick with pin bars and engulfing bars as these have proven to be the most effective.
We typically search for lower-timeframe confirmation between the M15 and H1 timeframes, since most of our higher-timeframe areas begin with the H4. Stops are usually placed 3-5 pips beyond confirming structures.
EUR/USD:
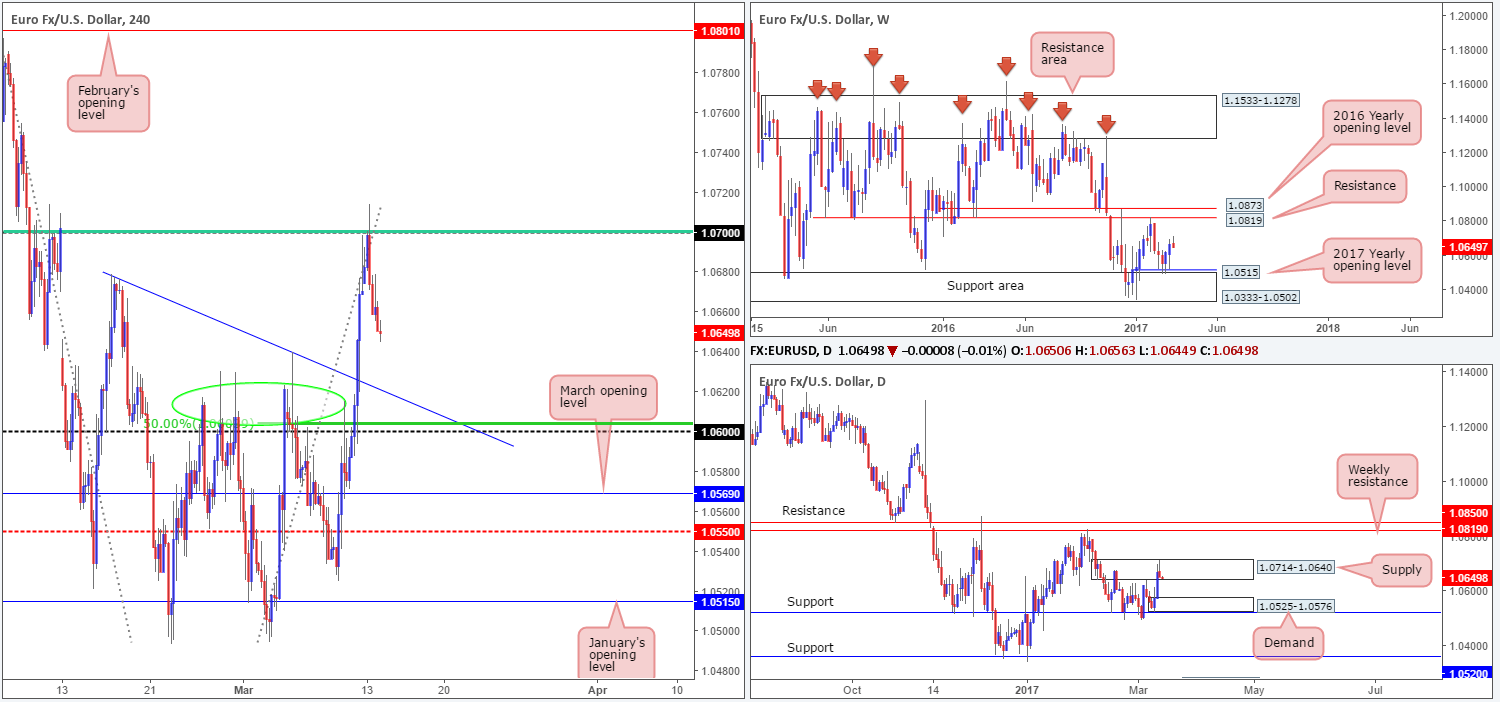
The single currency, as you can see, closed marginally lower on Monday after piercing through the nearby psychological level at 1.07/ H4 61.8% Fib retracement taken from the high 1.0828. Seeing as how the daily candles are responding reasonably well from daily supply at 1.0714-1.0640, and weekly action shows price to be meandering mid-range between weekly resistance at 1.0819 and the weekly support area at 1.0333-1.0502/ 2017 yearly opening level at 1.0515, further selling could be on the cards. With that being the case, the next downside target on the H4 scale can be seen around the H4 trendline support etched from the high 1.0679, followed closely by a 50.0% retracement level at 1.0603 and psychological level 1.06.
Our suggestions: The pair is likely to find some support around 1.06/1.0620 region with it having been a strong barrier of resistance on a number of occasions over the past few weeks (see green circle). Despite this, let’s be mindful to the fact that we have little higher-timeframe structure supporting this zone. The closest area of interest is seen on the daily chart at 1.0525-1.0576: a daily demand base. As a result of this, we would strongly recommend waiting for at least a reasonably strong bullish candle to form before considering a position from the above noted H4 support area.
Data points to consider: German ZEW economic sentiment at 10am. US PPI at 12.30pm GMT.
Levels to watch/live orders:
- Buys: 1.06/1.0620 neighborhood ([waiting for a reasonably sized H4 bull candle to form is advised] stop loss: ideally beyond the trigger candle).
- Sells: Flat (stop loss: N/A).
GBP/USD:
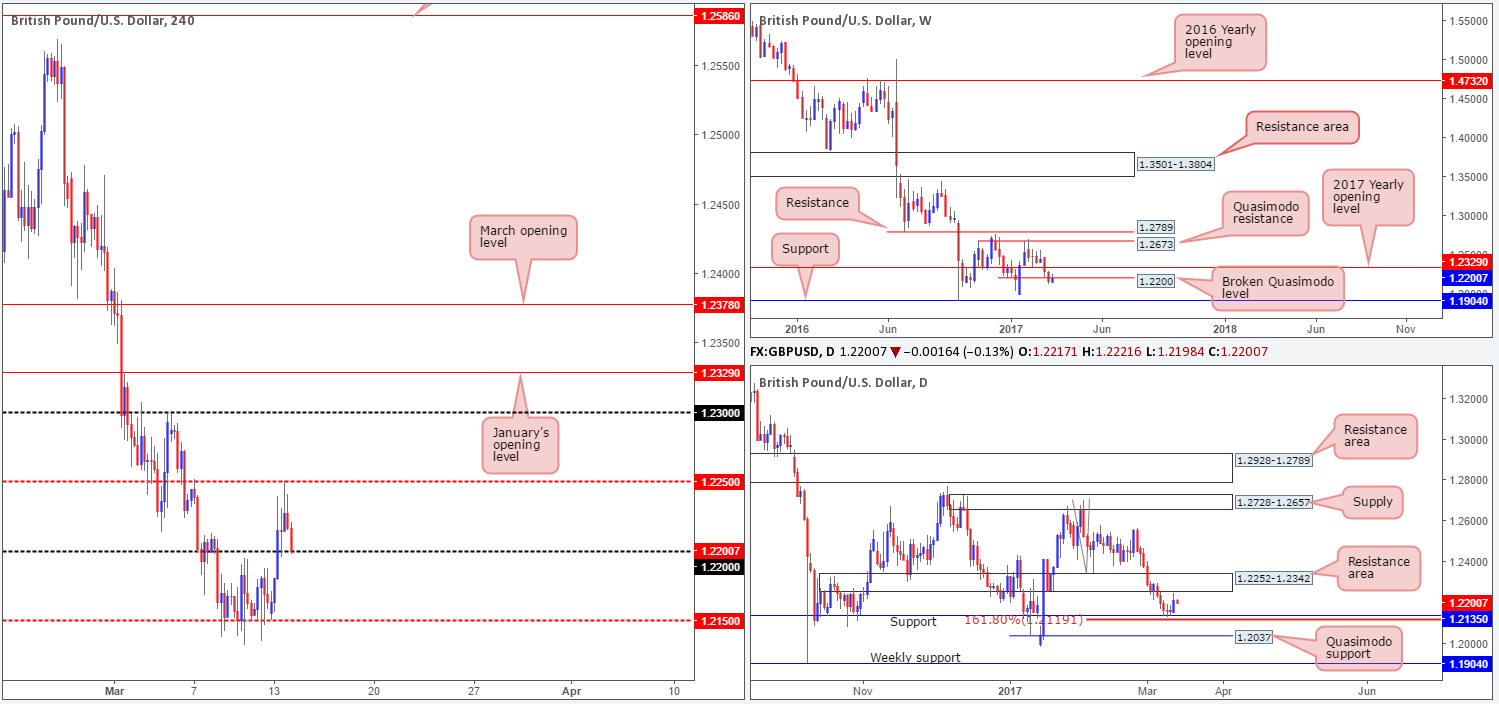
Looking at this market from the top this morning, weekly price is currently seen testing the underside of the recently broken weekly Quasimodo line coming in at 1.22. On the condition that the pair remains bearish beyond this hurdle, then the next port of call on this scale can be seen around weekly support coming in at 1.1904. Down on the daily timeframe, we can see that the bulls went on the offensive yesterday and pulled the unit up to within an inch of the daily resistance area drawn from 1.2252-1.2342, before printing a mild end-of-day correction. The next area of interest seen below here is a daily support drawn from 1.2135, followed closely by the daily 161.8% Fib ext. at 1.2119 taken from the high 1.2706.
Swinging across to the H4 candles, price clipped the H4 mid-way resistance at 1.2250 going into the early hours of yesterday’s US segment and closed the day just ahead of the 1.22 psychological support. As we are already aware, 1.22 also denotes the weekly broken Quasimodo level mentioned above. So, with that in mind, a H4 close beyond 1.22 today could spark a selloff back down to the H4 mid-way support at 1.2150/daily support at 1.2135. The question is how can we take advantage of this?
Our suggestions: Other than selling on the break of 1.22, the only other alternative we see here is to wait for H4 price to retest the underside of 1.22 as resistance (following the close lower) and a lower-timeframe sell signal (see the top of this report). The latter, in our opinion, is the safer route to take.
Data points to consider: US PPI at 12.30pm GMT.
Levels to watch/live orders:
- Buys: Flat (stop loss: N/A).
- Sells: Watch for price to engulf 1.22 and then look to trade any retest seen thereafter ([wait for a lower-timeframe signal to form following the retest before looking to pull the trigger] stop loss: dependent on where one confirms this barrier).
AUD/USD:
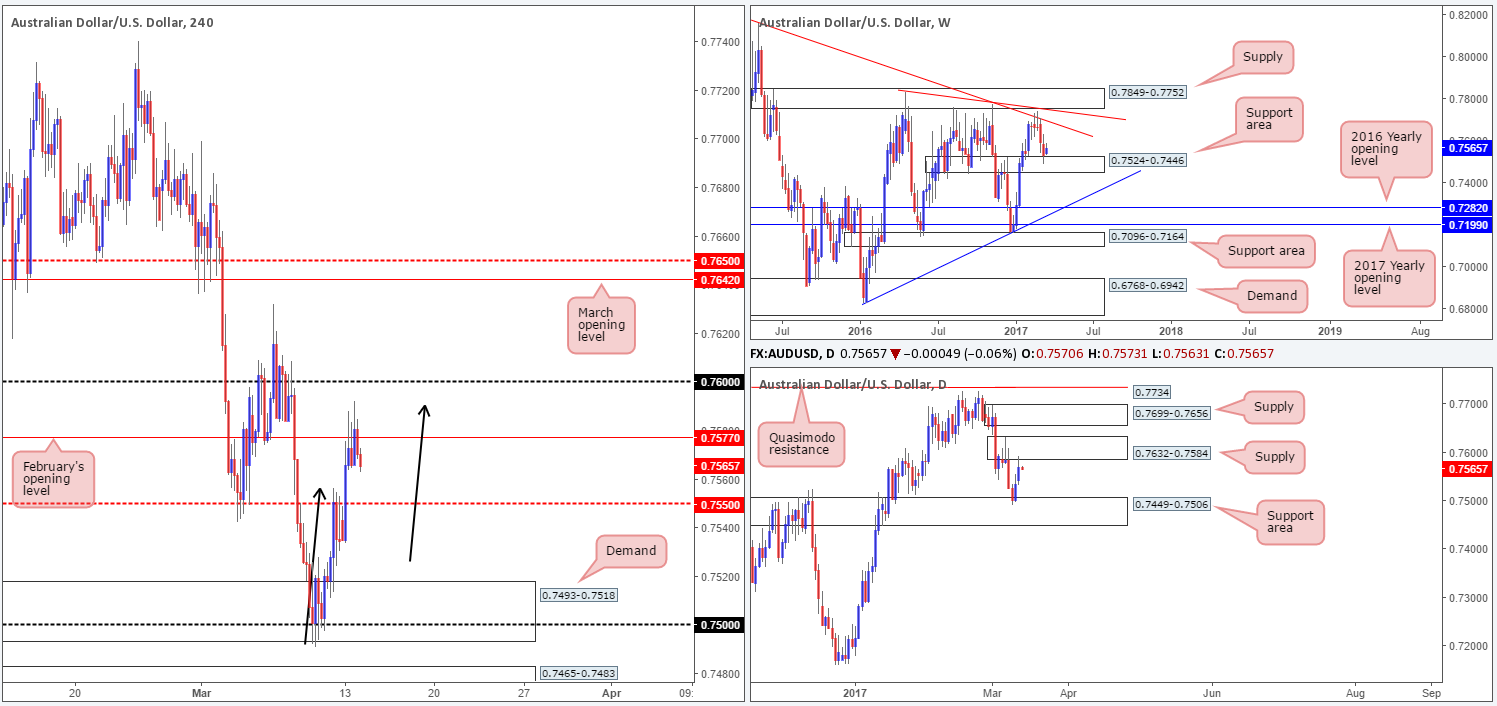
Having seen weekly price recently shake hands with the weekly support area at 0.7524-0.7446, as well as a daily action also touch base with a daily support area drawn from 0.7449-0.7506, there was no surprise to see the Aussie push higher on Monday. Still, the rally could very well be a short-lived one! While daily action did indeed extend Friday’s bounce from the aforementioned daily support base yesterday, we also saw a daily supply zone at 0.7632-0.7584 brought into play. Couple this with the H4 candles also recently topping out around the completion point of a minor H4 AB=CD pattern (see black arrows) at 0.7589/February’s opening level at 0.7577, the unit may look to erase some/all of yesterday’s gains.
Our suggestions: Despite the weekly chart suggesting further buying could be on the horizon, both the H4 and daily charts disagree (see above). Even so, shorting this market is proving to be difficult owing to the nearby H4 mid-way support at 0.7550! Unfortunately, we see little else to hang our hat on this morning, so we will be placing this market on the back burner for the time being and will look to reassess following today’s Chinese industrial production figures.
Data points to consider: Chinese industrial production at 2am. US PPI at 12.30pm GMT.
Levels to watch/live orders:
- Buys: Flat (stop loss: N/A).
- Sells: Flat (stop loss: N/A).
USD/JPY:
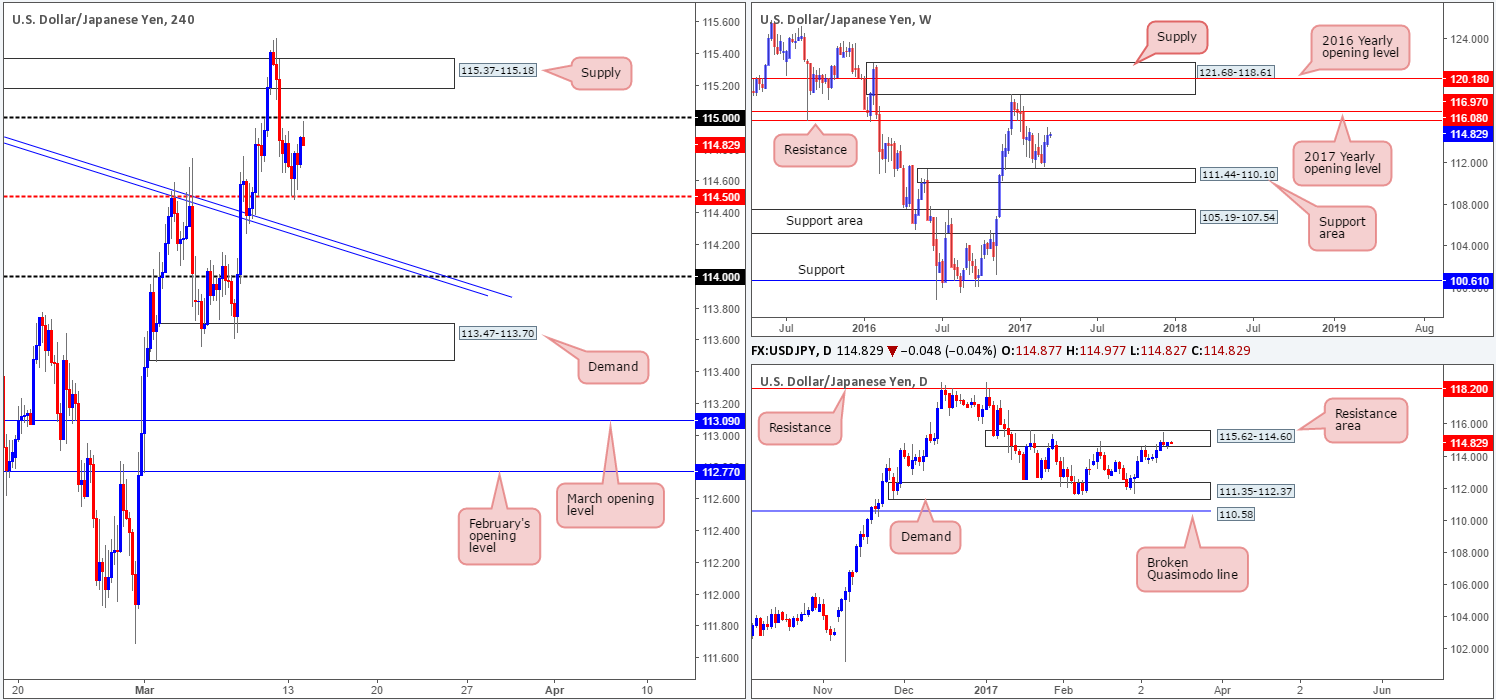
In recent sessions, the USD/JPY succeeded in netting a batch of fresh bids off the H4 mid-way support hurdle at 114.50 which led to price tapping a high of 114.91 into the close. In consequence to yesterday’s rather lackluster performance, there was little change seen to the higher-timeframe structure. Weekly price remains on course to cross swords with a weekly resistance level seen at 116.08, and daily price is seen trading within the walls of a daily resistance area coming in at 115.62-114.60.
With the above in mind, a break through the 115 handle, although this would be considered a bullish signal according to the weekly timeframe, shows little wiggle room for price to move since H4 supply at 115.37-115.18 sits directly above. On the other hand, a break below 114.50 would be considered a bearish signal since daily flow remains within a daily resistance area. Nevertheless, let’s take into account that not only is there a nearby H4 trendline support (extended from the high 115.62) seen just below 114.50, but there’s also the fact that you’d be selling against potential weekly momentum!
Our suggestions: Based on the above notes, our team has come to a general consensus that a trade in this market is just too risky on the timeframes we follow.
Data points to consider: US PPI at 12.30pm GMT.
Levels to watch/live orders:
- Buys: Flat (stop loss: N/A).
- Sells: Flat (stop loss: N/A).
USD/CAD:
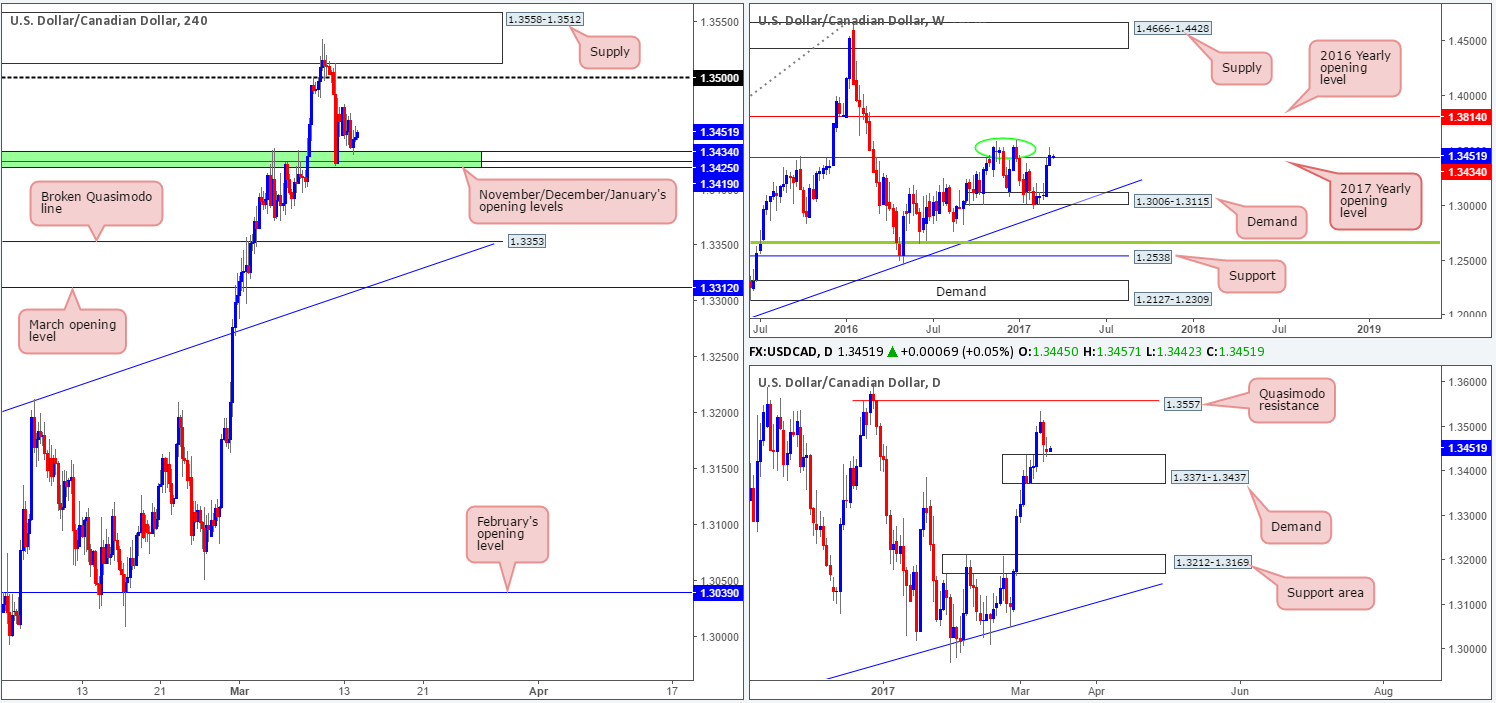
For the most part, it was a relatively quiet session in the USD/CAD market yesterday. There were no high-impacting events affecting either the US dollar or Canadian dollar, which saw the pair drift lower to retest the 1.3419/1.3434 region (November/December/January's opening levels). This area, as you can see, is holding ground for now and this could very well be because of the daily demand base currently seen in play at 1.3371-1.3437. Looking up to the weekly candles, the unit managed to marginally close beyond the 2017 yearly opening level at 1.3434. Since the close above this line was relatively minor, and taking into account that there is a nearby weekly double-top formation seen around the 1.3588 region (green circle), we do not consider 1.3434 to be out of the picture as a weekly resistance just yet!
Our suggestions: In a nutshell, the structure of this pair can be boiled down to the following:
- Weekly action suggests that the bears could come into play.
- Daily price is trading from demand so this evidently favors the bulls.
- And H4 flow is currently seen bouncing off 1.3419/1.3434, which also favors the bulls.
Ultimately, we will not be happy selling this market until the current daily demand is out of the picture. Despite this, a break below 1.3419/1.3434 may entice sellers down to the H4 broken Quasimodo support at 1.3353 since, other than the 1.34 barrier, we see very little active H4 demand to the left of price. In regards to buying this unit, we still feel it would just be too much of a risk considering the weekly structure noted above. However, In the event that you believe the 1.3419/1.3434 will hold today despite our notes, we would advise waiting for a solid (preferably full-bodied) bull candle to form before pulling the trigger. This will, of course, by no means guarantee a winning trade, but what it will do is show buyer intent!
Data points to consider: US PPI at 12.30pm GMT.
Levels to watch/live orders:
- Buys: Flat (stop loss: N/A).
- Sells: Flat (stop loss: N/A).
USD/CHF:
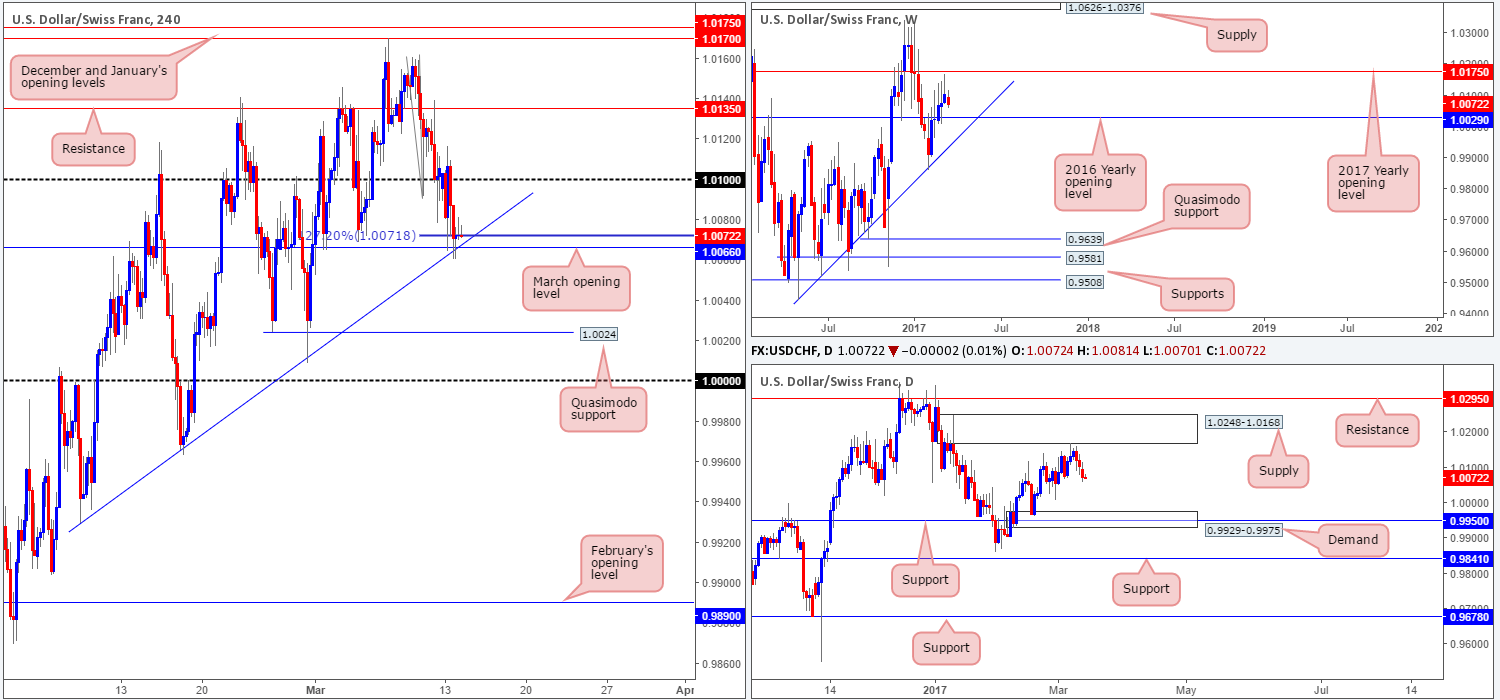
As anticipated, the H4 candles eventually engulfed the 1.01 handle during the course of yesterday’s sessions and tested March’s opening level at 1.0066. As highlighted in yesterday’s report, this level is also bolstered by a H4 trendline support taken from the low 0.9929 and a H4 127.2% Fib ext. at 1.0071. While this confluence is attractive and may continue to hold this unit higher today, we remain wary of buying from here due to the following:
- On the H4 chart, there is little room for price to rally from here given the nearby 1.01 handle.
- Over on the daily chart, the pair recently clipped the underside of a daily supply coming in at 1.0248-1.0168. In addition to this, we do not see much active demand to the left of current price until the pair reaches the daily demand pegged at 0.9929-0.9975, which happens to intersect with a daily support level seen at 0.9950.
- Weekly price also recently came within striking distance of the 2017 yearly opening level at 1.0175, which looks to be enough to force weekly action lower this week.
Our suggestions: As things stand, our desk believes that 1.0066 will ultimately give way and price will look to test the H4 Quasimodo support at 1.0024, followed closely by parity (1.0000). To that end, we will be looking to short price beyond 1.0066 today if we happen to see a retest of this number as resistance that’s bolstered by a lower-timeframe sell signal (see the top of this report).
Data points to consider: US PPI at 12.30pm GMT.
Levels to watch/live orders:
- Buys: Flat (stop loss: N/A).
- Sells: Watch for price to engulf 1.0066 and then look to trade any retest seen thereafter (waiting for a lower-timeframe confirming signal to form [see the top of this report] following the retest is advised] stop loss: dependent on where one confirms the level).
DOW 30:
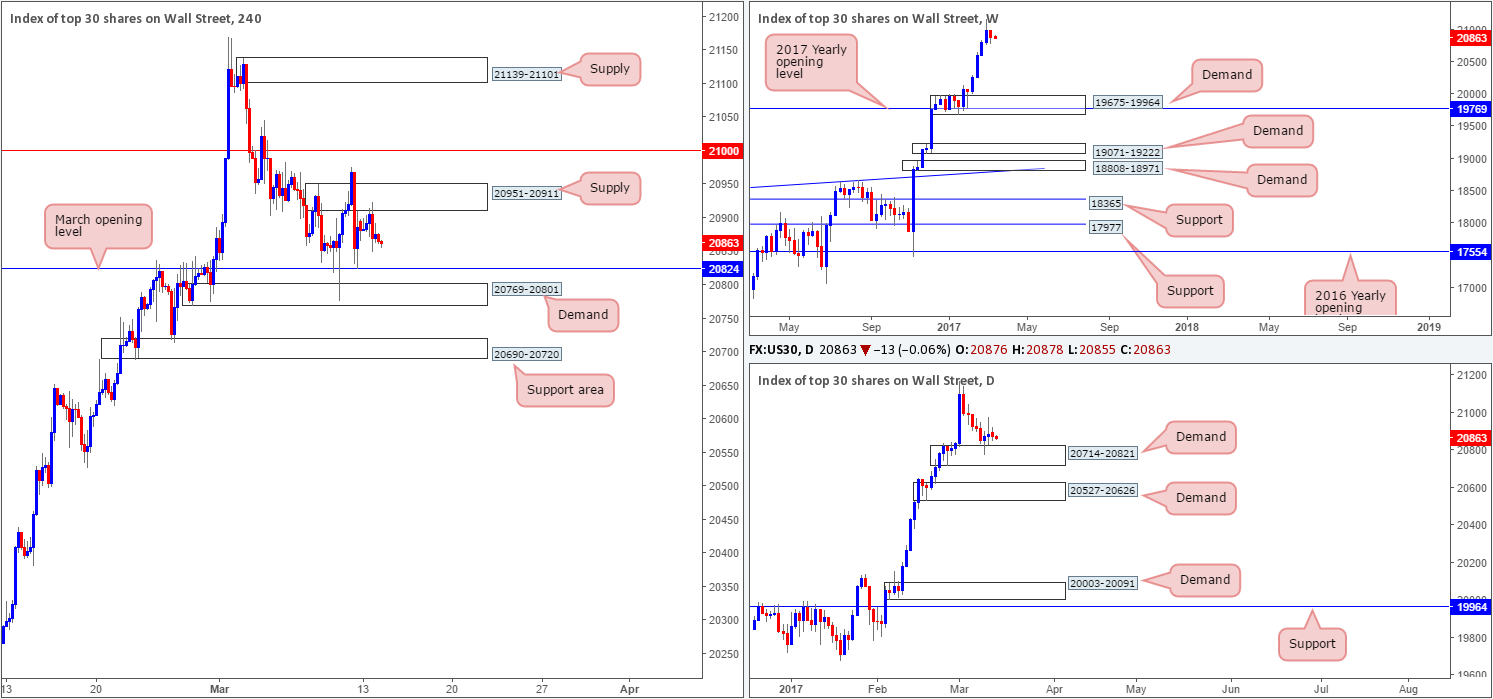
It was a quiet session for the US equity market yesterday, with price ranging a mere 74 points on the day. Looking at the H4 timeframe, it’s quite clear that price is somewhat restricted at the moment between a H4 supply at 20951-20911 and March’s opening level at 20824.
Turning our attention to the weekly timeframe, the index printed its first losing week since early Feb last week. The bearish close is not something we would label significant, however, seeing as how price remained within the prior week’s range and sported a minor end-of-week bullish correction. With equities still seen trading nearby record highs, where do we go from here? Well, given that there is absolutely no weekly resistance levels in sight, the best we can do for the time being is continue looking to ‘buy the dips’. The closest higher-timeframe area can be seen at 20714-20821: a daily demand zone, which is currently in play as we write.
Our suggestions: In essence, our team is still in favor of a rally higher. Be that as it may, the H4 supply at 20951-20911 and nearby 21000 line would need to be taken out beforehand. Therefore, until we see a H4 close print above these areas, we will not be considering positions in this market.
Data points to consider: US PPI at 12.30pm GMT.
Levels to watch/live orders:
- Buys: Watch for price to engulf 21000 and then look to trade any retest seen thereafter (waiting for a lower-timeframe confirming signal to form [see the top of this report] following the retest is advised] stop loss: dependent on where one confirms the level).
- Sells: Flat (stop loss: N/A).
GOLD:
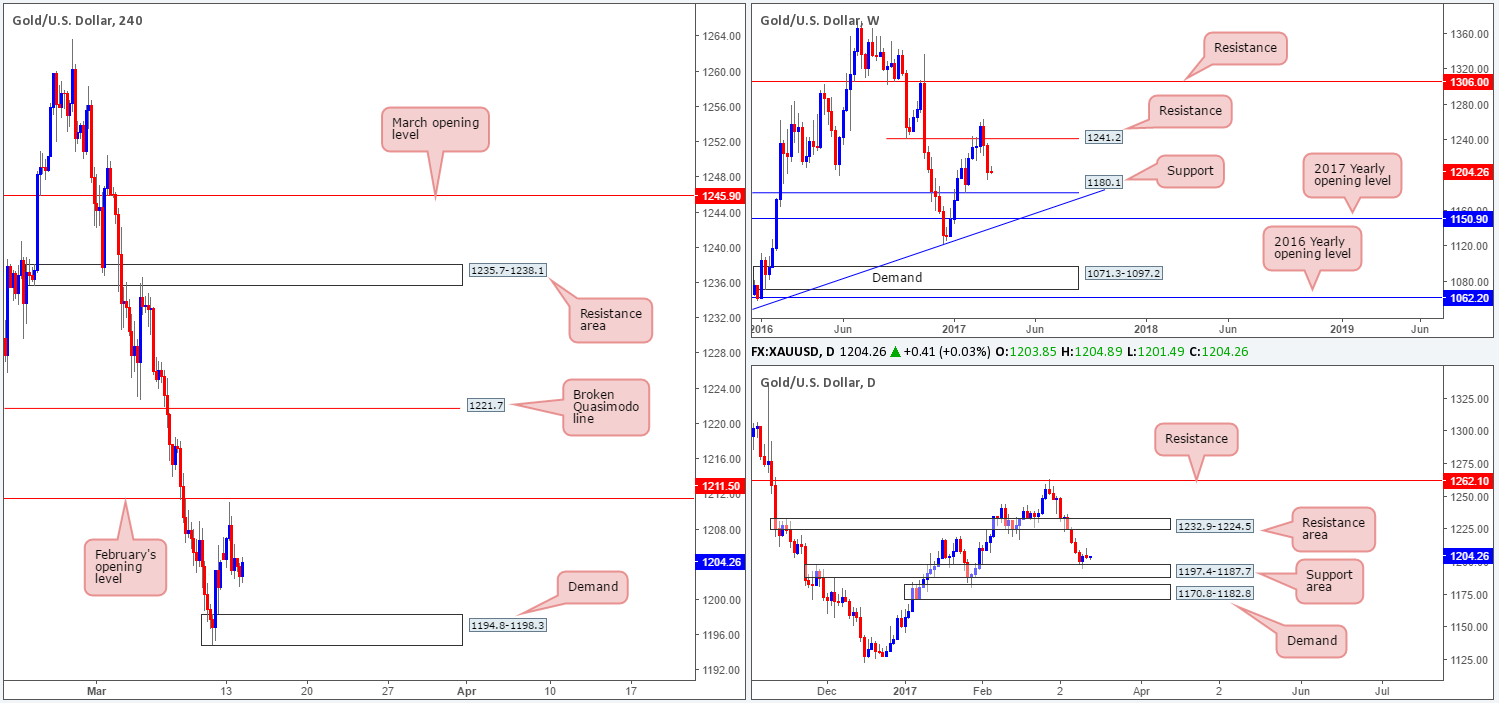
Following the open, we saw the yellow metal start the week out on a reasonably strong footing which saw the unit touch a high of 1211.0, just missing February’s opening base by a few pips at 1211.5. It was here (the London open), however, that things begun to turn sour. H4 price ended the day engulfing the weekly opening level, clocking a low of 1201.4 going into the closing bell. This, as you’ll see over on the daily chart, formed a nice-looking daily bearish selling wick.
As far as higher-timeframe structure goes, the weekly timeframe indicates that price could potentially continue driving lower until we reach the weekly support level drawn from 1180.1. Despite this, the weekly sellers will need to run through the daily support area drawn in at 1197.4-1187.7 before we see 1180.1.
Our suggestions: Given the conflicting signals seen from the weekly and daily timeframes, this remains a difficult market to read. For all intents and purposes, neither a long nor short seems attractive at this time.
The daily demand seen below the current daily support area at 1170.8-1182.8, nonetheless, has caught our eye. Encased within is the above noted weekly support level and a H4 Quasimodo support hurdle seen below the current H4 demand at 1184.3. This daily area, given its surrounding confluence, has a high probability of bouncing price higher. Unfortunately, there is a fair amount of ground to cover before this base comes into view, so place this beauty on the back burner for a later date!
Levels to watch/live orders:
- Buys: Flat (stop loss: N/A).
- Sells: Flat (stop loss: N/A).