A note on lower timeframe confirming price action…
Waiting for lower timeframe confirmation is our main tool to confirm strength within higher timeframe zones, and has really been the key to our trading success. It takes a little time to understand the subtle nuances, however, as each trade is never the same, but once you master the rhythm so to speak, you will be saved from countless unnecessary losing trades. The following is a list of what we look for:
- A break/retest of supply or demand dependent on which way you’re trading.
- A trendline break/retest.
- Buying/selling tails/wicks – essentially we look for a cluster of very obvious spikes off of lower timeframe support and resistance levels within the higher timeframe zone.
- Candlestick patterns. We tend to stick with pin bars and engulfing bars as these have proven to be the most effective.
We typically search for lower-timeframe confirmation between the M15 and H1 timeframes, since most of our higher-timeframe areas begin with the H4. Stops are usually placed 3-5 pips beyond confirming structures.
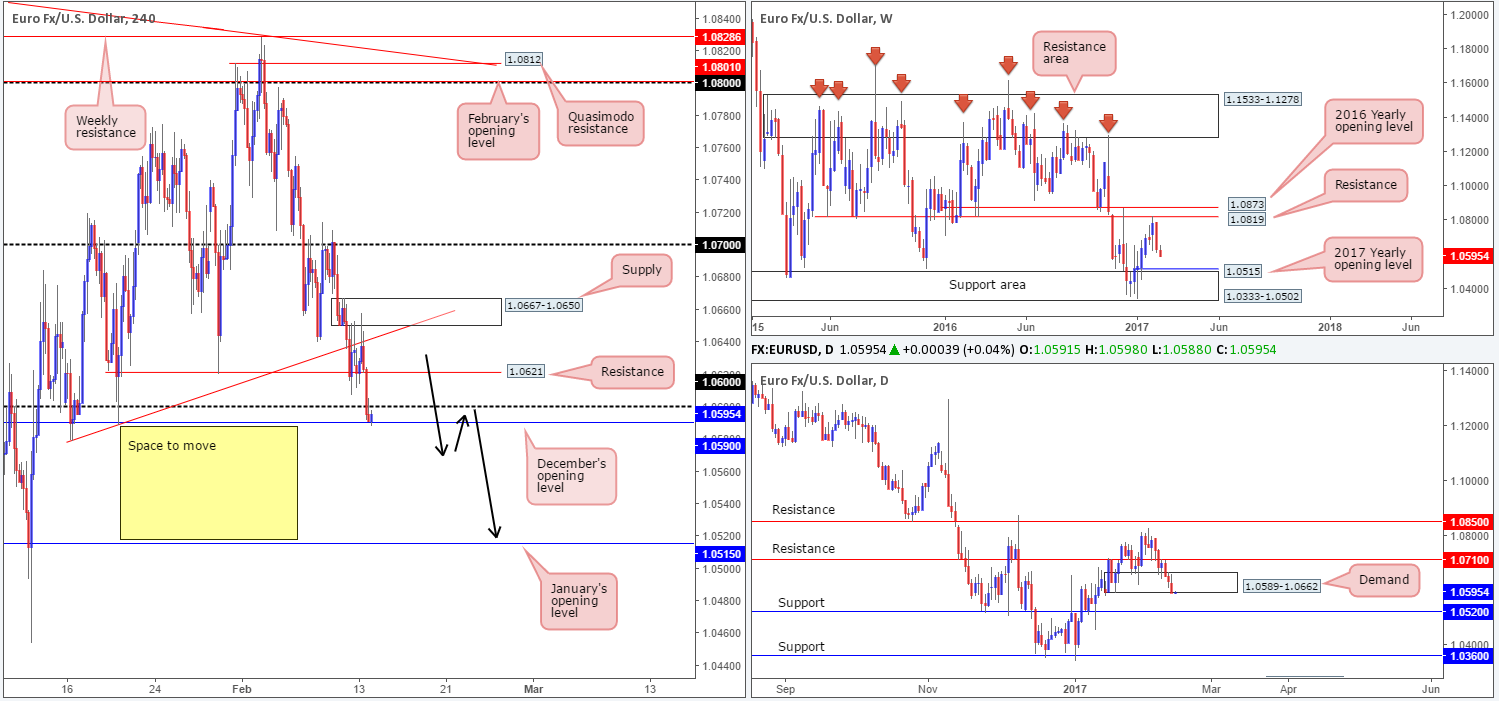
EUR/USD:
After whipsawing through a H4 trendline resistance extended from the low 1.0579 and tapping fresh offers at the underside of a H4 supply at 1.0667-1.0650 in the early hours of yesterday’s segment, we can see that he EUR continued to weaken against its US counterpart. In one fell swoop, the pair swallowed both H4 support at 1.0621 (now a resistance) and the 1.06 handle, leaving price free to challenge the nearby December opening level at 1.0590.
Looking across to the higher-timeframe structures, it’s clear to see that the weekly bears remain in the driving seat for the time being. In conjunction with this, daily demand at 1.0589-1.0662 is also holding on by just a thread at the moment. The next downside target on the higher timeframes can be seen at a daily support level coming in at 1.0520, which happens to be sited only a few pips above the 2017 yearly opening level at 1.0515/weekly support area at 1.0333-1.0502.
Our suggestions: In the event that a H4 close is seen beyond December’s opening level today, the next H4 support in the firing range can be seen at the 2017 yearly opening level (which as we already know sits just beneath a daily support at 1.0520). This could set the foundation for a reasonable short trade today if the H4 candles retest the broken H4 levels as resistance (as per the black arrows) and pencil in a H4 bear candle.
Data points to consider: German Prelim GDP release at 7am. US PPI data at 1.30pm, Fed Chair Yellen speaks at 3pm followed by FOMC member Kaplan taking the stage at 6pm GMT.
Levels to watch/live orders:
- Buys: Flat (stop loss: N/A).
- Sells: Watch for a H4 close below the1.0590 region and then look to trade any retest seen thereafter ([waiting for a H4 bear candle to form following the retest is advised before pulling the trigger] stop loss: ideally beyond the trigger candle).
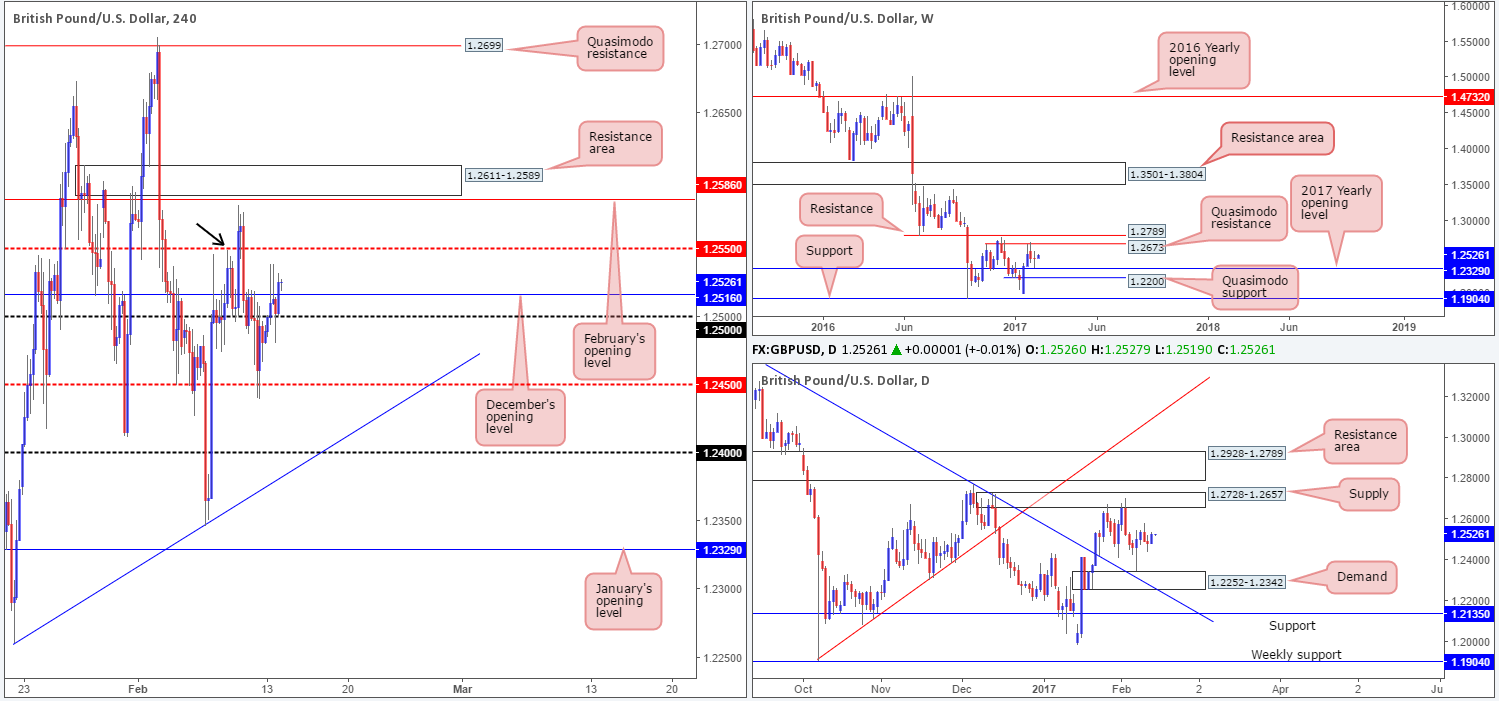
GBP/USD:
In recent sessions, we saw the GBP/USD settle just above December’s opening level at 1.2516, following a modest retest seen from the 1.25 handle. Provided that the bulls defend 1.2516 as support today, we see little standing in the way of price challenging the H4 mid-way resistance at 1.2550, which happens to align nicely with a H4 Quasimodo resistance left shoulder (see black arrow).
As far as structure goes, there is unfortunately very little direction seen from the bigger picture at this time. The weekly candles are currently trading mid-range between the 2017 yearly opening level at 1.2329 and a weekly Quasimodo resistance coming in at 1.2673. By the same token, a similar pattern exists on the daily chart. Daily price is loitering between a daily demand at 1.2252-1.2342 (bolstered by a daily trendline support stretched from the high 1.3437) and a daily supply penciled in at 1.2728-1.2657.
Our suggestions: On account of there being little higher-timeframe convergence seen on the H4 chart, we will not be looking for anything other than a bounce today. With this in mind, a bounce from 1.2516/1.25 is possible, in our opinion. However, it’ll only be considered a valid bounce if, and only if, it’s accompanied by a lower-timeframe buy signal (see the top of this report). The other key thing to keep in mind here is that one would also require a relatively small stop loss in order to achieve reasonable risk/reward up to the 1.2550 neighborhood.
Data points to consider: UK CPI at 9.30am. US PPI data at 1.30pm, Fed Chair Yellen speaks at 3pm followed by FOMC member Kaplan taking the stage at 6pm GMT.
Levels to watch/live orders:
- Buys: 1.2516 ([wait for a lower-timeframe signal to form before looking to execute a trade] stop loss: dependent on where one confirms the level).
- Sells: Flat (stop loss: N/A).
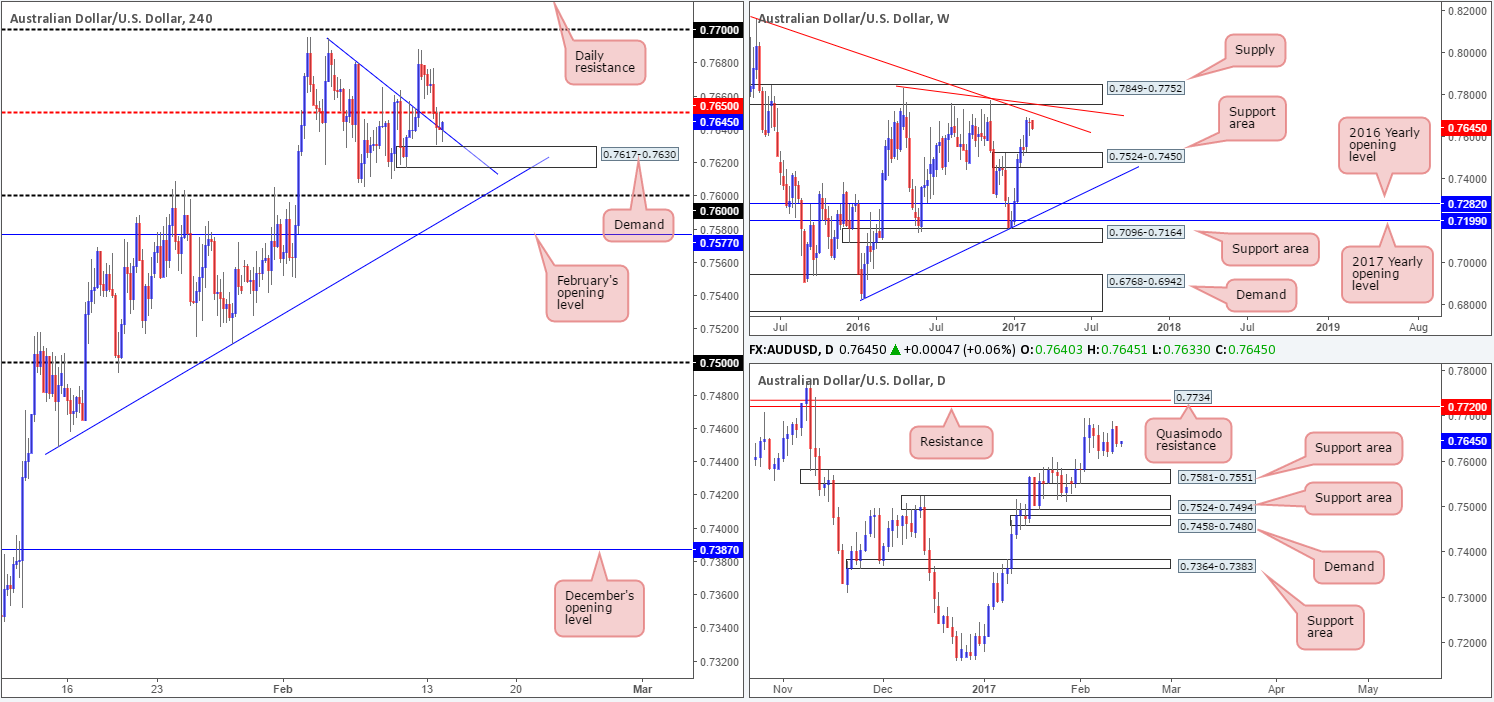
AUD/USD:
Despite the commodity currency closing the day in negative territory yesterday, the pair may very well be in the process of carving out a bottom against its US counterpart. Going into the US session, we can see that the pair momentarily surpassed the H4 trendline support taken from the high 0.7695, and came within striking distance of connecting with a H4 demand area seen at 0.7617-0.7630. The H4 trendline remains in play as of now, which could lead to a short-term bounce back up to the H4 mid-level resistance at 0.7650.
Given the above factors, how do things stand on the higher timeframes? Well, from the weekly chart, the Aussie remains lurking nearby a weekly trendline resistance taken from the high 0.8163, followed closely by a weekly supply zone logged in at 0.7849-0.7752 (bolstered by yet another weekly trendline resistance stretched from the high 0.7835). What’s more, positioned closely to the weekly trendline resistance (0.8163) is a daily Quasimodo resistance penciled in at 0.7734 and a daily resistance at 0.7720.
Our suggestions: Assuming that the H4 bulls are able to lift price back above the 0.7650 mark today, a long from here could be something to think about. On the assumption that a H4 bullish close is seen beyond this number, and price retests it as support as well as forms a lower-timeframe buy signal (see the top of this report), we would look to long this market, targeting the 0.77 handle. The main ingredient behind our thinking here that there’s room seen, albeit not much, for further upside on the bigger picture (see above).
Once/if price crosses swords with 0.77, our team will shift from longs to shorts since between the underside of the weekly supply at 0.7752 and the daily resistance at 0.7720, we have a relatively strong-looking higher-timeframe sell zone in the making.
Data points to consider: Chinese CPI at 1.30am. US PPI data at 1.30pm, Fed Chair Yellen speaks at 3pm followed by FOMC member Kaplan taking the stage at 6pm GMT.
Levels to watch/live orders:
- Buys: Watch for a H4 close above the 0.7650 region and then look to trade any retest seen thereafter ([waiting for a lower-timeframe signal to form following the retest is advised before pulling the trigger] stop loss: dependent on where one confirms this level).
- Sells: 0.7752/0.7720 ([wait for a H4 bear candle to form before pulling the trigger] stop loss: ideally beyond the trigger candle).
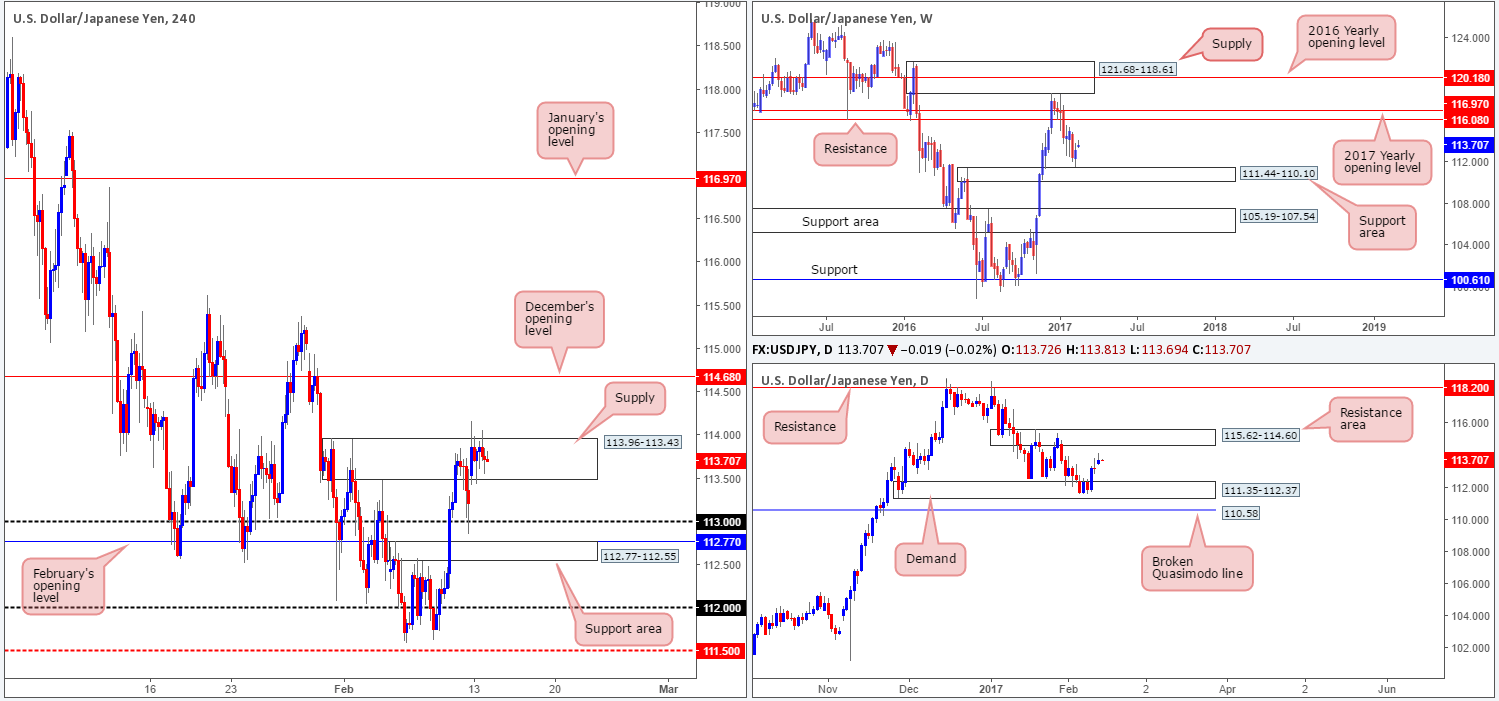
USD/JPY:
The USD/JPY, as you can see, started the week off on a positive note, gapping over 30 pips north into the jaws of a H4 supply zone drawn from 113.96-113.43. In spite of this, buying pressure diminished rather quickly following a whipsaw through the top edge of the H4 area, which saw the unit consolidate throughout the remainder of the day between 114.16/113.43.
With the weekly candles currently reflecting a bullish stance from just ahead of the weekly support area at 111.44-110.10, and daily price looking on course to gravitate higher up to a daily resistance area at 115.62-114.60, the current H4 supply may be on the verge of giving way.
Our suggestions: Beyond the current H4 supply area, we see room for price to challenge December’s opening base at 114.68, which, as you may have noticed, is positioned within the lower edge of the aforementioned daily resistance area. Should a H4 close take shape above the H4 supply today, as the higher-timeframes suggest, and is followed up with both a retest and a lower-timeframe buy signal (see the top of this report), our desk would look to buy, targeting the 114.68 boundary.
Data points to consider: US PPI data at 1.30pm, Fed Chair Yellen speaks at 3pm followed by FOMC member Kaplan taking the stage at 6pm GMT.
Levels to watch/live orders:
- Buys: Watch for a H4 close above 113.96-113.43 and then look to trade any retest seen thereafter ([waiting for a lower-timeframe signal to form following the retest is advised before pulling the trigger] stop loss: dependent on where one confirms this zone).
- Sells: Flat (stop loss: N/A).
USD/CAD:
During the course of Monday’s trading, the H4 candles managed to find a foothold around the underside of 1.31 and clock a low of 1.3054 on the day. While this is the fourth consecutive bearish day for the pair, we feel the market’s structure is signaling oversold conditions at the moment. Directly ahead we have the H4 mid-level support 1.3050, which, of course, could hold price higher today. Beyond here, however, sits a H4 demand base coming in at 1.3006-1.3035, which happens to be bolstered by both a weekly demand area at 1.3006-1.3115 and a daily support level at 1.3006. Apart from this, the H4 demand area also boasts the following converging structures: February’s opening level at 1.3039, a H4 trendline support taken from the low 1.2968, a H4 AB=CD (see black arrows) 127.2% approach terminating around 1.3036 mark and to top it off there’s also the daily trendline support taken from the low 1.2654 intersecting with this H4 zone.
Our suggestions: While buying from the H4 demand area may very well be tempting considering its confluence, we still have to remain cognizant of the 1.30 figure seen just below it. This watched number could act as a magnet to price and pull the pair through our H4 buy zone! Therefore, to be on the safe side, we will wait for a reasonably sized H4 bull candle to take shape here before pressing the buy button. This will by no means guarantee a winning trade, but what it will do is show buyer interest within a high-probability reversal zone.
Data points to consider: US PPI data at 1.30pm, Fed Chair Yellen speaks at 3pm followed by FOMC member Kaplan taking the stage at 6pm GMT.
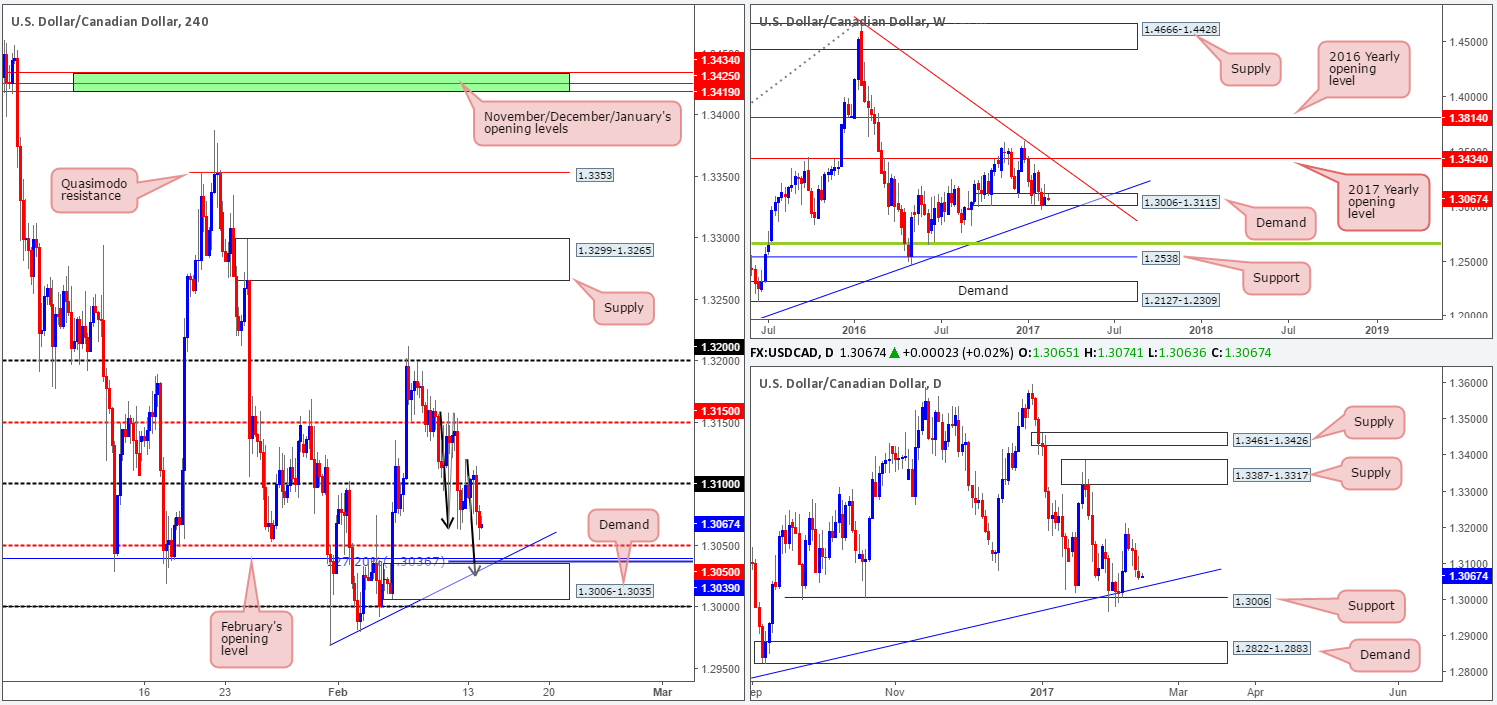
Levels to watch/live orders:
- Buys: 1.3006-1.3035 ([wait for a reasonably sized H4 bull candle to form before pulling the trigger] stop loss: ideally beyond the trigger candle).
- Sells: Flat (stop loss: N/A).
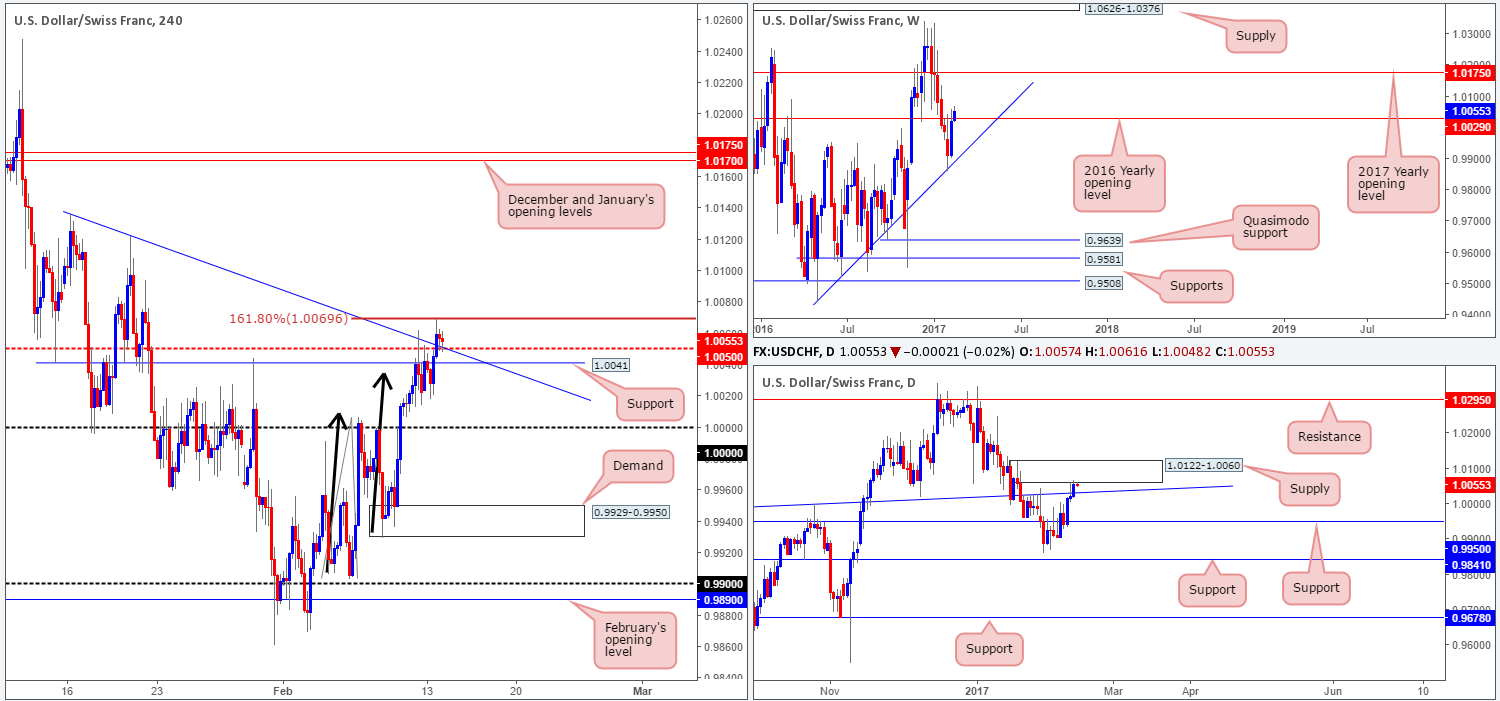
USD/CHF:
Kicking this morning’s report off with a look at the weekly chart, we can see that weekly price is currently edging above the 2016 yearly opening level at 1.0029. In order to confirm this break, however, we would require a closing weekly candle. The story on the daily chart shows that price recently crossed above the daily trendline resistance taken from the high 0.9956, but immediately touched gloves with the underside of a daily supply coming in at 1.0122-1.0060. Swinging across to the H4 candles, the pair broke through both H4 resistance at 1.0041 and the H4 mid-way resistance at 1.0050, and ended the day respecting the H4 AB=CD (see black arrows) 161.8% extension line at 1.0069.
Our suggestions: In light of recent action, selling right now, even though the unit is bolstered by a daily supply and a H4 161.8% ext., is a risky play in our book. Not only do the H4 candles have to contend with nearby H4 mid-way support at 1.0050, a H4 support at 1.0041 and a H4 trendline support taken from the high 1.0136, but also there’s the daily trendline support etched from the high 0.9956 to consider, as well as the recent break above the 2016 yearly opening level! As a result of the above, we feel it best to remain on the sidelines for now.
Data points to consider: CHF PPI at 8.15am. US PPI data at 1.30pm, Fed Chair Yellen speaks at 3pm followed by FOMC member Kaplan taking the stage at 6pm GMT.
Levels to watch/live orders:
- Buys: Flat (stop loss: N/A).
- Sells: Flat (stop loss: N/A).
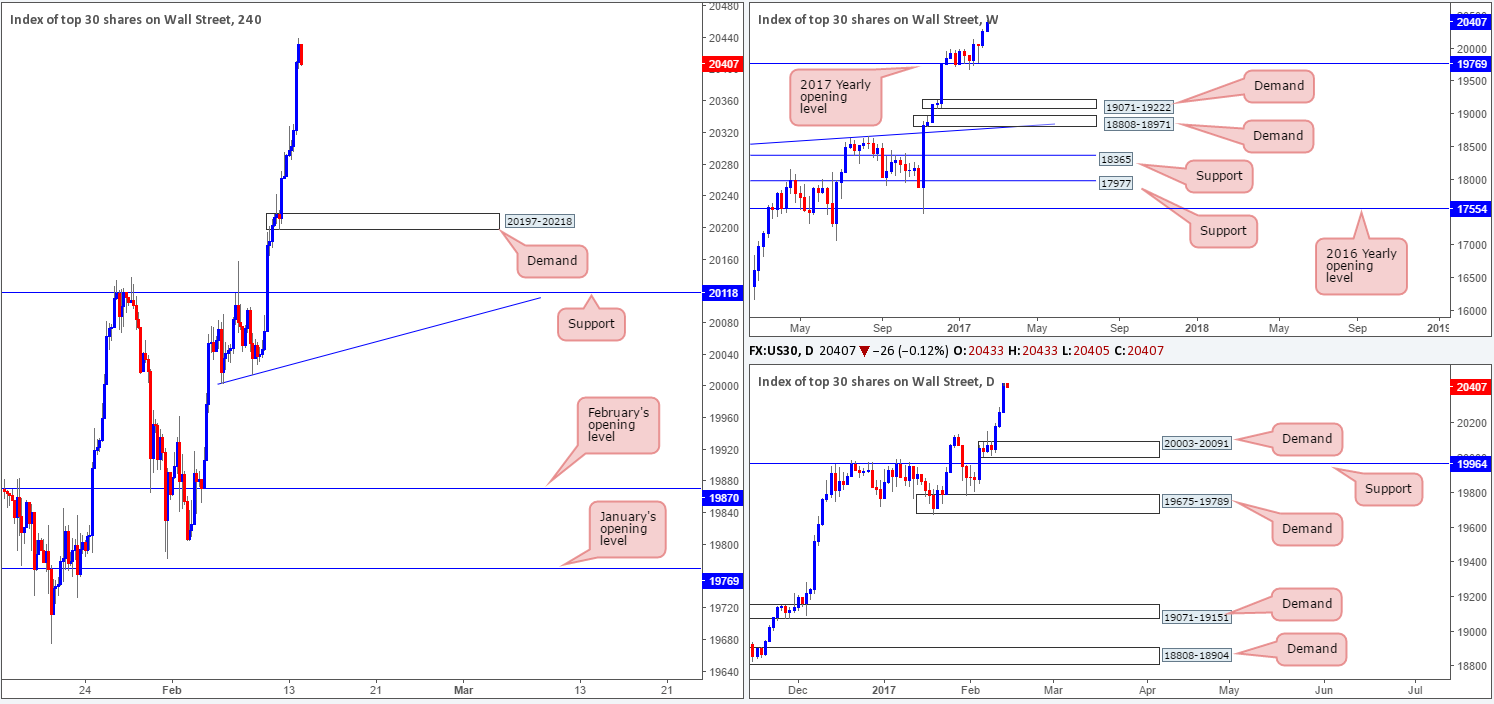
DOW 30:
The DOW is absolutely on fire! The market extended Friday’s gains yesterday, allowing the unit to tap fresh record highs of 20440. According to Bloomberg, banks rallied and investors continued to assess corporate earnings that are posting the best growth since 2014.
Given that there is absolutely no weekly resistance levels in sight, the best we can do for the time being is continue looking to ‘buy the dips’. The closest higher-timeframe area can be seen at 20003-20091: a daily demand that is positioned directly above a daily support barrier at 19964.
Our suggestions: While the H4 demand area at 20197-20218 boasts little higher-timeframe (structural) convergence and sits quite a distance from current price, there is very little else to work with at the moment! Despite this H4 demand positioned in-line with the current uptrend, trading this area without additional confirmation, nevertheless, is not something our desk would be comfortable with. Waiting for a reasonably sized H4 bull candle to print before pressing the buy button would, in our opinion, be the safer route to take here.
Data points to consider: US PPI data at 1.30pm, Fed Chair Yellen speaks at 3pm followed by FOMC member Kaplan taking the stage at 6pm GMT.
Levels to watch/live orders:
- Buys: 20197-20218 ([wait for a H4 bull candle to form before looking to execute a trade] stop loss: ideally beyond the trigger candle).
- Sells: Flat (stop loss: N/A).
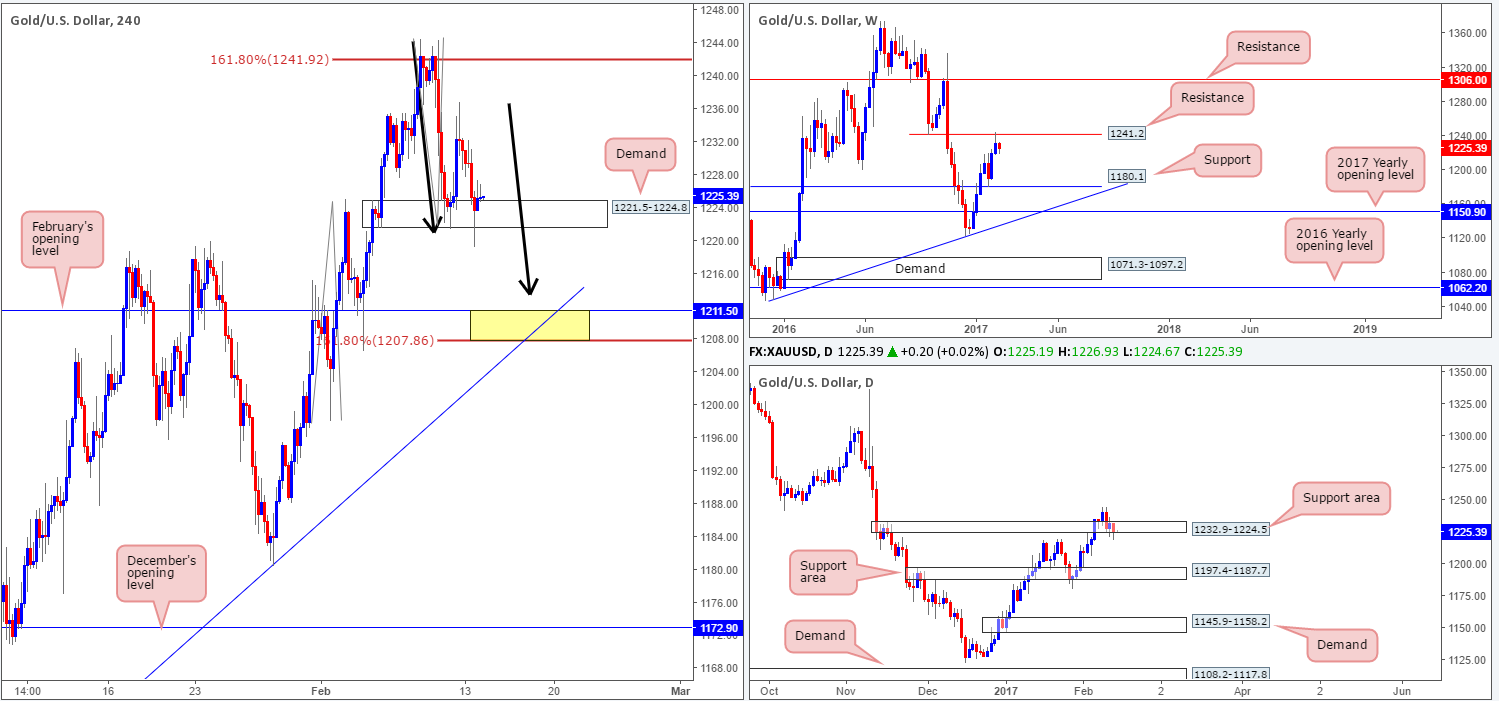
GOLD:
For those who have been following our reports on gold recently you may recall our desk highlighting a short position we took from 1239.6, with a stop logged in at 1245.4. As mentioned in Friday’s report, we liquidated 70% of the position around the H4 demand area at 1227.6-1230.5 and reduced risk to breakeven. Our next port of call for profit taking is still seen at February’s opening base drawn from 1211.5. However, before this can be achieved, price will have to overcome the H4 demand area seen at 1221.5-1224.8.
Fortunately for us, bullion fell to the downside during Monday’s segment and also pierced below the above noted H4 demand. Whether or not this move was enough to consume the majority of stop orders beyond this zone is difficult to tell. However, what we will say is that the H4 candles have yet to generate any follow-through buying following the whipsaw, and instead reflect somewhat of a bearish tone at present.
The above – coupled with an upside rejection being seen from the underside of a weekly resistance level at 1241.2, and a very weak-looking daily support area at 1232.9-1224.5, could trigger further selling today.
Our suggestions: What is still quite notable from recent trade is the possible H4 AB=CD pattern (see black arrows) terminating at the H4 161.8% ext. at 1207.8. Notice that it not only bottoms nearby the February opening level at 1211.5, it is also located nearby a H4 trendline support etched from the low 1145.9 (1207.8/1211.5 zone). Not only is this a reasonable area to take profits on our current short position at 1239.6, it’s also a platform in which one could potentially hunt for long opportunities. With this area lacking higher-timeframe (structural) convergence, however, we would require a H4 bull candle to form here in order to validate this area before pulling the trigger.
Levels to watch/live orders:
- Buys: 1207.8/1211.5 ([wait for a H4 bull candle to form before looking to execute a trade] stop loss: ideally beyond the trigger candle).
- Sells: 1239.6 ([live order] stop loss: breakeven).


