EUR/USD:
For the most part it was a relatively quiet Monday.
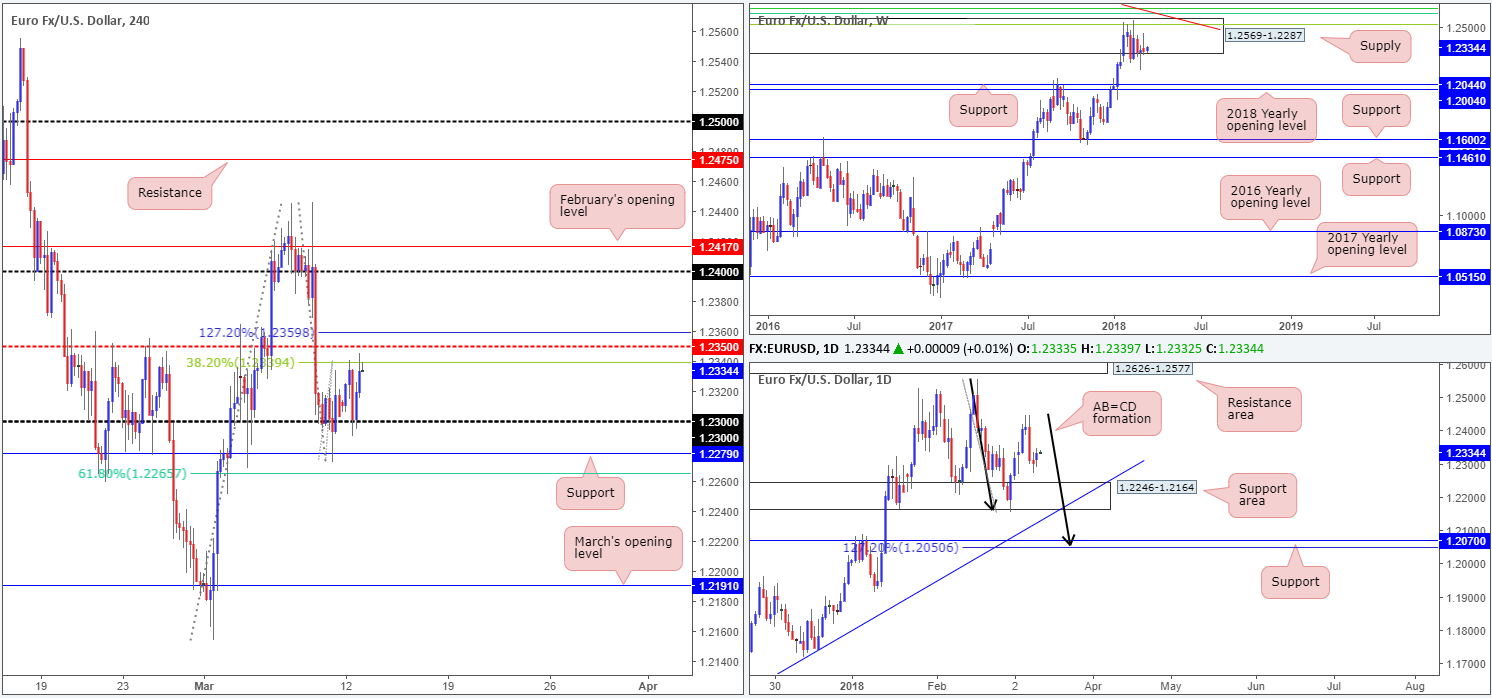
The euro found a base of support at the 1.23 handle and continued to claw back losses seen in the aftermath of the ECB’s meet last week. The rebound also took place amid a deterioration of the USD, dropping back below the 90.00 mark on the US dollar index. The H4 candles ended the day retesting the 38.2% H4 Fib resistance at 1.2339, which, as you can see, is shadowed closely by a H4 mid-level resistance at 1.2350 and a 127.2% H4 Fib ext. point at 1.2359.
Since late January, upside has been capped by a major-league weekly supply zone coming in at 1.2569-1.2287. Should sellers crank it up a gear this week, downside targets fall in around the weekly support band at 1.2044, followed closely by the 2018 yearly opening level at 1.2004. Daily action, on the other hand, reveals that the major has been interacting with a daily support zone at 1.2246-1.2164, which intersects with a daily trendline support etched from the low 1.0569. Also seen nearby is a daily support at 1.2070 – note that this level fuses nicely with a daily AB=CD (black arrows) 127.2% Fib ext. point at 1.2050.
Potential trading zones:
Technically, a selloff from the 1.2359/1.2339 area on the H4 timeframe could very well take place amid trade today. We say this not only because the 1.2350 point boasts a robust history, but also due to where we are currently positioned on the weekly timeframe: supply. Downside targets from the H4 zone fall in at 1.23, followed by H4 support at 1.2279/H4 61.8% Fib support at 1.2265.
Data points to consider: US inflation figures m/m at 12.30pm GMT.
Areas worthy of attention:
Supports: 1.23 handle; 1.2246-1.2164; daily trendline support; 1.2050/1.2070; 1.2004/1.2044.
Resistances: 1.2350; 1.2333; 1.2359; 1.2569-1.2287.
GBP/USD:
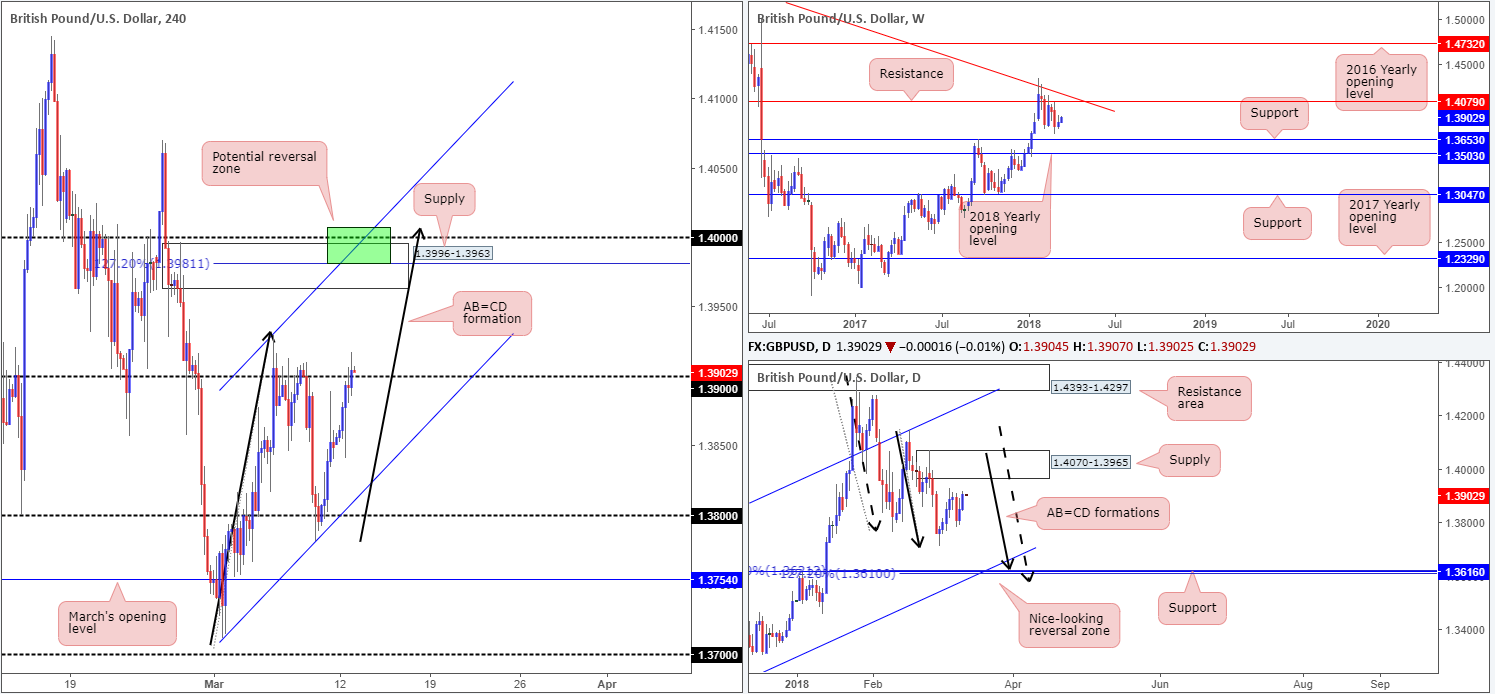
The British pound rose higher against its US counterpart amid Monday’s segment, concluding trade marginally above the 1.39 handle. The pair found bids following news that the UK is close on the Brexit implementation period with the EU.
The recent push above 1.39 has brought the key level 1.40 into the picture – the 1.4008/1.3981 area to be more specific (green zone). Besides this level being a widely watched number, seen nearby is also a fresh H4 supply area at 1.3996-1.3963, a H4 channel resistance taken from the high 1.3929 and a H4 AB=CD (black arrows) 127.2% Fib ext. point at 1.3981. Also notable from a technical perspective is the fact that the aforesaid H4 zone is seen housed within the walls of a daily supply base coming in at 1.4070-1.3965.
Potential trading zones:
A short from the green H4 zone at 1.4008/1.3981 is high probability, in our humble view. As price is trading a fair distance from this area, identifying take-profit levels is tricky at this time – best to wait for the approach to complete.
Intraday traders may also be interested in longs above 1.39, targeting the H4 sell zone. As always, though, it’s best to allow price to retest these numbers before pulling the trigger. Being caught in a fakeout is never fun!
Data points to consider: UK annual budget release at 11.30am; US inflation figures m/m at 12.30pm GMT.
Areas worthy of attention:
Supports: 1.39 handle.
Resistances: 1.40 handle; 1.4008/1.3981; 1.4070-1.3965.
AUD/USD:
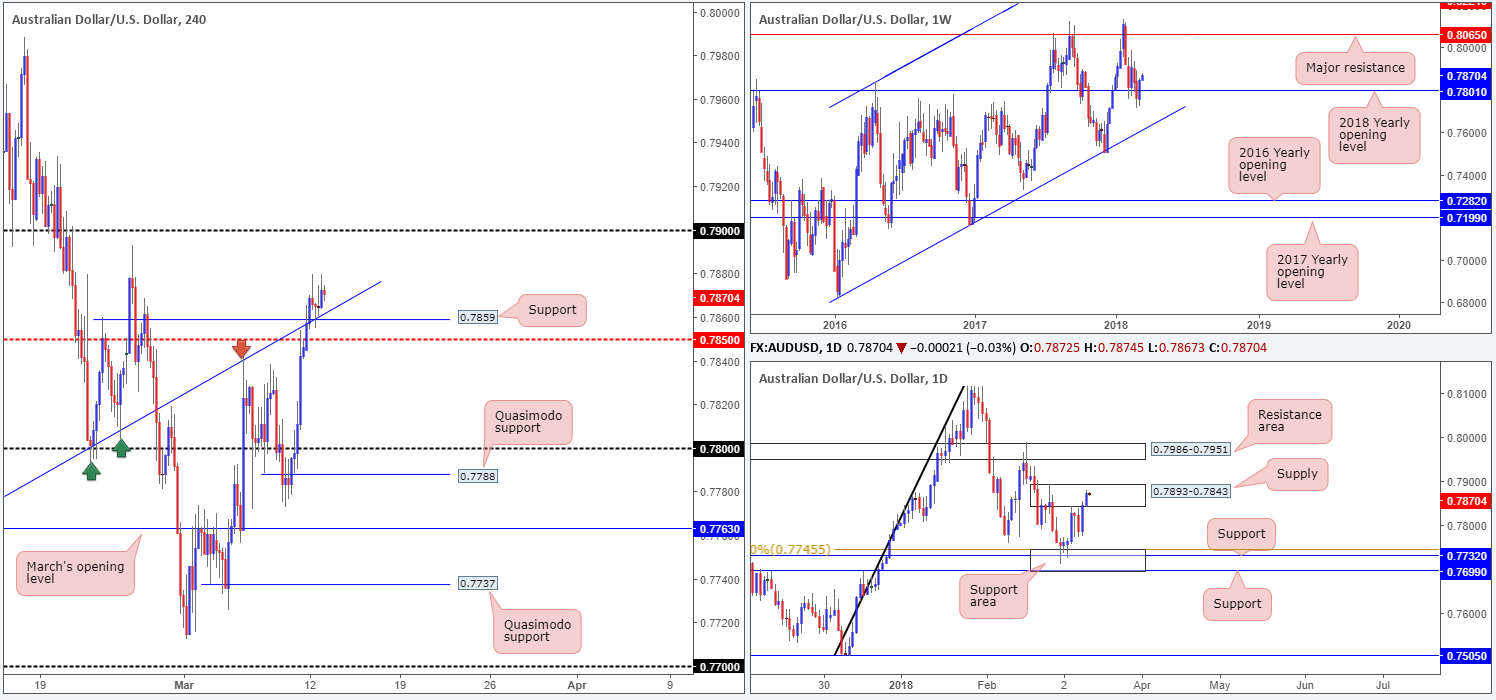
Spurred on by a fragile US dollar, the commodity currency recently sliced above the H4 mid-level point at 0.7850 and also took out a H4 Quasimodo resistance at 0.7859, along with its intersecting H4 trendline taken from the low 0.7758. As you can see, though, the broken H4 Quasimodo and trendline were later retested and held as support.
While Monday’s movement is considered bullish and has potentially opened the doors for a move up to the 0.79 band, one thing to keep in mind here is the daily candles are currently seen trading within the limits of a daily supply base penciled in at 0.7893-0.7843. On the plus side, however, let’s also take into account that the AUD/USD posted a strong week of gains in recent trade, recouping all of the prior week’s losses and reclaiming the 2018 yearly opening level (a support) on the weekly timeframe at 0.7801.
Potential trading zones:
Although daily supply is in the picture, we believe the retest of the recently broken H4 resistances, along with weekly price showing promise, could prompt further buying. To take advantage of this move, you might consider entering long on a second retest of 0.7859 today, placing protective stops beyond the 0.7850 band and targeting 0.79 as an initial take-profit level.
Data points to consider: RBA Assist Gov. Kent speaks at 10.10pm; US inflation figures m/m at 12.30pm GMT.
Areas worthy of attention:
Supports: 0.7859; H4 trendline support; 0.7850; 0.7801.
Resistances: 0.7893-0.7843; 0.79 handle.
USD/JPY:
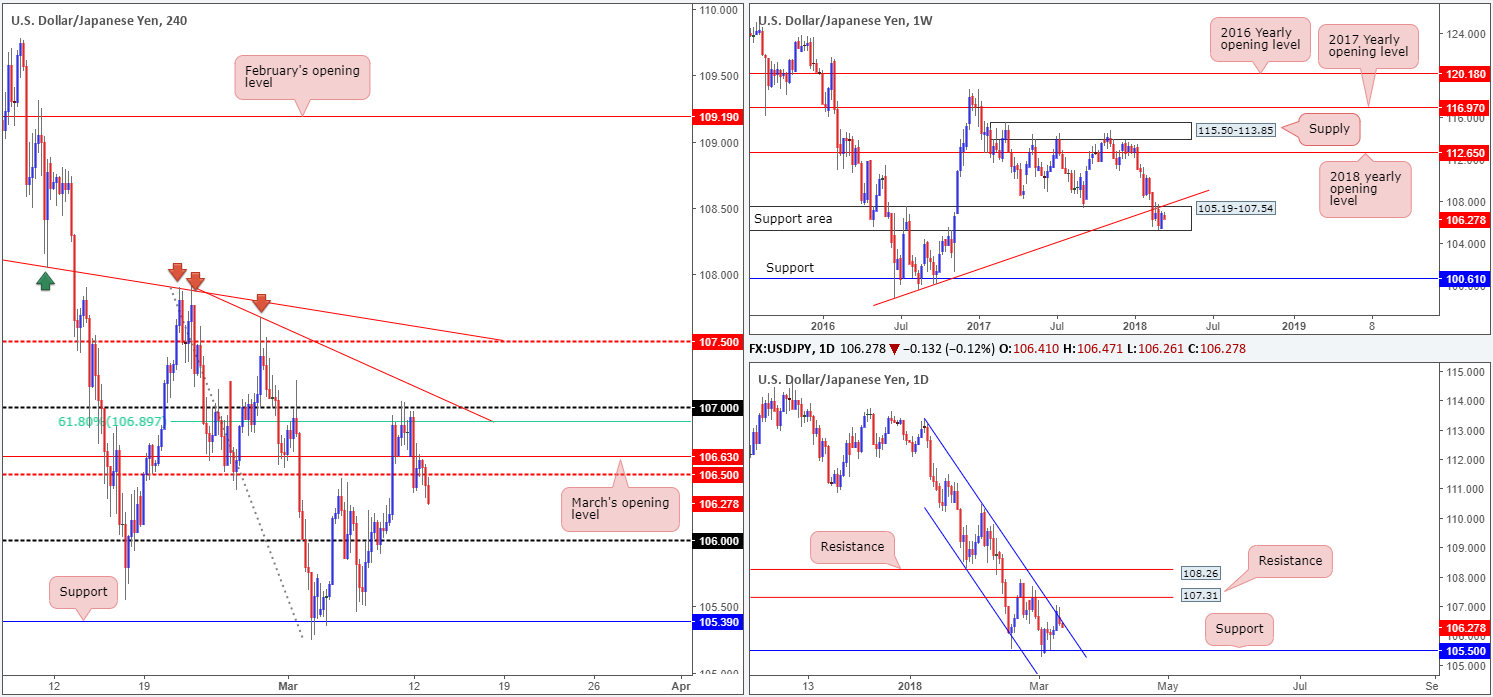
In recent sessions, we’ve seen the USD/JPY trade in negative territory, breaking through both March’s opening level at 106.63 and the H4 mid-level point 106.50. At present, the pair is seen trading at 106.27 and appears to be eyeing the 106 handle as its next port of call.
On the daily timeframe, price action is seen grinding alongside a daily channel resistance line taken from the high 113.38, which has been in motion since the beginning of the year. On the other side of the field, weekly movement remains within a weekly support area at 105.19-107.54 but continues to reflect a bearish tone below the nearby weekly trendline support-turned resistance etched from the low 98.78.
Potential trading zones:
On the weekly timeframe, buying and selling pressure appears equally weighted as far as structure goes. Daily flow, on the other hand, looks as though it may be on the verge of pressing lower, which could be enough to pressure the unit down to the 106 handle seen on the H4 timeframe. Therefore, a retest of 106.63/106.50 (March’s opening band/mid-level point) could be something to keep an eye out for today.
For those considering longs from 106, you might want to note that a possible fakeout down to a H4 Quasimodo left shoulder marked by a red arrow at 105.85 is potentially on the cards. Therefore, do try and factor this in with regards to stop-loss placement.
Data points to consider: US inflation figures m/m at 12.30pm GMT.
Areas worthy of attention:
Supports: 106 handle; 105.85; 105.19-107.54.
Resistances: 106.50; 106.63; daily channel resistance; weekly trendline resistance.
USD/CAD:
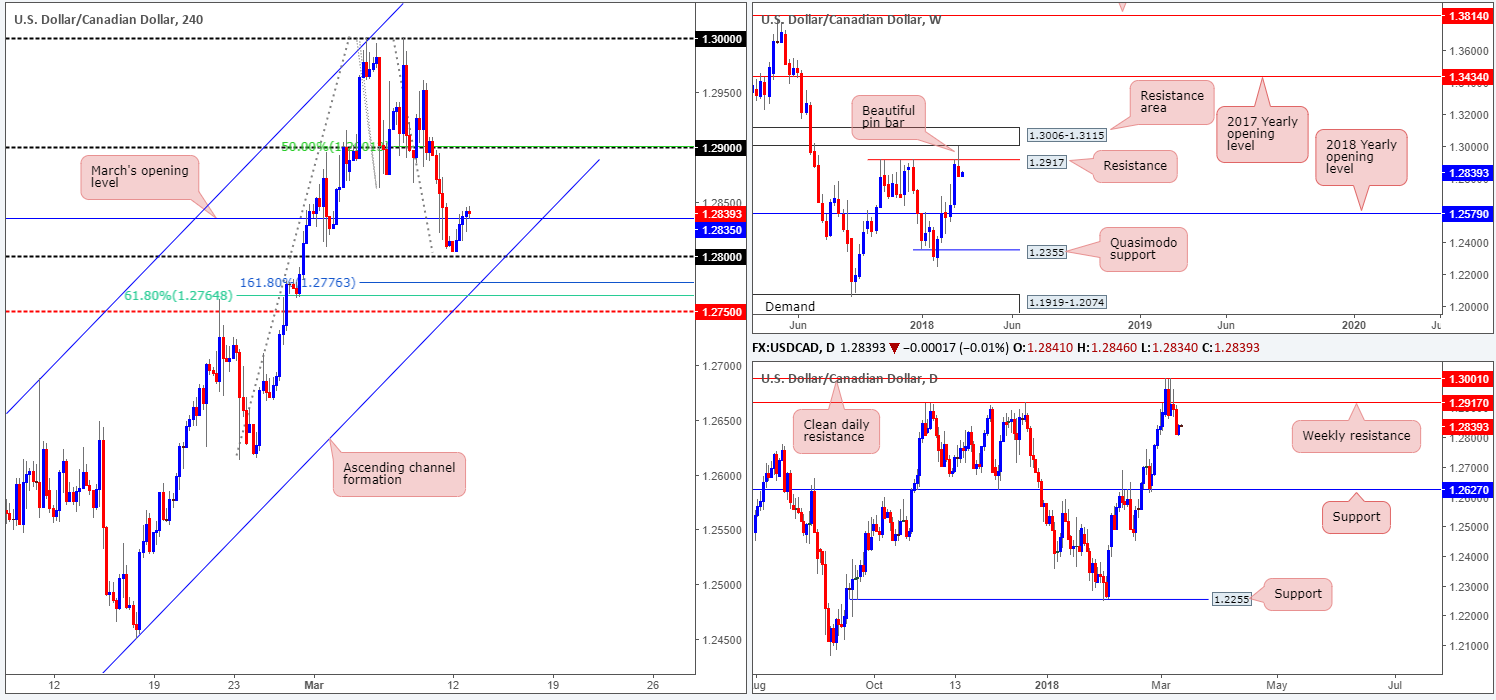
Leaving the 1.28 handle unchallenged, the USD/CAD modestly advanced against its Canadian counterpart on Monday and eventually reclaimed March’s opening level seen at 1.2835. Providing that this level remains intact, traders will likely have their crosshairs pinned on 1.29, which happens to align with a H4 50.0% resistance value.
A quick look at both the weekly and daily charts, however, suggests that the bulls lack oomph. Weekly flow printed a nice-looking bearish pin-bar formation last week, following a near-touch of a weekly resistance area at 1.3006-1.3115. Downside appears free from this point until we shake hands with the 2018 yearly opening level at 1.2579. On the daily timeframe, further selling is also probable, with the daily support level etched from 1.2627 to target.
Potential trading zones:
With little to no higher-timeframe support bolstering March’s opening level on the H4 timeframe, taking a long based off of this level is not something we’d label high probability. The risk of sellers making an appearance is just too great, in our humble view.
As downside is restricted by March’s open level and a nearby round number at 1.28, as well as a collection of additional H4 supports seen close by, the team would also advise caution selling at this time.
Data points to consider: US inflation figures m/m at 12.30pm; BoC Gov. Poloz speaks at 2.15pm GMT.
Areas worthy of attention:
Supports: 1.2835; 1.28 handle; 1.2579; 1.2627.
Resistances: 1.29 handle; 1.3006-1.3115.
USD/CHF:
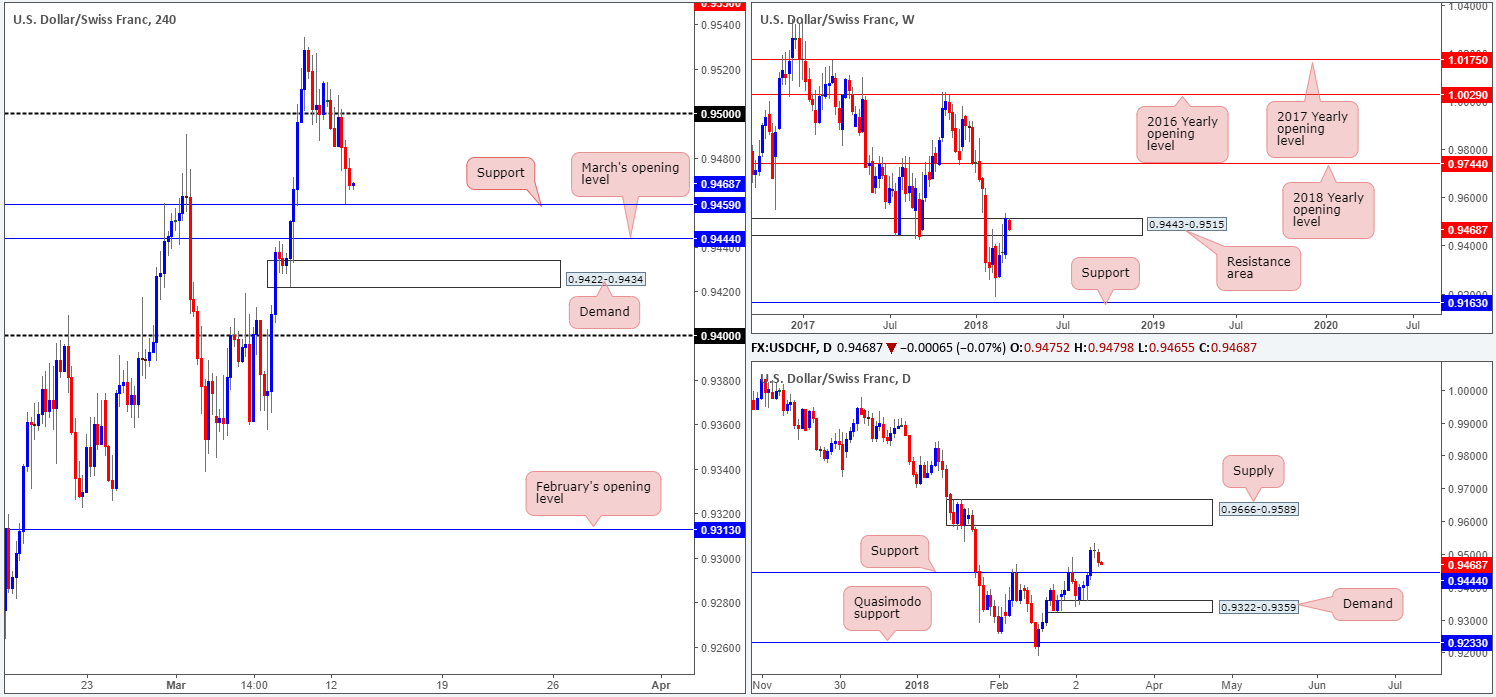
Kicking things off from te top this morning, we can clearly see that weekly price is attempting to defend a weekly resistance area at 0.9443-0.9515. However, it’s far too early to tell whether this will amount to anything, since let’s remember last week’s flow closed in strong fashion and even slightly peeked above the noted weekly resistance area. Another essential point to consider is the daily support at 0.9444. This is the next downside target on the daily scale. A break of this base would likely confirm further downside to daily demand seen at 0.9322-0.9359.
Over on the H4 candles, the 0.95 handle, as you can see, gave way in the early hours of trade on Monday, opening up downside for the unit to cross swords with H4 support pegged at 0.9459. While this level is holding ground for now, there has not been much meaningful H4 buying printed from here, which could lead to a test of March’s opening level seen nearby at 0.9444 (essentially represents the daily support mentioned above), followed closely by a nice-looking H4 demand at 0.9422-0.9434.
Potential trading zones:
0.9444 is an interesting base. With it representing a monthly opening level and a daily support level, the odds of a reaction being seen from this angle is high, in our opinion. What we also like about the level is the H4 demand plotted just beneath it. This is an ideal area to catch any fakeout through 0.9444.
Should traders long 0.9444, look for H4 price to close above 0.9459. This will be a cue to begin looking to reduce risk and think about trailing price up 0.95 as an initial take-profit line.
Data points to consider: US inflation figures m/m at 12.30pm GMT.
Areas worthy of attention:
Supports: 0.9459; 0.9444; 0.9422-0.9434.
Resistances: 0.95 handle; 0.9443-0.9515; 0.9666-0.9589.
DOW 30:
The blue-chip DJIA index drifted into negative territory, despite a solid start to Monday’s session. Industry-related stocks were responsible for the slump, down 0.8% on the day.
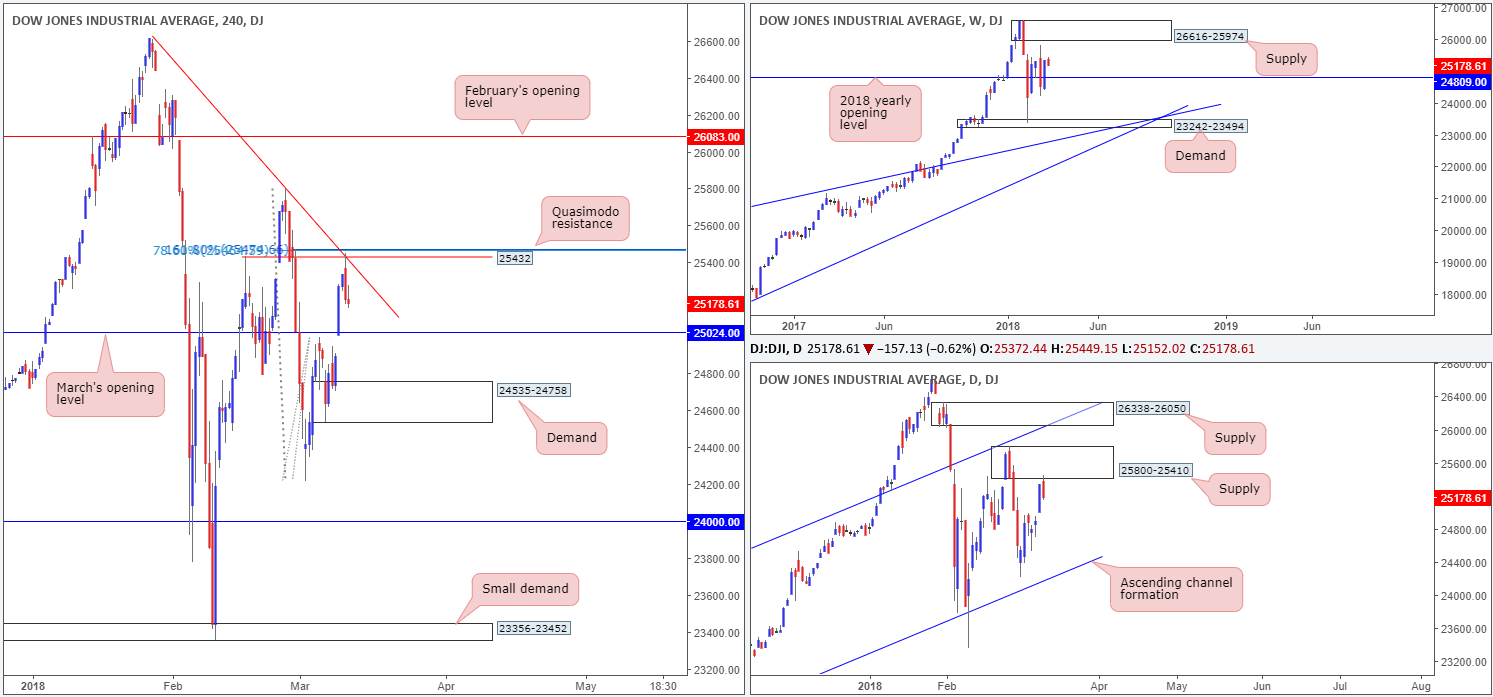
For those who read Monday’s morning report you may recall the team highlighting a possible sell at a H4 Quasimodo resistance level drawn from 25432. Our reasoning behind this was simply due to the level fusing with a 78.6% H4 Fib resistance level at 25472, a 161.8% H4 Fib ext. point at 25472 and a H4 trendline resistance extended from the high 26616. Well done to those who took advantage of this move. The next port of call can be seen in the form of March’s opening level at 25024.
Weekly price remains above the 2018 yearly opening level at 24809. Sustained buying could eventually lead to a test of weekly supply plotted at 26616-25974. Daily price, overall, remains confined within a daily ascending channel formation fixed from 17883/21169. Near term, however, the unit is seen selling off from daily supply coming in at 25800-25410.
Potential trading zones:
Apart from 25432 highlighted on Monday, the only other area which really stands out at the moment is the H4 demand at 24535-24758. Although we’re not particularly impressed by the demand’s structure, we do like the fact that the 2018 yearly opening level at 24809 is planted just above it. Therefore, this could be an area to consider trading for an intraday bounce.
Data points to consider: US inflation figures m/m at 12.30pm GMT.
Areas worthy of attention:
Supports: 25024; 24535-24758; 24809.
Resistances: 25432; 26616-25974; 25800-25410.
GOLD:
For those who read Monday’s report you may remember the team underscoring March’s opening level at 1317.2 for a potential retest play. What we liked about it is not only did it boast a 61.8% H4 Fib support, it was also positioned nearby a newly formed H4 Quasimodo support at 1316.7 and bolstered by a daily support zone marked in blue at 1308.4/1316.9 (notice the back-to-back daily buying tails). As is evident from the H4 timeframe, a retest was seen and the level held nicely, bringing H4 price action up to just ahead of a H4 resistance area notched at 1329.0-1326.3.
Potential trading zones:
This is a somewhat tricky market to navigate at the moment.
Buying is difficult due to the H4 resistance area at 1329.0-1326.3. Thinking of waiting for this area to be consumed? Usually this is a reasonable approach, but when there’s a daily supply zone printed just above it at 1341.0-1333.1, it’s going to be a challenge!
In regard to selling this is equally as restricted given the current daily support area and two daily buying tails!
In the absence of clearer price action, opting to stand on the sidelines may very well be the better path to take today.

Areas worthy of attention:
Supports: 1317.2/1316.7; 1308.4/1316.9.
Resistances: 1341.0-1333.1; 1329.0-1326.3.
This site has been designed for informational and educational purposes only and does not constitute an offer to sell nor a solicitation of an offer to buy any products which may be referenced upon the site. The services and information provided through this site are for personal, non-commercial, educational use and display. IC Markets does not provide personal trading advice through this site and does not represent that the products or services discussed are suitable for any trader. Traders are advised not to rely on any information contained in the site in the process of making a fully informed decision.
This site may include market analysis. All ideas, opinions, and/or forecasts, expressed or implied herein, information, charts or examples contained in the lessons, are for informational and educational purposes only and should not be construed as a recommendation to invest, trade, and/or speculate in the markets. Any trades, and/or speculations made in light of the ideas, opinions, and/or forecasts, expressed or implied herein, are committed at your own risk, financial or otherwise.
The use of the site is agreement that the site is for informational and educational purposes only and does not constitute advice in any form in the furtherance of any trade or trading decisions.
The accuracy, completeness and timeliness of the information contained on this site cannot be guaranteed. IC Markets does not warranty, guarantee or make any representations, or assume any liability with regard to financial results based on the use of the information in the site.
News, views, opinions, recommendations and other information obtained from sources outside of www.icmarkets.com.au, used in this site are believed to be reliable, but we cannot guarantee their accuracy or completeness. All such information is subject to change at any time without notice. IC Markets assumes no responsibility for the content of any linked site. The fact that such links may exist does not indicate approval or endorsement of any material contained on any linked site.
IC Markets is not liable for any harm caused by the transmission, through accessing the services or information on this site, of a computer virus, or other computer code or programming device that might be used to access, delete, damage, disable, disrupt or otherwise impede in any manner, the operation of the site or of any user’s software, hardware, data or property.