EUR/USD:
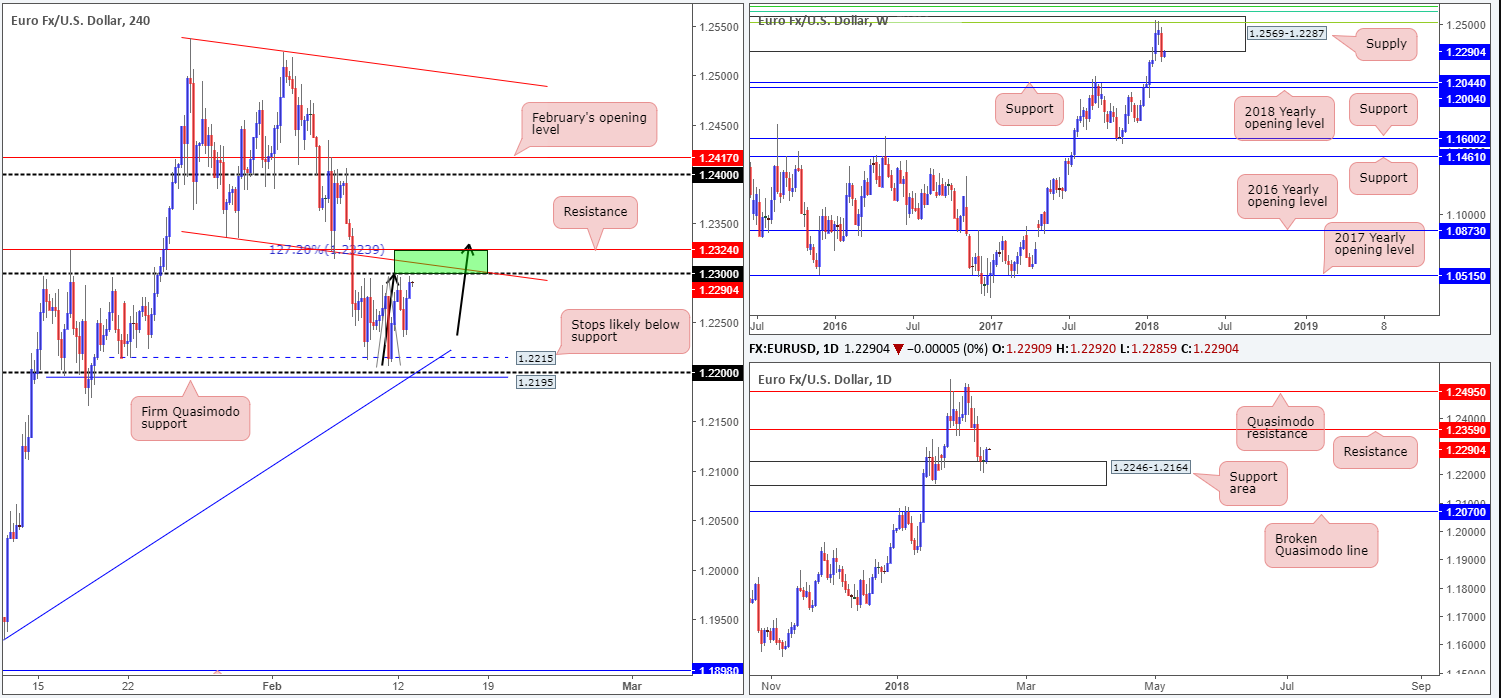
The euro closed marginally higher on Monday, bringing price up to within reaching distance of the 1.23 handle on the H4 timeframe. The fact that this psychological band also merges closely with a H4 channel support-turned resistance (taken from the low 1.2336), a H4 resistance at 1.2324 and an aligning H4 AB=CD (see black arrows) 127.2% Fib ext. point at 1.2323 is, we believe, something to pay attention to (green zone marked between 1.2324/1.23).
As was emphasized in Monday’s analysis, weekly sellers printed a strong selling candle from within the walls of a weekly supply at 1.2569-1.2287 last week, consequently breaking a reasonably dominant seven-week bullish phase. This has potentially set the stage for a continuation move down to weekly support at 1.2044, followed closely by the 2018 yearly opening line at 1.2004. Another essential point to consider here is that the US dollar index is seen trading from a huge monthly support plotted at 88.50 (remember the EUR/USD and USDX are inversely correlated).
A closer look at the market through the daily timeframe, however, shows that the unit recently bumped heads with a daily support area at 1.2246-1.2164 and printed a somewhat strong rotation to the upside.
Potential trading zones:
We feel the green H4 zone, which captures all noted H4 structures at 1.2324/1.23, is an ideal location to be looking for short setups today, with target objectives set at 1.2250ish, followed by H4 support at 1.2215/1.22.
The only grumble to selling the green zone is, of course, the current daily support area. While this is a rational concern, the confidence in the H4 zone comes from the position of weekly price at the moment.
Data points to consider: FOMC member Mester speaks at 1pm GMT.
Areas worthy of attention:
Supports: 1.2195; H4 trendline support; 1.22 handle; 1.2215; 1.2246-1.2164; 1.2070; 1.2044; 1.2004.
Resistances: 1.2569-1.2287; 1.2359; 1.23 handle; H4 channel resistance; 1.2340.
GBP/USD:
Along similar lines to the EUR/USD, the GBP/USD was also reasonably subdued on Monday.
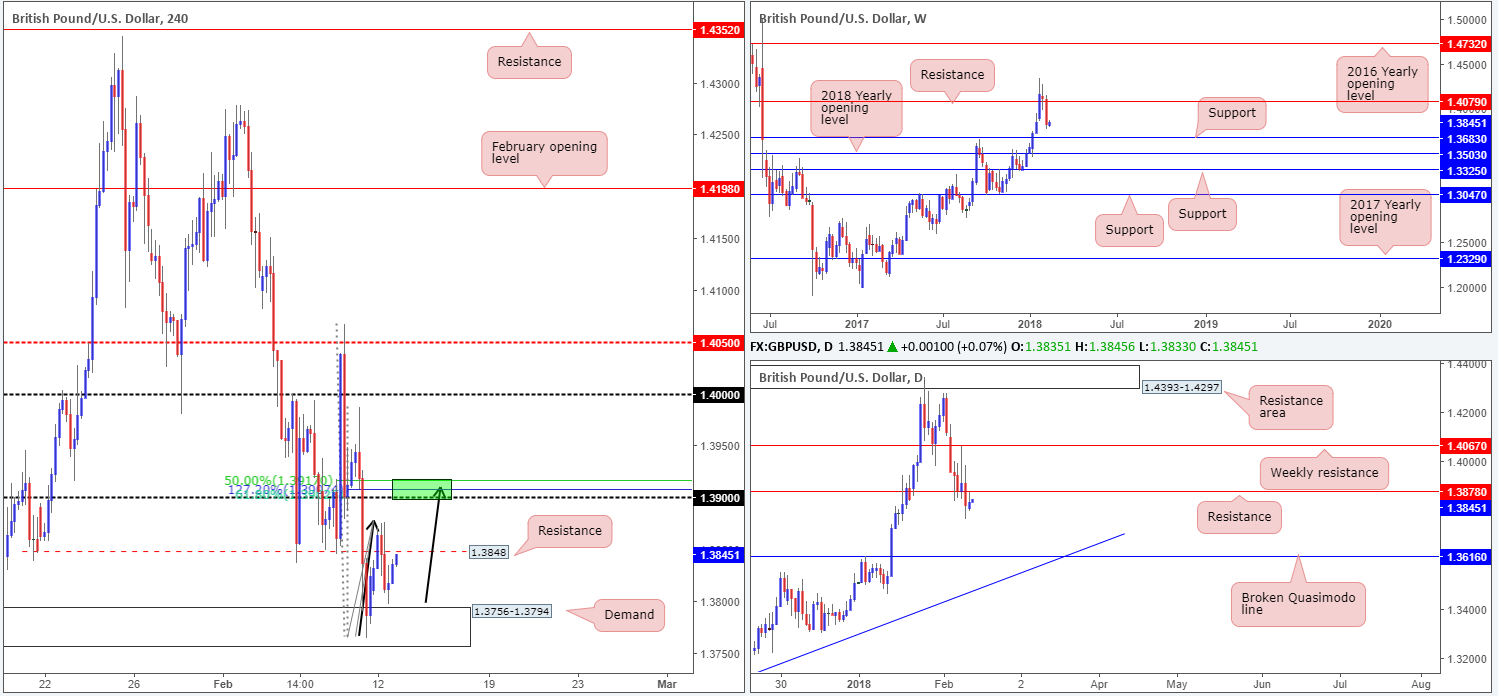
H4 price did, however, attempt to head higher, but failed to sustain gains beyond a local H4 resistance printed at 1.3848.This, technically speaking, was likely due to a daily resistance located a few pips above at 1.3878.
Although H4 price looks as though it will take another crack at breaching H4 resistance today, traders need to take into account that both weekly and daily structure indicate further downside could be on the cards.
Weekly price shows room to stretch down to a support band coming in at 1.3683. Daily movement also appears to have recently unlocked the door to a void as there’s little support on this scale seen stopping price action from extending losses this week until we collide with a daily broken Quasimodo line at 1.3616 (sited below the aforementioned weekly support).
Potential trading zones:
From a technical perspective, the only area that stands out to us this morning is the green H4 zone marked at 1.3917/1.39. Comprised of a round number at 1.39, a 50.0% resistance value at 1.3917, a 61.8% Fib resistance at 1.3901 and an AB=CD (black arrows) 127.2% Fib ext. point at 1.3907, this area has ‘sell zone’ written all over it. Should the bears respond from here, the first port of call to watch for is the current H4 resistance at 1.3848, which will then be acting support.
Data points to consider: UK inflation figures at 9.30am; FOMC member Mester speaks at 1pm GMT.
Areas worthy of attention:
Supports: 1.3756-1.3794; 1.3683; 1.3616.
Resistances: 1.3848; 1.3878; 1.3917/1.39.
AUD/USD:
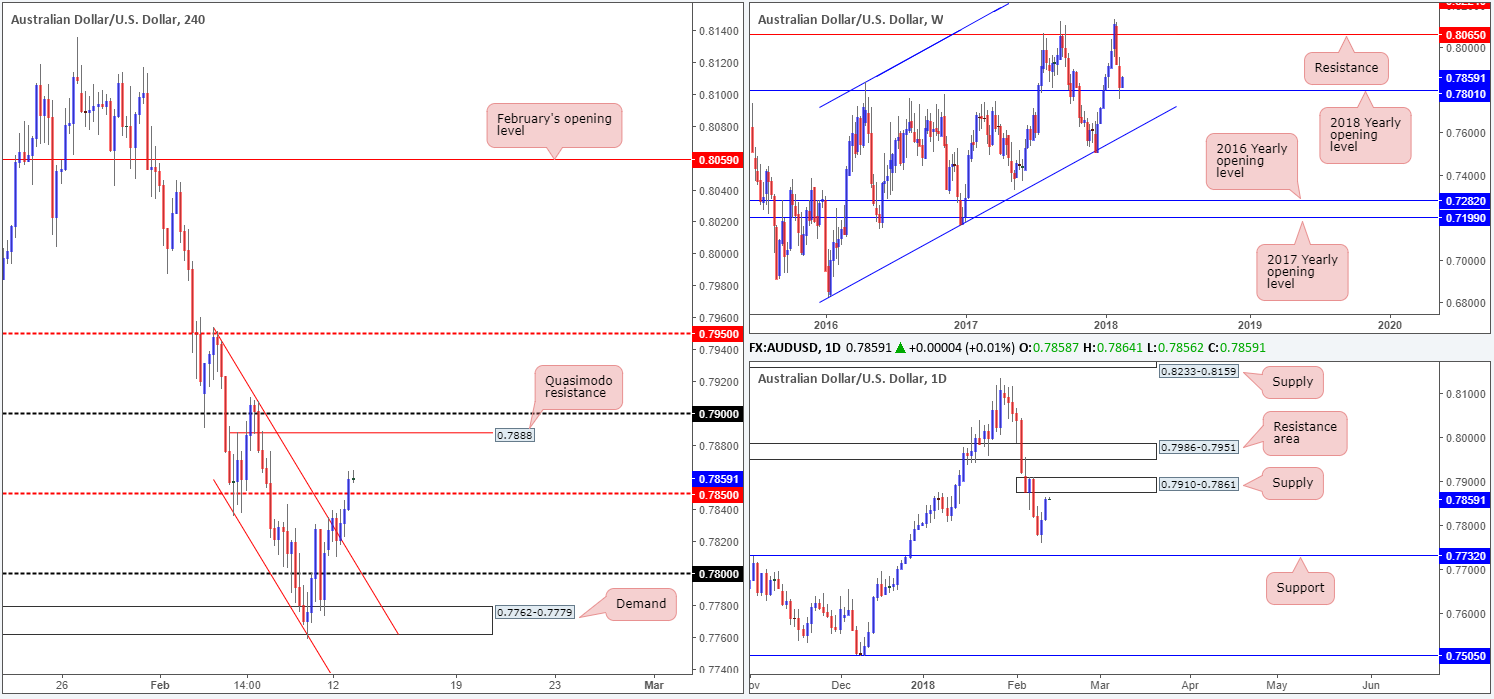
Kicking this morning’s report off from the top, we can clearly see that weekly price is showing promise from the 2018 yearly opening level at 0.7801. Continued buying from this region could lead to the commodity currency revisiting weekly resistance at 0.8065. Before the weekly candles can achieve higher prices, nevertheless, both daily supply at 0.7910-0.7861 and a daily resistance area at 0.7986-0.7951 will need to be engulfed.
Branching over to the H4 timeframe, the descending H4 channel resistance (extended from the high 0.7954), along with the H4 mid-level resistance at 0.7850, were both breached on Monday. The next upside target on this scale can be seen at a H4 Quasimodo resistance drawn from 0.7888, shadowed closely by the 0.79 handle. Notice that both of these H4 structures reside within the aforementioned daily supply zone.
Potential trading zones:
Despite the rather impressive correction being seen from the 2018 yearly opening level at the moment, buying right now is not an option, as far as we can see. The daily supply zone is just too close for comfort. We will, however, be keeping a close eye on the H4 Quasimodo resistance mentioned above at 0.7888. These levels, especially when located within higher-timeframe structure, typically bounce price enough for an intraday score. And in this instance, one can actually place their stop-loss order above the said daily supply!
Data points to consider: FOMC member Mester speaks at 1pm GMT.
Areas worthy of attention:
Supports: 0.7850; 0.7801.
Resistances: 0.7910-0.7861; 0.7986-0.7951; 0.788; 0.78 handle.
USD/JPY:
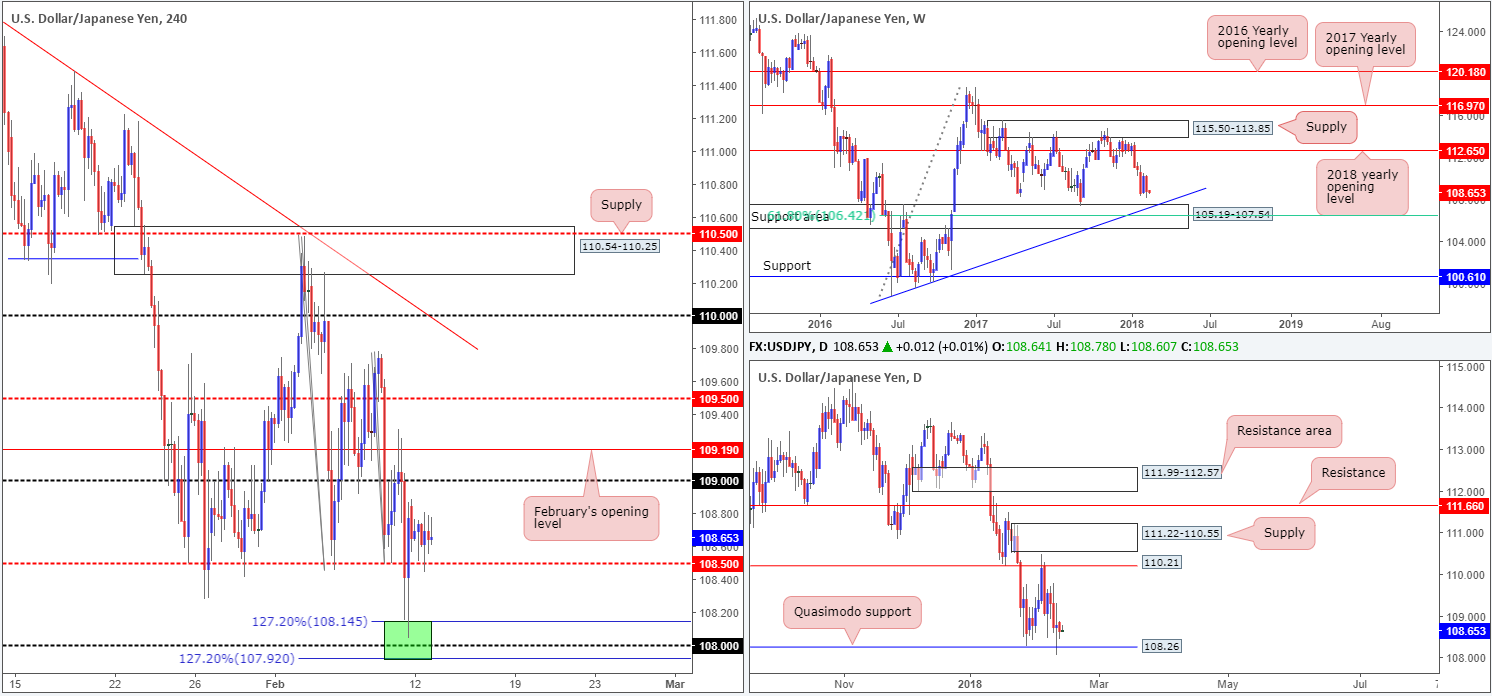
Price took on more of a sober tone during Monday’s segment, tightly consolidating a few pips above the H4 mid-level support at 108.50. As such, much of the following report will echo thoughts put forward in yesterday’s analysis…
Weekly price continues to base just ahead of a weekly support area at 105.19-107.54, which happens to intersect beautifully with a weekly trendline support etched from the low 98.78 and a weekly 61.8% Fib support at 106.42. Traders will also do well to remember that this weekly area has served this market since late 2013, so it is certainly not one to overlook!
Turning the focus down to the daily timeframe, one will see that the basing action on the weekly timeframe is likely due to daily price attempting to carve out a range between a daily Quasimodo support at 108.26 and a daily resistance logged in at 110.21. Also noteworthy here is the head of the aforementioned daily Quasimodo support is bolstered by the current weekly support area.
Potential trading zones:
In a nutshell, this is what we have to work with right now:
- Weekly price could potentially drive down to 107.50ish to connect with the aforementioned weekly structures.
- Daily Quasimodo support in play at 108.26, but appears fragile given Friday’s daily indecision candle.
- H4 action somewhat restricted. Upside limited by the 109 handle and February’s opening line at 109.19. Downside is also limited by 108.50 and the noted daily Quasimodo support at 108.26.
This not a buyers’ market right now. Not only is weekly price pointing to a potential downside move, but nearby H4 resistance structure is just too close for comfort!
The same goes for selling unfortunately. Yes, there is room on the weekly to press lower, and price may respond from 109.19/109 on the H4 timeframe. However, selling into 108.50 and a daily Quasimodo is not really a trade we’d label high probability.
Therefore, seeing as how there is not really a clear path today, remaining on the sidelines continues to be the better play, in our view.
Data points to consider: FOMC member Mester speaks at 1pm GMT.
Areas worthy of attention:
Supports: 107.92/108.14; 108.50; 108.26; weekly trendline support; 105.19-107.54.
Resistances: 109 handle; 109.19; 110.21.
USD/CAD:
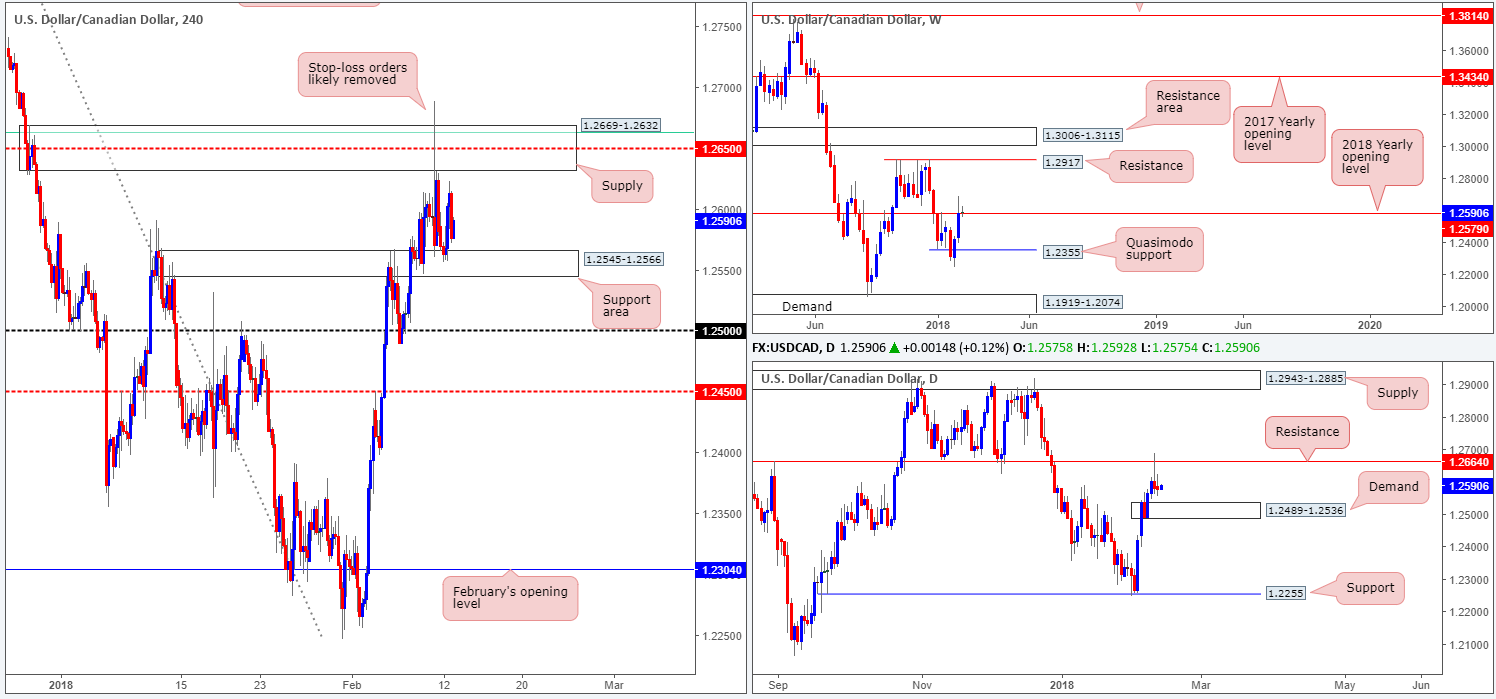
With little high-impacting data on the docket on Monday, it was of little surprise to see the USD/CAD remain reasonably passive.
H4 movement remains limited between H4 supply at 1.2669-1.2632 (houses a H4 61.8% Fib resistance at 1.2663 and H4 mid-level resistance at 1.2650) and a H4 support area coming in at 1.2545-1.2566.
Also in play is the daily resistance level planted at 1.2664 (seen fixed within the upper limits of the aforementioned H4 supply area). Downside from this angle is somewhat limited, though, given the nearby daily demand area seen at 1.2489-1.2536 (positioned just beneath the current H4 support area). In addition to the daily resistance, we can also see that the 2018 yearly opening band at 1.2579 is in view.
Potential trading zones:
Should H4 price revisit the noted H4 supply area today/this week, a short trade could still very well be an option. We say this simply because of the structures seen housed within.
However, seeing as how the H4 zone was faked on Friday, sellers may be guarded. Therefore, you may want to consider waiting for additional H4 candle confirmation in the form of a H4 full or near-full-bodied bearish candle to take shape. This way you can be reasonably confident sellers are involved and price will likely reach the nearby H4 support area at 1.2545-1.2566, thus giving enough room to reduce risk to breakeven.
Data points to consider: FOMC member Mester speaks at 1pm GMT.
Areas worthy of attention:
Supports: 1.2545-1.2566; 1.2489-1.2536; 1.2355.
Resistances: 1.2669-1.2632; 1.2664; 1.2579.
USD/CHF:
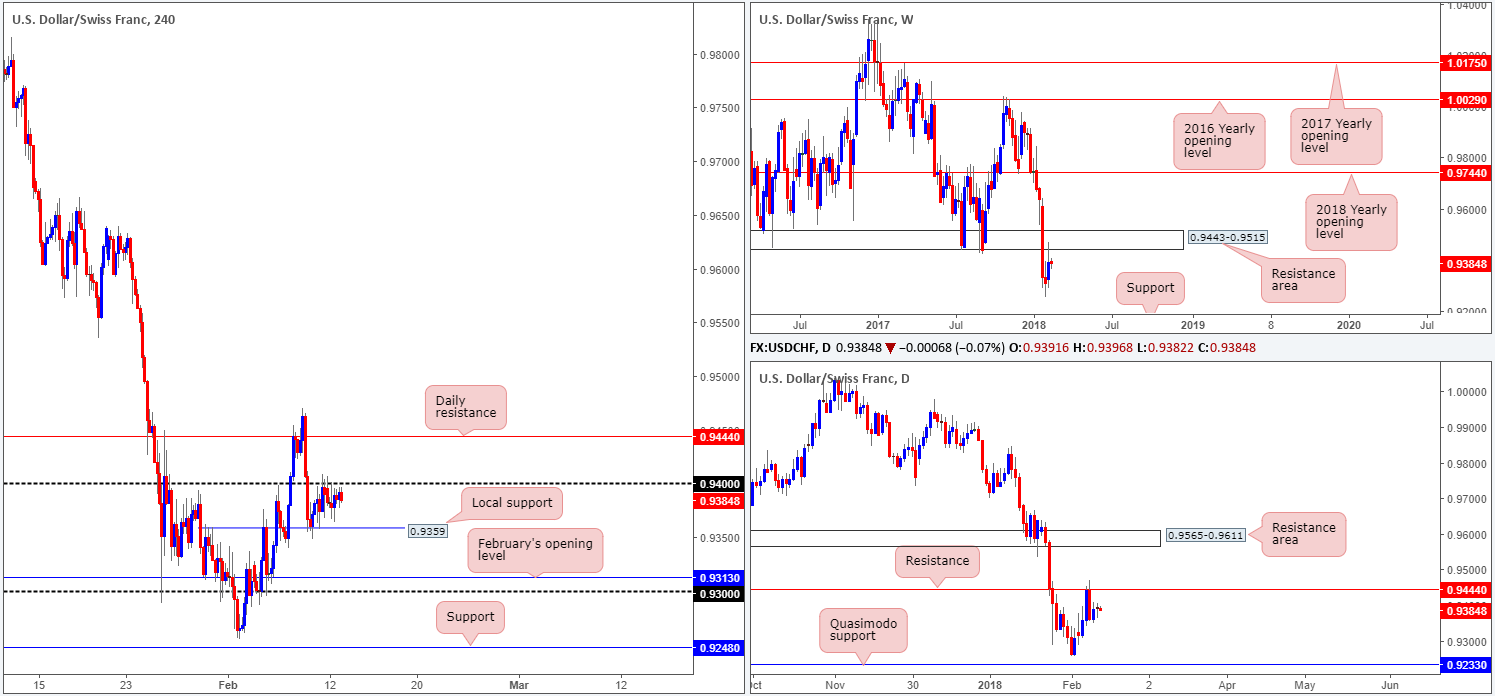
For the most part it was a reasonably quiet session on Monday. H4 price, as you can see, remained capped by the 0.94 handle and a H4 local support pegged at 0.9359. Beyond 0.94, we have our eye on the daily resistance level at 0.9444, whereas beneath 0.9359, the unit’s next downside target can be seen at 0.9313 (February’s opening level), followed closely by the 0.93 handle. It may also be worth noting that the aforementioned daily resistance level represents the underside of a weekly resistance area seen located at 0.9443-0.9515.
From our point of view, we feel this unit is headed lower for two main reasons:
- Both weekly and daily structure shows space to move south. Weekly price has the support level at 0.9163 to target, whereas daily price has the Quasimodo support at 0.9233 in its range.
- The EUR/USD is (see above) trading from a reasonably well-rounded sell zone on the H4 timeframe. The EUR/USD and USD/CHF are inversely correlated markets.
Potential trading zones:
A H4 close below 0.9359 would confirm lower prices, but would also be a difficult move to take advantage of since there’s less than 50 pips of wiggle room between 0.9359 and 0.9313. This would only be possible should one manage to pin down a setup that required a small enough stop-loss order to accommodate a reasonable risk/reward ratio.
Data points to consider: FOMC member Mester speaks at 1pm; CHF PPI m/m at 8.15am GMT.
Areas worthy of attention:
Supports: 0.9359; 0.9313; 0.93 handle; 0.9233; 0.9163.
Resistances: 0.94 handle; 0.9444; 0.9443-0.9515.
DOW 30:
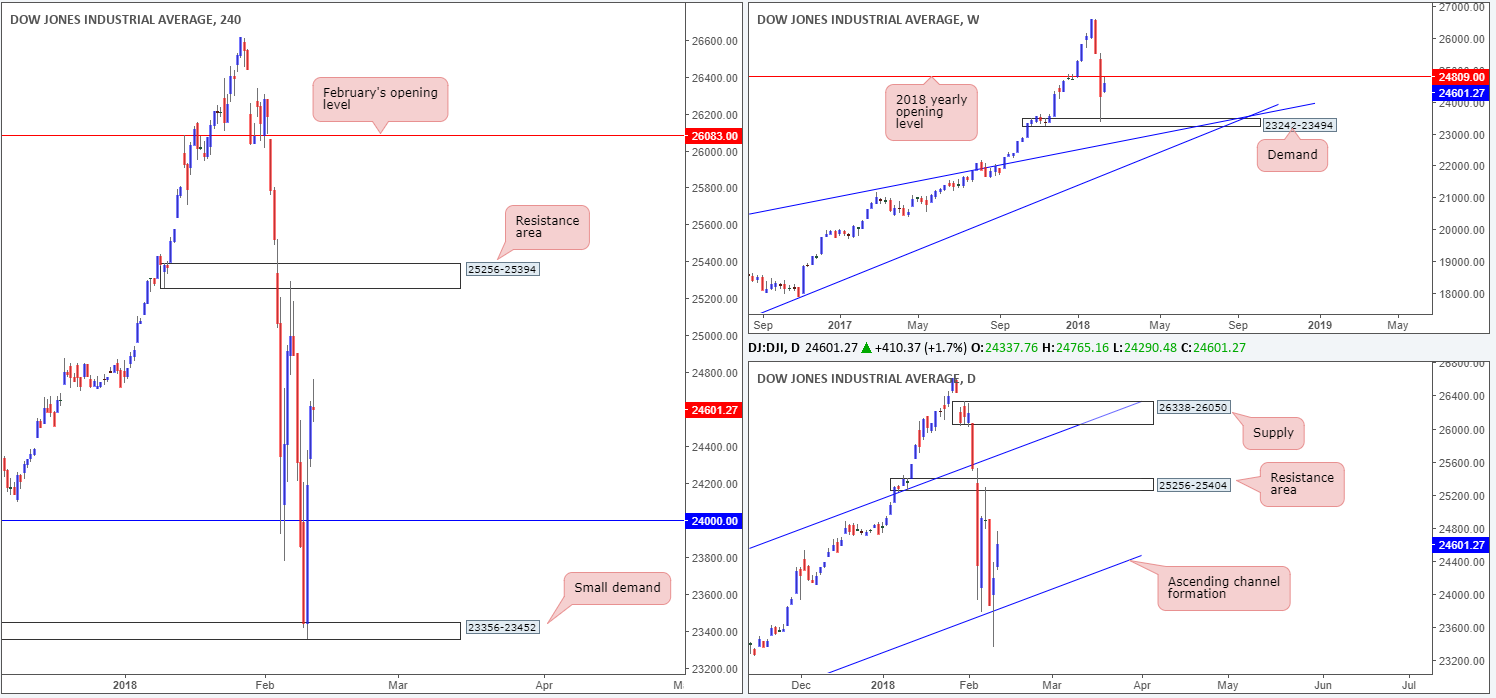
US equities continued to post recovery candles on Monday, reaching session highs of 24765. All three of the major US indexes gained ground, each adding over 1.0% in value. In spite of fears of rising inflation, the DJIA found support in US President Trump’s infrastructure investment plan.
Technically, though, the index could potentially drive lower this week, as the unit is trading within close proximity to the 2018 yearly opening level seen on the weekly timeframe at 24809. This could pull the unit back down to the 24K mark (held as support in recent trade), which aligns with a daily channel support extended from the low 17883.
In the event that price continues to push north, however, H4 price has a resistance area at 25256-25394 to target, which is encased by a daily resistance area coming in at 25256-25404.
Potential trading zones:
Should the H4 unit retest 24K as support today, a long trade could be an option (targeting the H4 resistance area at 25256-25394) as long as H4 price proves buyer intent here. What we mean by this is simply waiting for a H4 full or near-full-bodied bull candle to form, before pulling the trigger. That way you help avoid an unnecessary loss!
Data points to consider: FOMC member Mester speaks at 1pm GMT.
Areas worthy of attention:
Supports: Daily channel support; 23242-23494; 23356-23452; 24000.
Resistances: 25256-25394; 25256-25404; 24809.
GOLD:
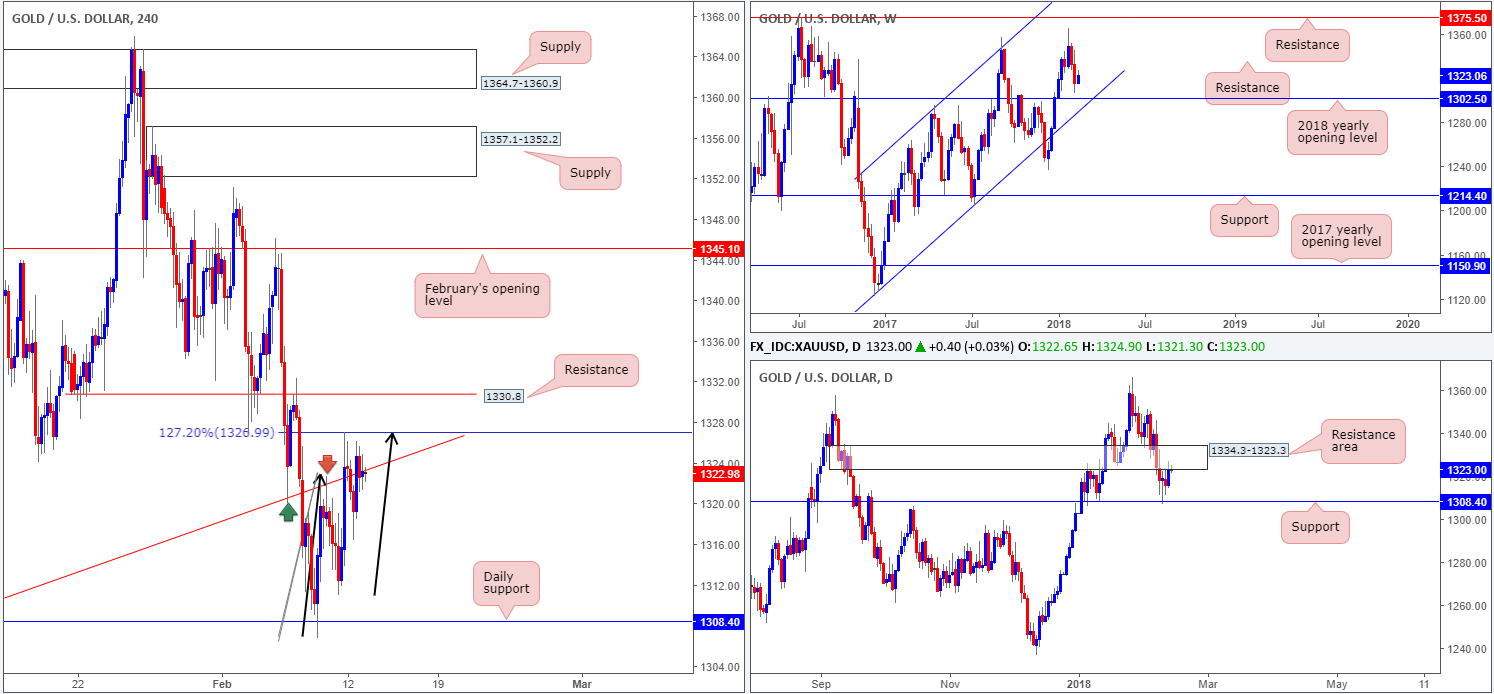
Commodity prices tumbled for a second consecutive session last week, as the US dollar made headway from a monthly support seen on the US dollar index at 88.50. As you can see from gold’s weekly chart, this has placed the yellow metal within a reasonably close distance to the 2018 yearly opening level at 1302.5 (and also a weekly channel support drawn from the low 1122.8), which may offer the market support in the event it is brought into the mix.
Turning the focus down to the daily timeframe, daily movement recently drove into the underside of a daily resistance area at 1334.3-1323.3, on the back of (intraday) dollar weakness. This, as far as we can see, is likely the reason our H4 trendline support-turned resistance taken from the low 1305.6 remains in motion.
Potential trading zones:
In light of the current daily resistance area, H4 trendline resistance and H4 AB=CD 127.2% Fib ext. point at 1326.9, we feel lower prices could still be on the cards, at least until we reach the 1312ish area, or even the daily support at 1308.4. To be safe here, waiting for additional candle confirmation in the form of a H4 full or near-full-bodied bearish candle to form is recommended. This will avoid any fakeouts seen up to the nearby H4 resistance planted at 1330.8.
Areas worthy of attention:
Supports: 1308.4; 1302.5; weekly channel support.
Resistances: H4 trendline resistance; 1326.9; 1330.8; 1334.3-1323.3.
This site has been designed for informational and educational purposes only and does not constitute an offer to sell nor a solicitation of an offer to buy any products which may be referenced upon the site. The services and information provided through this site are for personal, non-commercial, educational use and display. IC Markets does not provide personal trading advice through this site and does not represent that the products or services discussed are suitable for any trader. Traders are advised not to rely on any information contained in the site in the process of making a fully informed decision.
This site may include market analysis. All ideas, opinions, and/or forecasts, expressed or implied herein, information, charts or examples contained in the lessons, are for informational and educational purposes only and should not be construed as a recommendation to invest, trade, and/or speculate in the markets. Any trades, and/or speculations made in light of the ideas, opinions, and/or forecasts, expressed or implied herein, are committed at your own risk, financial or otherwise.
The use of the site is agreement that the site is for informational and educational purposes only and does not constitute advice in any form in the furtherance of any trade or trading decisions.
The accuracy, completeness and timeliness of the information contained on this site cannot be guaranteed. IC Markets does not warranty, guarantee or make any representations, or assume any liability with regard to financial results based on the use of the information in the site.
News, views, opinions, recommendations and other information obtained from sources outside of www.icmarkets.com.au, used in this site are believed to be reliable, but we cannot guarantee their accuracy or completeness. All such information is subject to change at any time without notice. IC Markets assumes no responsibility for the content of any linked site. The fact that such links may exist does not indicate approval or endorsement of any material contained on any linked site.
IC Markets is not liable for any harm caused by the transmission, through accessing the services or information on this site, of a computer virus, or other computer code or programming device that might be used to access, delete, damage, disable, disrupt or otherwise impede in any manner, the operation of the site or of any user’s software, hardware, data or property.


