A note on lower timeframe confirming price action…
Waiting for lower timeframe confirmation is our main tool to confirm strength within higher timeframe zones, and has really been the key to our trading success. It takes a little time to understand the subtle nuances, however, as each trade is never the same, but once you master the rhythm so to speak, you will be saved from countless unnecessary losing trades. The following is a list of what we look for:
- A break/retest of supply or demand dependent on which way you’re trading.
- A trendline break/retest.
- Buying/selling tails/wicks – essentially we look for a cluster of very obvious spikes off of lower timeframe support and resistance levels within the higher timeframe zone.
- Candlestick patterns. We tend to stick with pin bars and engulfing bars as these have proven to be the most effective.
We search for lower timeframe confirmation between the M15 and H1 timeframes, since most of our higher-timeframe areas begin with the H4. Stops are usually placed 5-10 pips beyond confirming structures.
EUR/USD:
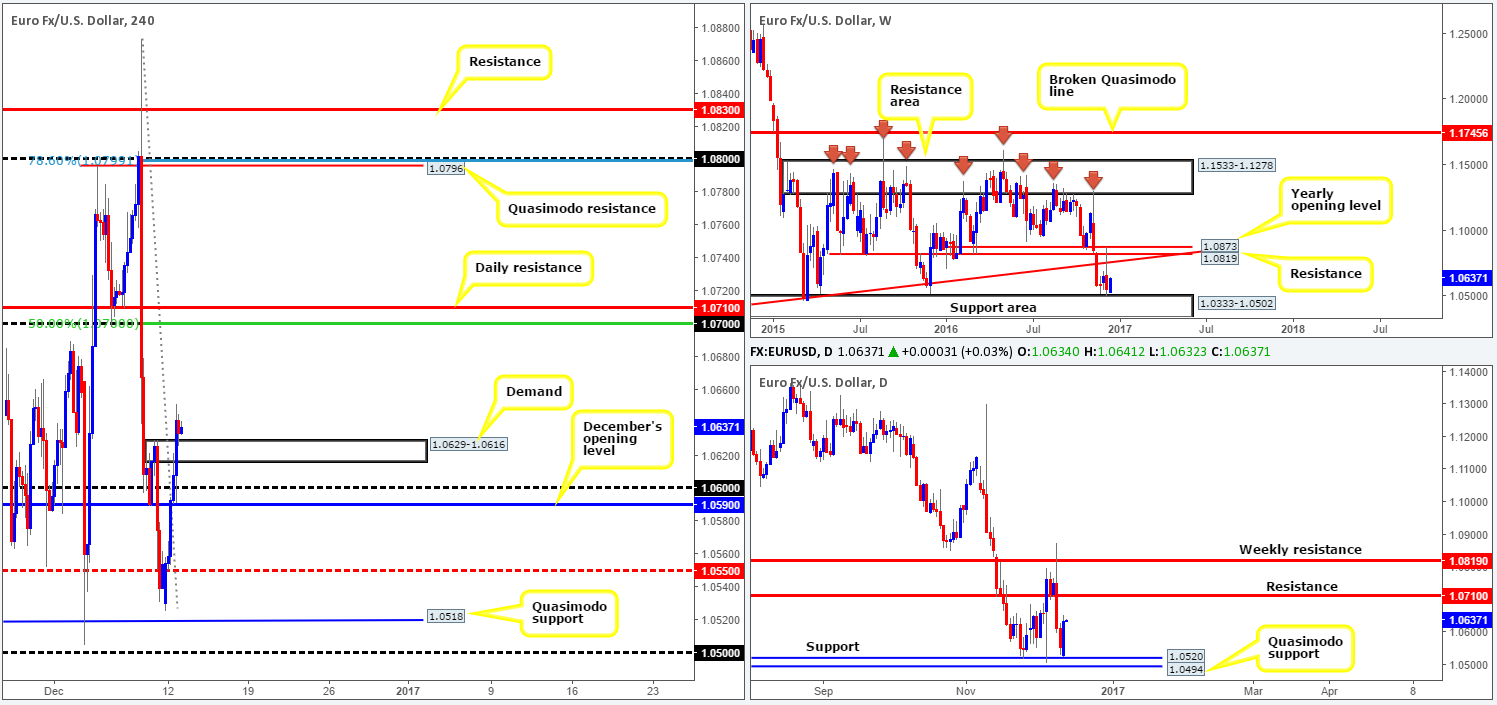
Across the board, we saw the US dollar fade from highs of 101.78 on Monday (see the US dollar index), consequently sending the shared currency over 100 pips north. Leaving the H4 Quasimodo support at 1.0518 unchallenged, several H4 resistances were consumed during yesterday’s bullish assault. The major ended the day claiming the H4 supply area at 1.0629-1.0616 (now an acting demand base), and possibly opened up the gates for further upside today toward 1.07.
With H4 structure in mind, both the weekly and daily charts also show space to advance north. The closest obstacle can be seen on the daily scale around 1.0710: a resistance level. On top of this, we can also see that yesterday’s rally chalked up a nice-looking daily bullish engulfing candle, which to candlestick traders is likely to be considered a buy signal.
Therefore, the H4 candles may, knowing that there is little standing in the way on the bigger picture, decide to extend north today, targeting the 1.07 handle. This barrier, as you can see, fuses beautifully with the 50.0% Fib resistance and is suitably positioned just ahead of the above noted daily resistance line.
Our suggestions: While a long from the current H4 demand base is tempting given that the higher-timeframe path is clear, we would still recommend waiting for at least a reasonably sized H4 bull candle to form before pulling the trigger. Furthermore, holding this position beyond the 1.07 handle is risky, in our opinion. The reason being is due to the confluence surrounding this number as mentioned above, and as such would be considered a viable sell zone!
Data points to consider: German ZEW economic sentiment at 10am, followed by US import prices at 1.30pm GMT.
Levels to watch/live orders:
- Buys: 1.0629-1.0616 ([reasonably sized H4 bullish close required prior to pulling the trigger] stop loss: ideally beyond the trigger candle).
- Sells: Flat (stop loss: N/A).
GBP/USD:
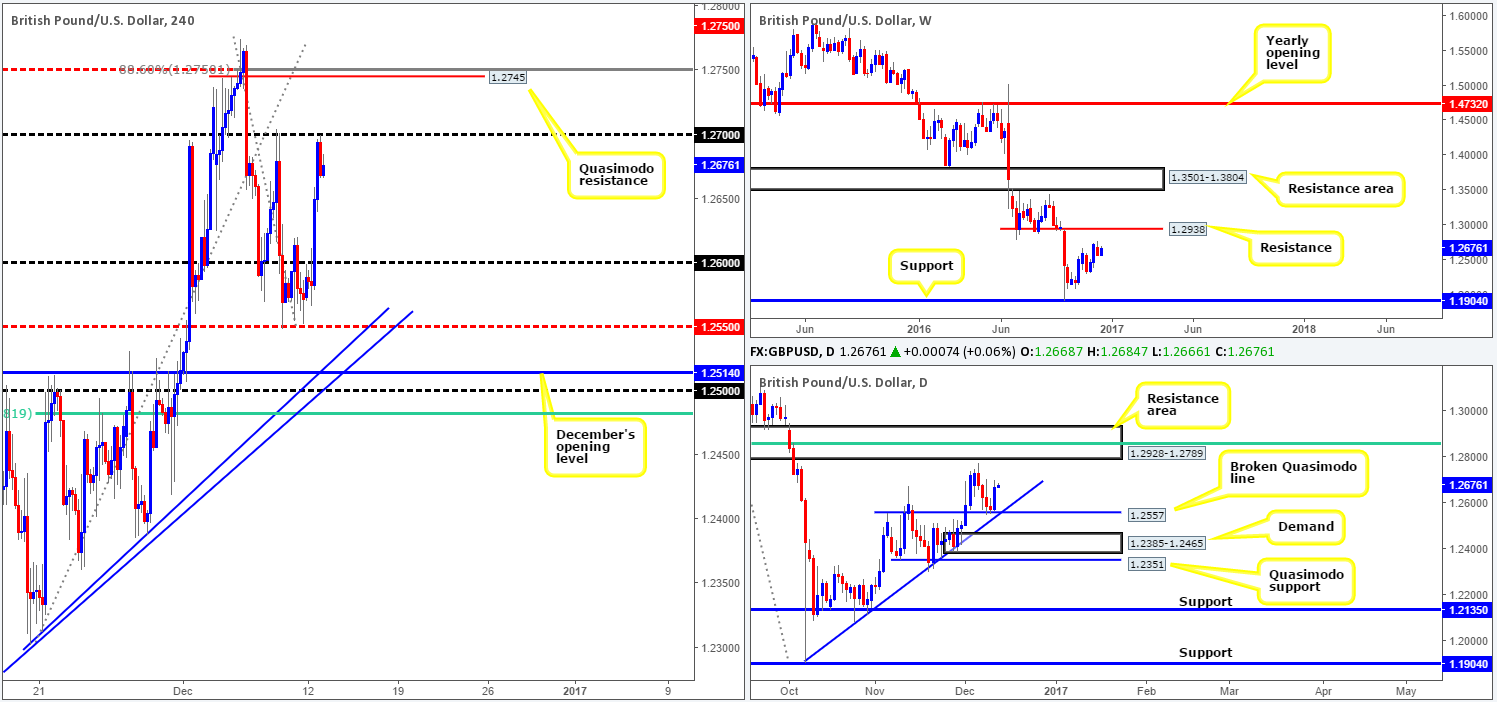
Try as it might, the GBP could not muster enough strength to breach the 1.26 ceiling in early trading yesterday. It was not until mid-way through the London morning segment did we witness the candles overcome this number. From thereon, as can be seen on the H4 chart, the pair continued to gather momentum and only decelerated once it tapped the 1.27 threshold.
This recent upside move was also strengthened by daily structure, which found a pocket of bids around a broken Quasimodo line at 1.2557 that unites with a trendline support extended from the low 1.1904. This – coupled with the weekly chart showing room to advance north to a resistance level at 1.2938, it was highly likely that we would eventually see a bounce higher this week. Only, as highlighted in Monday’s weekly report, we were looking to get in at a slightly lower price!
Our suggestions: Although the 1.27 handle is currently holding prices lower, there are technical signs suggesting that this may not be the end of the rally. Daily action shows room to extend north to a resistance area coming in at 1.2928-1.2789, while, as we mentioned above, the weekly shows the possibility of checking in with resistance at 1.2938 down the road.
Should a H4 close be seen above 1.27 today, the path north appears free up to 1.2745: a H4 Quasimodo resistance level that is located nearby the H4 mid-way resistance point at 1.2750 and a deep H4 88.6% Fib resistance level. Not a great deal of room to play with here! As a result, a H4 close above 1.27, followed by a retest and a lower-timeframe confirming signal (see the top of this report for details) would, as long as one is able to pin down a setup that offers a small enough stop to accommodate reasonable risk/reward up to 1.2745, be something to consider.
Data points to consider: UK inflation at 9.30am, as well as US import prices at 1.30pm GMT.
Levels to watch/live orders:
- Buys: Watch for a H4 close above 1.27 and then look to trade any retest seen thereafter ([lower-timeframe confirming signal is required before a trade is executed] stop loss: dependent on where one confirms this area).
- Sells: Flat (stop loss: N/A).
AUD/USD:
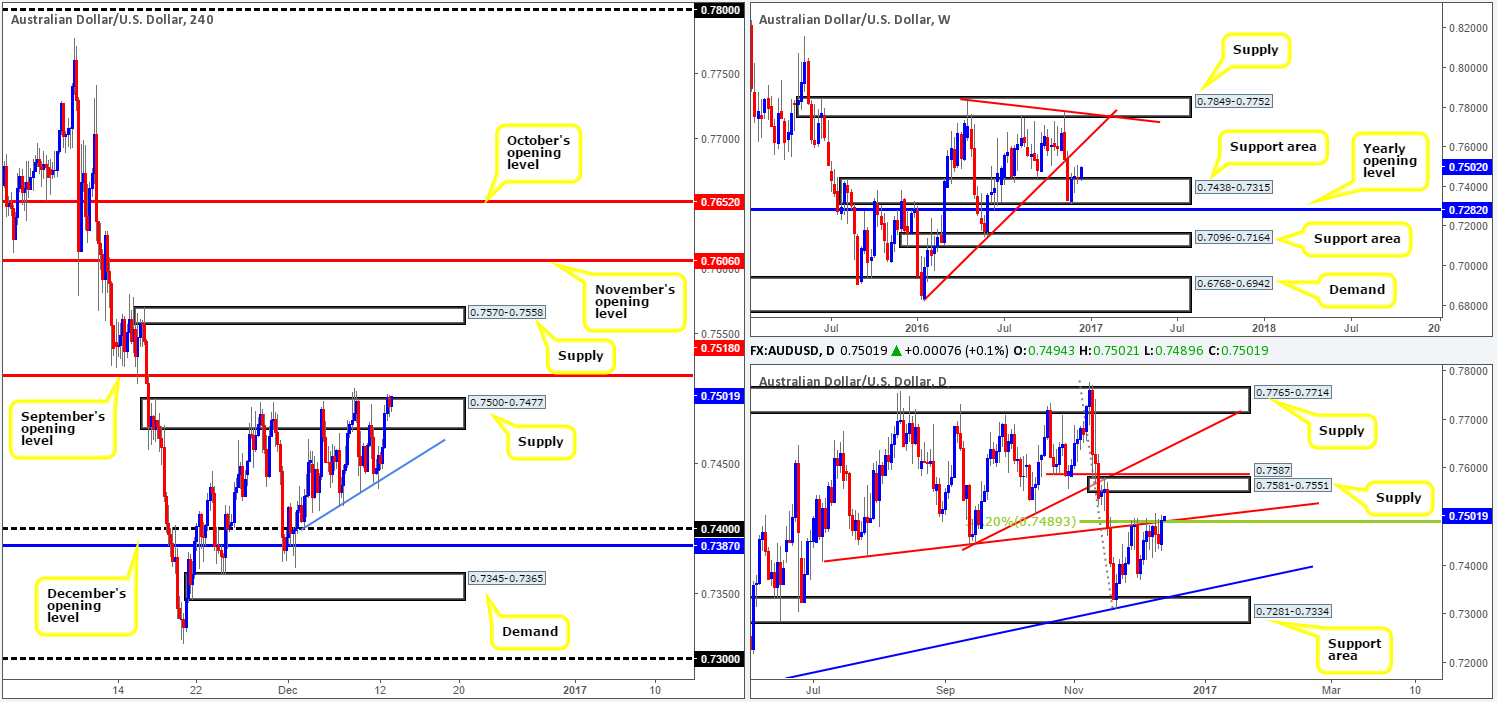
Kicking this morning’s analysis off with a brief look at the weekly chart, we can see that the pair remains bid from the support area chiseled in at 0.7438-0.7315. A continuation move higher from this angle could force price to connect with a trendline resistance stretched from the low 0.6827. Looking down to the daily candles, however, the unit is now flirting with the trendline resistance extended from the low 0.7407 that ties in nicely with a 38.2% Fib resistance at 0.7489 (taken from the high 0.7778).
Stepping across to the H4 chart, price is, once again, seen teasing the top edge of a supply zone at 0.7500-0.7477. While our desk believes that this area is on the verge of giving way, looking to buy above here with September’s opening level lurking just above at 0.7518 is challenging! A selloff from the current supply base is also something we would steer clear from today. Not only has there been no significant lower lows printed, but a minor uptrend has begun (see the blue line).
Our suggestions: By and large, a long position taken in this market places you at risk given the current daily trendline resistance and also nearby monthly (September) opening level at 0.7518. Meanwhile, shorting potentially places you in direct conflict with weekly buyers (see above)!
To our way of seeing things, neither a long nor short seems attractive at this time.
Data points to consider: Aussie housing data at 12.30am. Chinese industrial production at 2am, followed by US import prices at 1.30pm GMT.
Levels to watch/live orders:
- Buys: Flat (stop loss: N/A).
- Sells: Flat (stop loss: N/A).
USD/JPY:
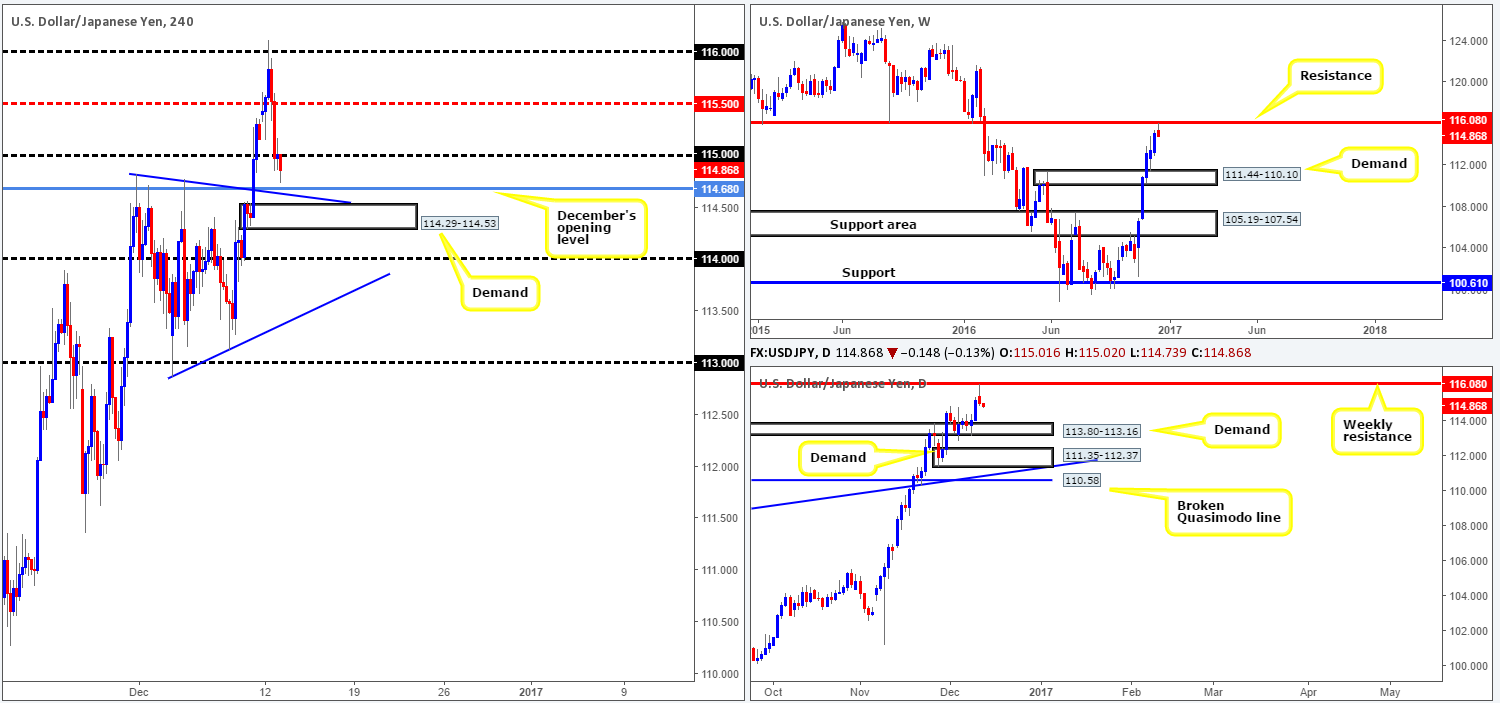
A weak US dollar, coupled with weekly price shaking hands with resistance at 116.08, saw the USD/JPY fall sharply yesterday. From this angle, the next downside target can be seen at 111.44-110.10: a supply turned-demand zone. Turning our attention to the daily candles, nevertheless, the next support objective can be seen in the form of a demand base drawn from 113.80-113.16, followed closely by another demand at 111.35-112.37.
Over on the H4 chart, both the mid-way support at 115.50 and the psychological handle 115 were recently engulfed thanks to Monday’s selloff. This has, as we hope is demonstrated clearly on the chart, left the field open for prices to connect with December’s opening level at 114.68. This monthly barrier, as you can probably see, also boasts reasonably attractive confluence with a nearby trendline support taken from the high 114.82 and a demand area at 114.29-114.53.
Our suggestions: While the H4 confluence surrounding December’s opening level is quite attractive, we feel a bounce is all we’ll see from this region. Our reasoning lies within the higher-timeframe structure. As mentioned above, weekly resistance at 116.08 has recently been brought into play, and both the weekly and daily timeframes show scope for further downside to at least the 114 region (positioned 20 pips above the top edge of the daily demand area at 113.80-113.16). To that end, our team will humbly pass on any longs from the aforementioned H4 structures today and remain flat for the time being.
Data points to consider today: US import prices at 1.30pm, followed by Japanese manufacturing data at 11.50pm GMT.
Levels to watch/live orders:
- Buys: Flat (stop loss: N/A).
- Sells: Flat (stop loss: N/A).
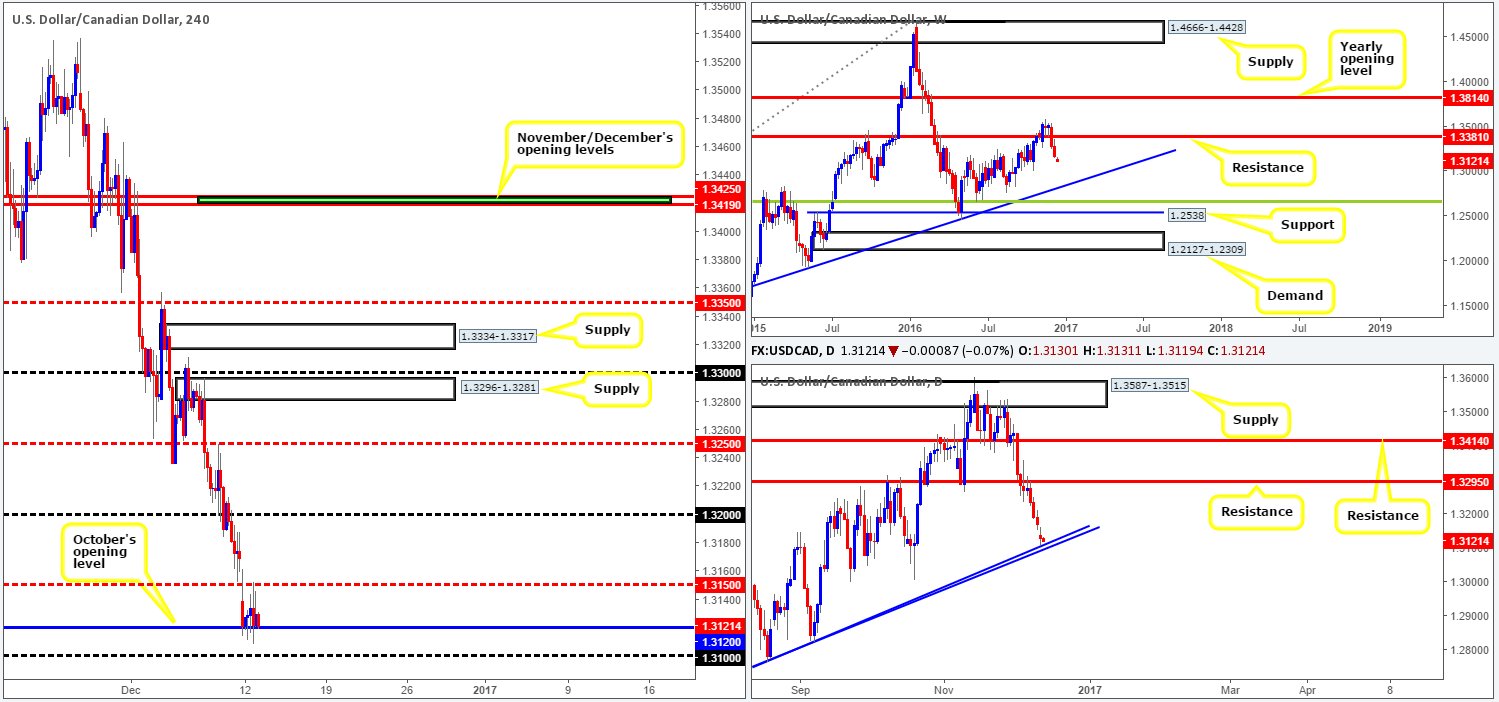
USD/CAD:
The bears began the week on a strong footing yesterday, gapping around 50 pips lower. Despite this, October’s opening level at 1.3120 offered the pair a base in which to stabilize itself. This barrier, along with the psychological band seen just below it at 1.31 and two nearby daily trendline supports etched from the lows 1.2460/1.2763, has a respectable chance of holding this unit again today. Be that as it may, on the weekly chart there’s little seen stopping the loonie from continuing lower this week down to the trendline support taken from the high 1.1278. This begs the question, is a long from current prices (1.31/1.3120) worth the risk, knowing that there’s a possibility of further selling on the weekly chart? Considering the confluence being drawn in from the daily chart, we believe it is!
Our suggestions: Ultimately, should price print a reasonably strong-looking H4 bull candle from the 1.31/1.3120 region, this is, at least in our book, sufficient enough to place a buy order, targeting 1.3150 as an immediate take-profit barrier. As we mentioned in Monday’s report nonetheless, this will not guarantee a winning trade, but what it will do is show one that there are interested buyers, hence lessening the likelihood of being stopped out.
Data points to consider today: US import prices at 1.30pm GMT.
Levels to watch/live orders:
- Buys: 1.31-1.3120 ([reasonably sized H4 bullish close required prior to pulling the trigger] stop loss: ideally beyond the trigger candle).
- Sells: Flat (stop loss: N/A).
USD/CHF:
Overall dollar weakness, along with the EUR/USD aggressively pushing north, was clearly enough to send the USD/CHF south yesterday! December’s opening level at 1.0170 played its part well, as price retested the underside of this barrier beautifully before dropping to fresh lows. Furthermore, let’s remind ourselves that the recent down move was also bolstered by a Quasimodo resistance positioned at 1.0198 and the fact that weekly price remains trading within a resistance area coming in at 1.0239-1.0131.
While both the weekly and daily charts suggest a continuation move lower may be on the cards today, H4 price recently bumped heads with a trendline support extended from the high 1.0204. For the time being, this level is holding ground, but for how long is anybody’s guess! The reason we say this is simply because not only does the higher-timeframe charts exhibit a bearish stance, there is also little H4 confluence supporting this area.
Our suggestions: Put simply, trading this pair is, at least for the time being, a little bit tricky. Our desk has absolutely no intention of buying given the bigger picture, and selling is challenging in view of the current H4 trendline support in play right now. Therefore, laying low today and reassessing going into tomorrow’s sessions could be the logical path to take here.
Data points to consider today: US import prices at 1.30pm GMT.

Levels to watch/live orders:
- Buys: Flat (stop loss: N/A).
- Sells: Flat (stop loss: N/A).
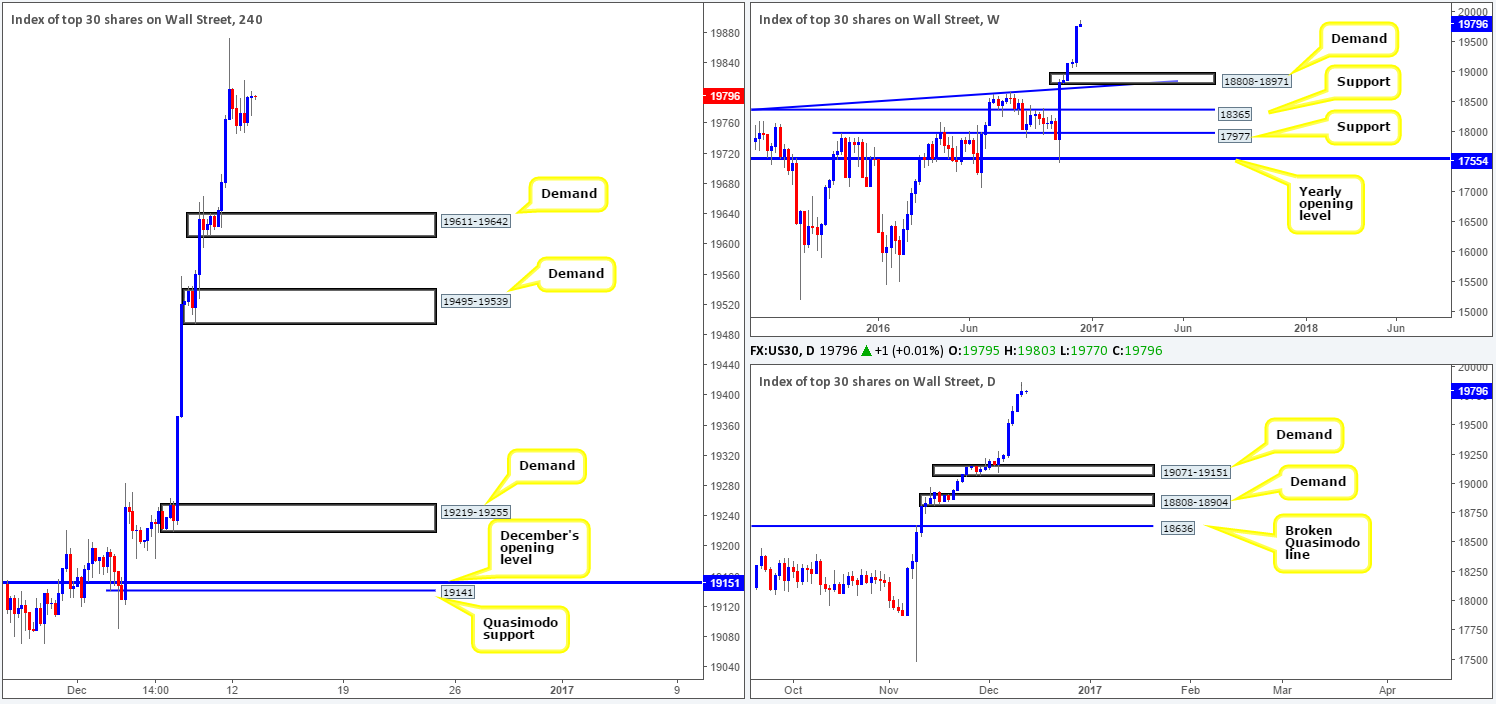
DOW 30:
Although equities increased in value yesterday, for a sixth consecutive day we might add, a daily bearish selling wick formed going into the close. In view of Friday’s rally, a new H4 demand was created at 19611-19642. Of course, as you can probably see, this demand has no connection to higher-timeframe structure, but what it does do is give us a base to potentially work with.
On that note, from the weekly timeframe we can see that should the market pullback, the demand area at 18808-18971 that converges with trendline support taken from the high 18365 is where we believe the index could withdraw to on this scale. Looking a little lower down on the curve, the daily candles reveal that the next support hurdle in the mix, should a retracement be seen, is planted at 19071-19151 (seen above the aforementioned weekly demand).
Our suggestions: In that the above noted H4 demand looks reasonably strong; our team has come to a general consensus that a long from here is promising. Along with the backing of a reasonably sized H4 bull candle, we would feel comfortable buying from here, in spite of this area boasting no higher-timeframe convergence. A decisive push below this boundary on the other hand, could be an early cue to a move back down to H4 demand at 19495-19539.
Data points to consider today: US import prices at 1.30pm GMT.
Levels to watch/live orders:
- Buys: 19611-19642 ([reasonably sized H4 bullish close required prior to pulling the trigger] stop loss: ideally beyond the trigger candle).
- Sells: Flat (stop loss: N/A).
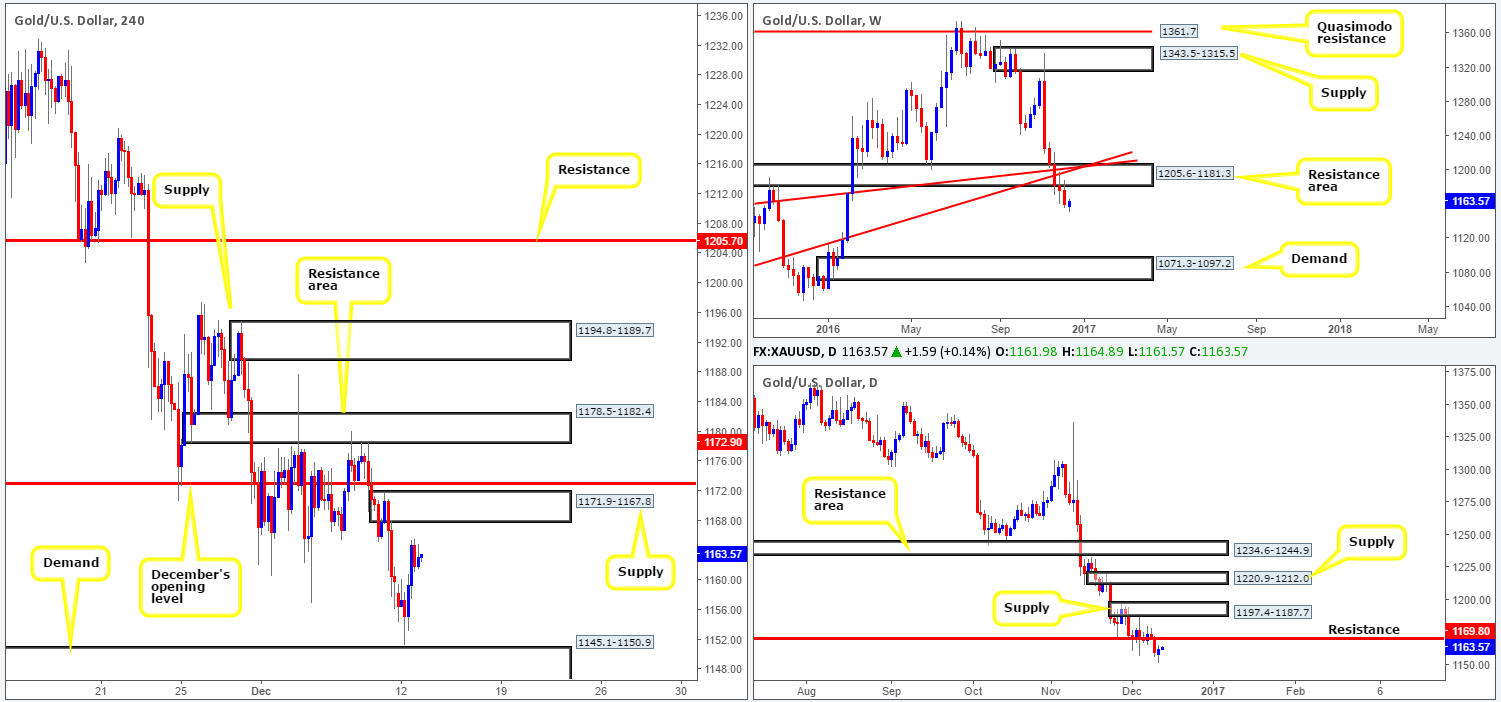
GOLD:
Looking at this market from the top this morning, bullion continues to reflect a strong bearish stance. After price ran through bids at the weekly support area drawn from 1205.6-1181.3 (now acting resistance), the spotlight is drawn to 1071.3-1097.2: a weekly demand area that claims strong bullish momentum from its base. In a similar fashion to weekly structure, daily support at 1169.8 (now acting resistance) was taken out on Friday, opening up the possibility for a run down to daily demand coming in at 1108.2-1117.8. However, judging by yesterday’s daily close, it appears as though we may see this level retested as resistance before the commodity trades south.
Looking over to the H4 candles, though, the yellow metal found support just ahead of demand seen at 1145.1-1150.9, and managed to achieve highs of 1165.6 on the day. The next area to have an eyeball on today is a nearby supply carved from 1171.9-1167.8 that sits just beneath December’s opening level at 1172.9.
Our suggestions: In that the current H4 supply area is reasonably fresh, and houses the daily resistance line at 1169.8 within, a short from here is tempting. Nevertheless, traders need to be prepared for the likelihood of a fakeout through this zone, since there are possibly a collection of unfilled orders lurking around December’s opening barrier!
To trade short from the above said supply we would recommend waiting for the bears to confirm interest. We usually, when there is adequate room of course, wait for a H4 confirming candle (in this case bearish) to form. Should this come to fruition, a short, given the above points on the higher-timeframe structures, is valid, targeting the aforementioned H4 demand area, and possibly lower as the higher timeframes suggest.
Levels to watch/live orders:
- Buys: Flat (stop loss: N/A).
- Sells: 1171.9-1167.8 ([reasonably sized H4 bearish close required prior to pulling the trigger] stop loss: ideally beyond the trigger candle).