Waiting for lower timeframe confirmation is our main tool to confirm strength within higher timeframe zones, and has really been the key to our trading success. It takes a little time to understand the subtle nuances, however, as each trade is never the same, but once you master the rhythm so to speak, you will be saved from countless unnecessary losing trades. The following is a list of what we look for:
- A break/retest of supply or demand dependent on which way you’re trading.
- A trendline break/retest.
- Buying/selling tails/wicks – essentially we look for a cluster of very obvious spikes off of lower timeframe support and resistance levels within the higher timeframe zone.
- Candlestick patterns. We tend to stick with pin bars and engulfing bars as these have proven to be the most effective.
We typically search for lower-timeframe confirmation between the M15 and H1 timeframes, since most of our higher-timeframe areas begin with the H4. Stops are usually placed 1-3 pips beyond confirming structures.
EUR/USD:
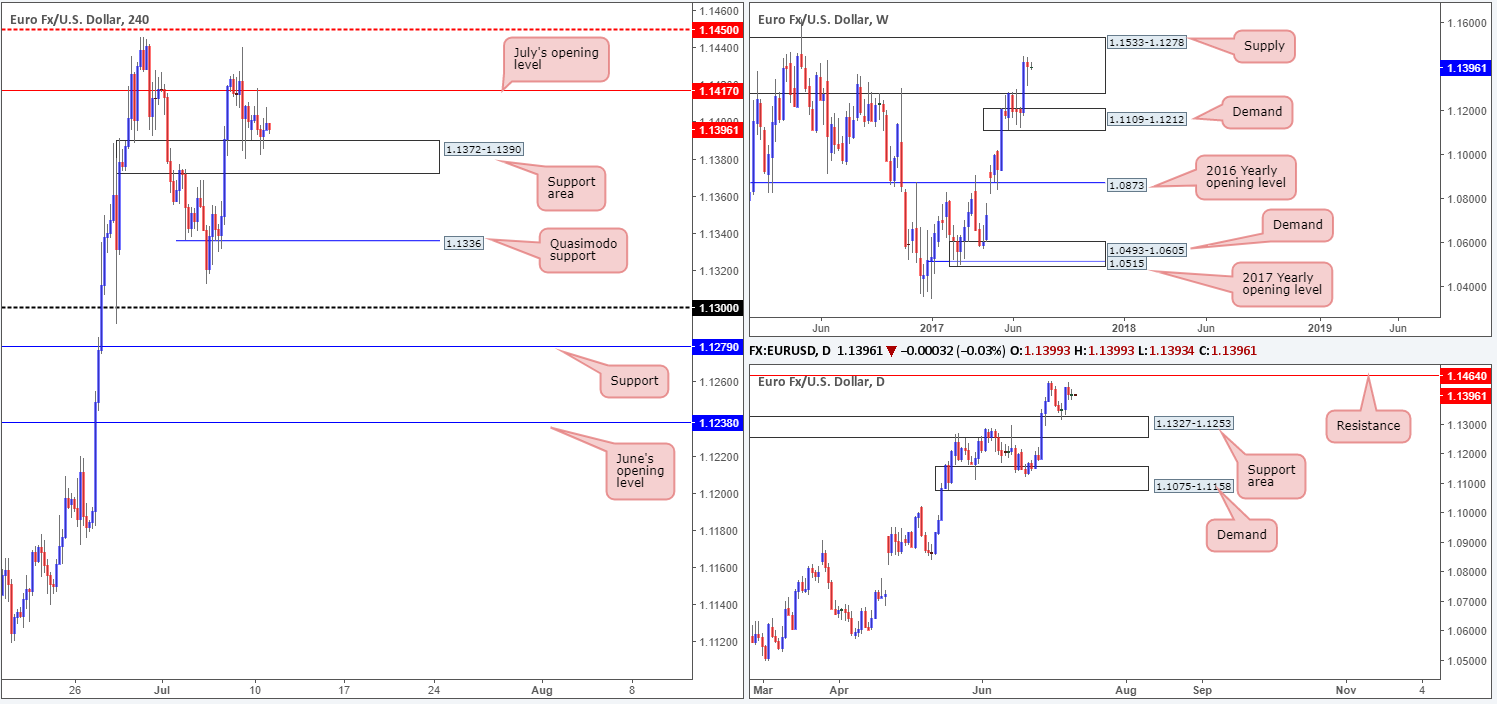
The EUR/USD took on more of a sober tone during Monday’s sessions, ranging between July’s opening level at 1.1417 and a H4 support area based at 1.1372-1.1390. Should the unit violate 1.1417 today, the next hurdle in the firing range is likely to be the H4 mid-level resistance 1.1450. A break below the current H4 support area on the other hand would likely open the gates down to the H4 Quasimodo support at 1.1336.
Moving over to the bigger picture, weekly flow remains loitering within the walls of a major supply zone drawn from 1.1533-1.1278 that has capped upside since May 2015. On the daily timeframe, however, we currently see a resistance level pegged at 1.1464 and a daily support area coming in at 1.1327-1.1253.
With weekly candles trading within such a respected supply zone at the moment, a break below the current H4 support base would not surprise us. This, according to both the daily and H4 timeframes, could open up a small gap south for a potential trade as beyond the H4 support area we have the aforementioned Quasimodo support to target, followed closely by the top edge of the daily support area at 1.1327 and then the 1.13 handle.
Our suggestions: Watch for a decisive break below the H4 support area at 1.1372-1.1390 and then look to trade any retest seen thereafter. Ideally, we would like to see a reasonably sized H4 bearish candle take shape (preferably a full-bodied candle) following the retest, as this will, in our opinion, suggest seller intent.
Data points to consider: FOMC member Brainard speaks at 5.30pm GMT+1.
Levels to watch/live orders:
- Buys: Flat (stop loss: N/A).
- Sells: Watch for H4 price to engulf 1.1372-1.1390 and then look to trade any retest seen thereafter ([waiting for a H4 bear candle – preferably a full, or near full-bodied candle – to form following the retest is advised] stop loss: ideally beyond the candle’s wick).
GBP/USD:
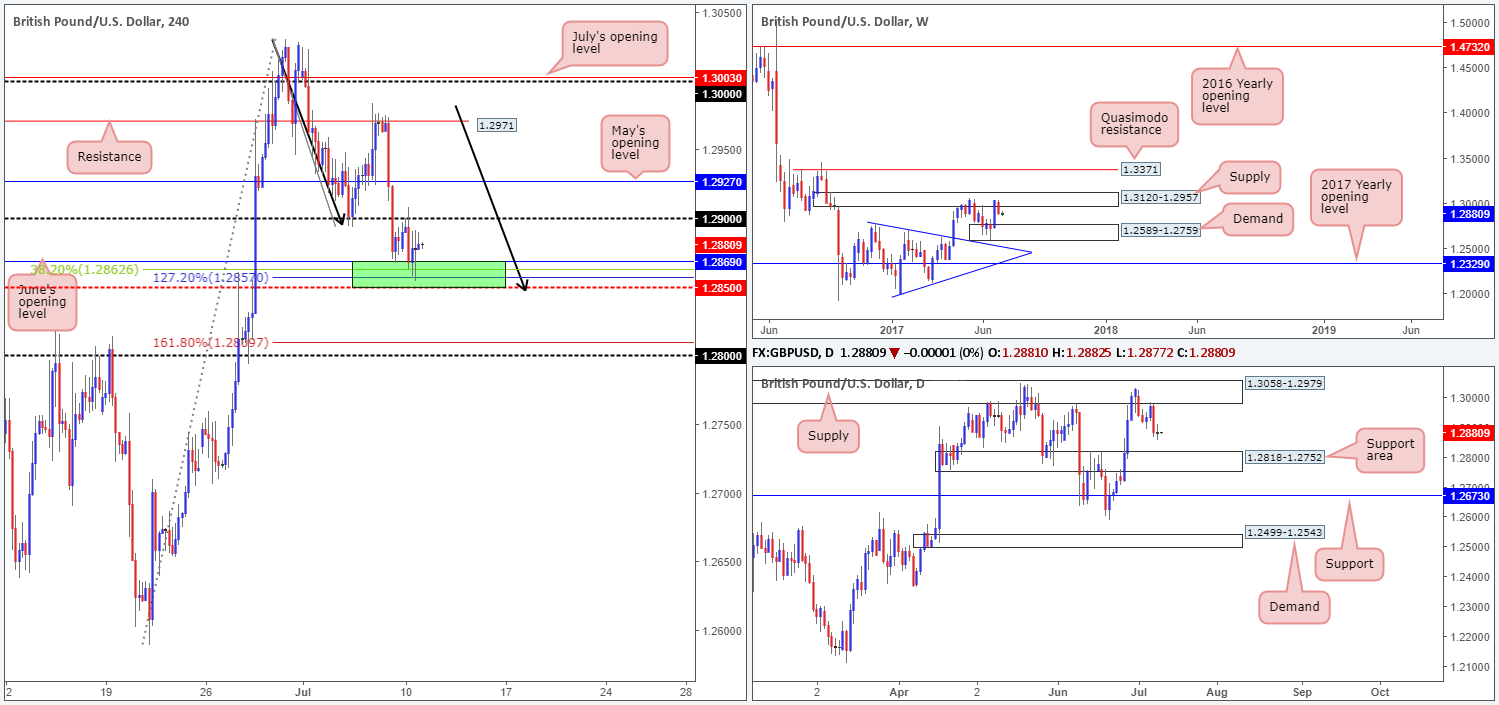
Coming at you from the top this morning, weekly supply at 1.3120-1.2957, as you can see, is currently holding this market lower. In the event that this continues, the next downside target can be seen at a demand base drawn from 1.2589-1.2759. Sliding down to the daily timeframe, we can see that supply at 1.3058-1.2979 (positioned within the weekly supply area) held price lower last week which could eventually send the unit down to a support area chiseled in at 1.2818-1.2752.
Despite both the weekly and daily timeframes suggesting further downside may be upon us this week, the H4 is currently seen trading from a rather interesting area of support marked in green at 1.2850-1.2869. The zone is comprised of June’s opening level at 1.2869, a 38.2% Fib support level at 1.2862, a AB=CD 127.2% ext. at 1.2857 and a mid-level support line at 1.2850.
Our suggestions: While the H4 confluence surrounding 1.2850-1.2869 is tempting to buy, there’s just too much higher-timeframe structure positioned against this area for us to justify a trade, unfortunately. In addition to this, we do not like how the 1.29 handle held so well on Monday – just look at the strength of the bears upon connecting with this psychological level!
With the above points in mind, our attention is drawn to the 1.28 handle seen below, which happens to converge with the 161.8% ext. point at 1.2809 (from the AB=CD pattern mentioned above) and is lodged within the said daily support area!
Data points to consider: MPC Member Broadbent speaks at 12.00pm. FOMC member Brainard speaks at 5.30pm GMT+1.
Levels to watch/live orders:
- Buys: Currently watching the 1.28 neighborhood for a potential long opportunity. To trade from here we would highly recommend waiting for at least a H4 bullish candle to form, preferably a full-bodied candle, before pulling the trigger.
- Sells: Flat (stop loss: N/A).
AUD/USD:
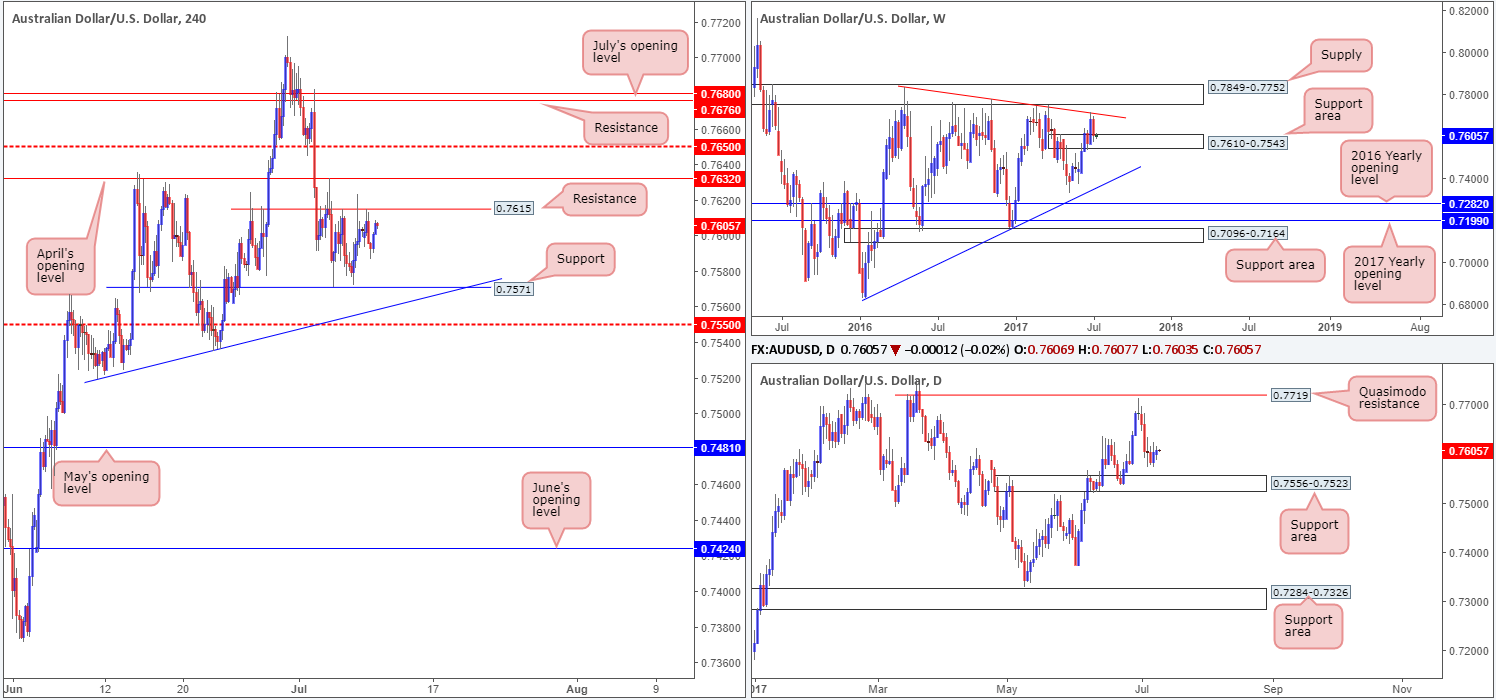
Over the last week or so, the H4 candles have been chiseling out a consolidation between resistance at 0.7615 and support located at 0.7571. According to the weekly timeframe, the commodity currency could be heading higher sometime soon given that weekly price recently connected with a support area carved from 0.7610-0.7543. There are, however, two cautionary points to bear in mind regarding this theory. Firstly, the daily chart shows space for price to continue pushing lower until we reach the support area formed at 0.7556-0.7523, which happens to be glued around the lower edge of the current weekly support area. Secondly, even if weekly price does force the pair north, we have a multiple H4 resistances planted beyond the current H4 resistance, thus making it a difficult buy!
Our suggestions: With the above points in mind, the only level of interest that we believe deserves attention is the H4 mid-level support at 0.7550. Not only does it converge with a H4 trendline support etched from the low 0.7519, it is also located within both of the above said weekly and daily support areas.
Should we spot H4 bulls coming into the picture from the 0.7550 vicinity today in the shape of a (preferably) full-bodied bull candle, we would have no hesitation in buying this market, with the hope that price breaks back into the current H4 range.
Data points to consider: FOMC member Brainard speaks at 5.30pm GMT+1.
Levels to watch/live orders:
- Buys: 0.7550 region ([waiting for a H4 bull candle – preferably a full, or near full-bodied candle – to form is advised] stop loss: ideally beyond the candle’s tail).
- Sells: Flat (stop loss: N/A).
USD/JPY:
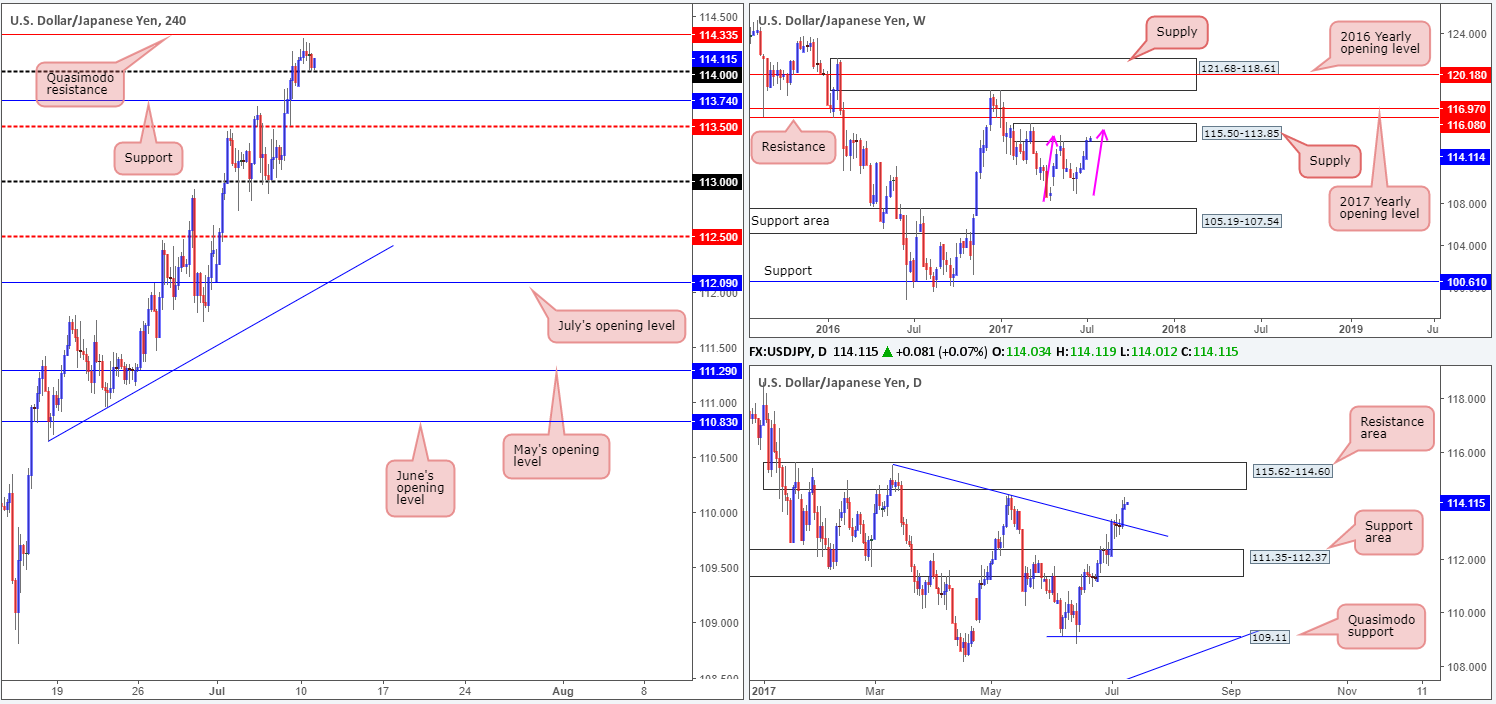
Although USD/JPY bulls look incredibly strong at the moment, there may be trouble lurking ahead! Weekly price recently entered supply coming in at 115.50-113.85. Assuming that price continues to push higher, nevertheless, it could also form a possible AB=CD correction completing around 115 (see pink arrows). The story on the daily timeframe shows price also trading within striking distance of a resistance area at 115.62-114.60, which happens to be positioned nearby the aforementioned weekly AB=CD completion point!
Meanwhile, over on the H4 timeframe, the 114 handle is currently offering the market a level of support. With the next upside target coming in at 114.35 (Quasimodo resistance), however, the bulls may struggle from here.
Our suggestions: On account of the above, our desk is firmly biased to the downside right now. Nevertheless, we will wait for daily price to at least shake hands with the aforementioned resistance area before looking to sell this market, as ideally we want to short the 115 handle and place stops just above the daily zone at 115.64, thus clearing both the daily resistance area and the current weekly supply.
Data points to consider: FOMC member Brainard speaks at 5.30pm GMT+1.
Levels to watch/live orders:
- Buys: Flat (stop loss: N/A).
- Sells: Currently have our eye on the 115 neighborhood for shorts.
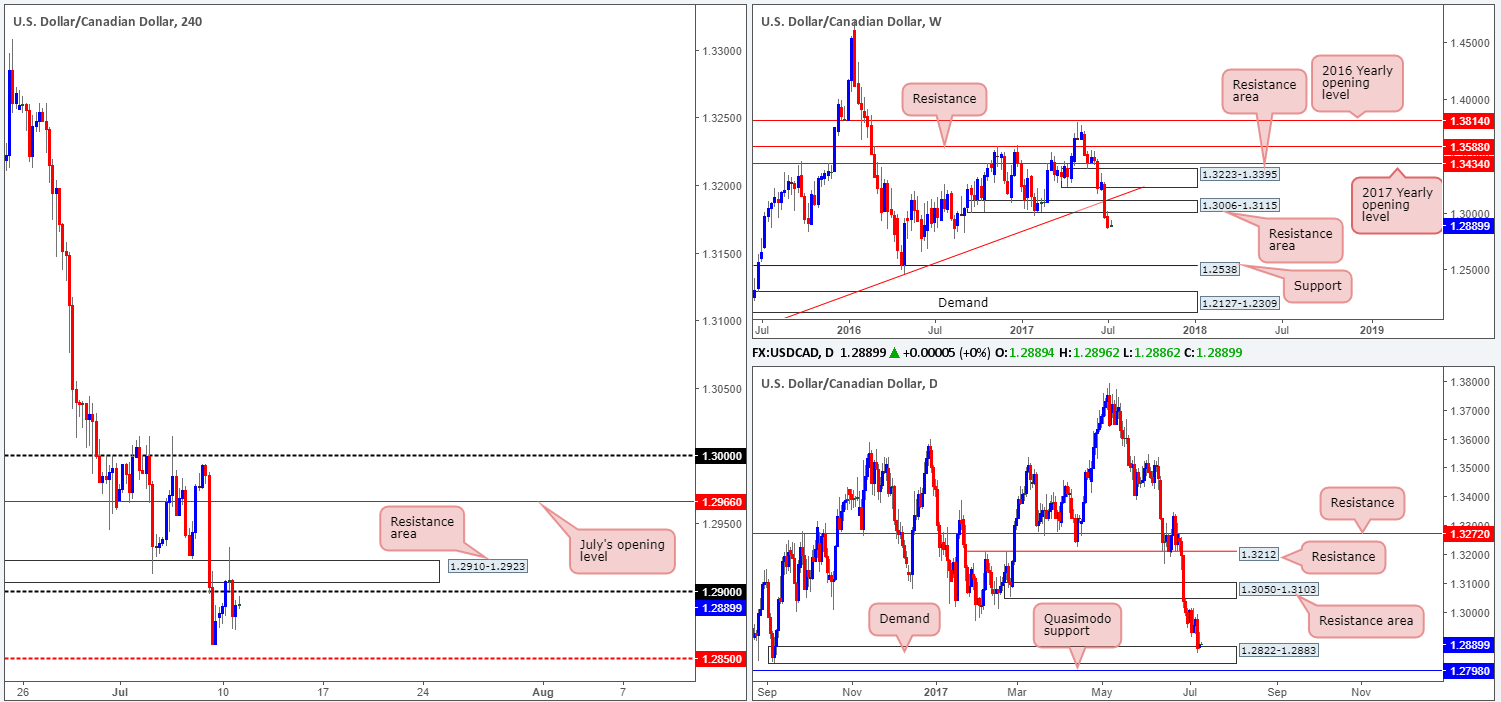
USD/CAD:
From the weekly timeframe, the USD/CAD appears to reflect an incredibly bearish market at present. After breaching the support area at 1.3006-1.3115, which is now a resistance area, the unit shows space to trade all the way down to support coming in at 1.2538. Interestingly though, on the daily timeframe we see the candles challenging a demand base pegged at 1.2822-1.2883. Also noteworthy is yesterday’s inverted pin-bar candle, which according to conventional wisdom, is considered a buy signal.
Across on the H4 timeframe, however, the resistance area at 1.2910-1.2923 held firm during yesterday’s segment, forcing the candles to trade back below the 1.29 handle. Should the bears remain on the offensive here, we could see the loonie attack the mid-level support at 1.2850.
Our suggestions: In essence, what we have here is the weekly timeframe telling us that the sellers show potential, while conversely, the daily timeframe shows that the bulls may make an appearance this week as well as the H4 candles trading bearishly below a psychological band. Personally speaking, this market is not something we would look to trade, especially with the higher-timeframe conflicting signals being seen.
Data points to consider: FOMC member Brainard speaks at 5.30pm. Canadian Housing starts at 1.15pm GMT+1.
Levels to watch/live orders:
- Buys: Flat (Stop loss: N/A).
- Sells: Flat (Stop loss: N/A).
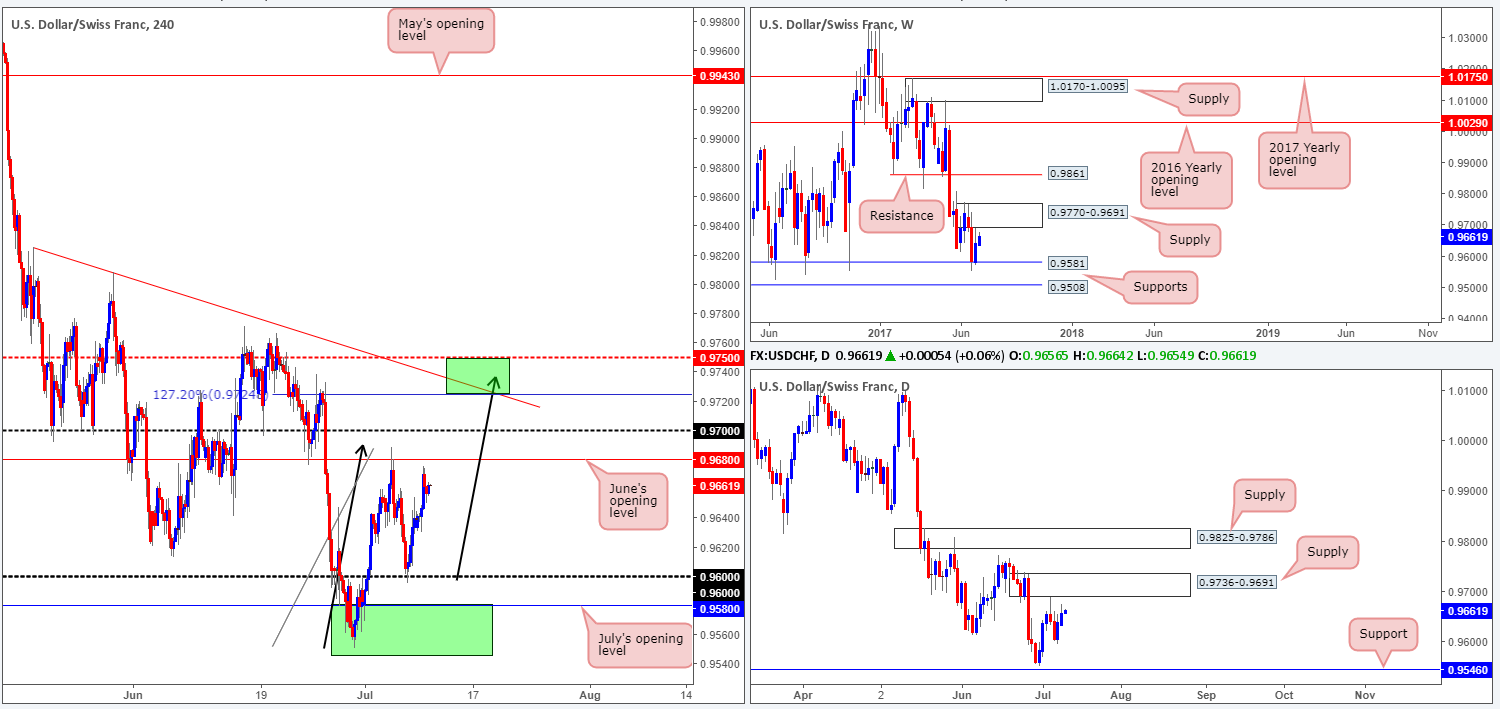
USD/CHF:
In recent trading, we’ve seen the H4 candles begin completing a D-leg to an AB=CD formation that finalizes around the 0.9720ish range. Also of particular interest is the converging trendline resistance extended from the high 0.9825 and a mid-level resistance at 0.9750 (upper green area).
What’s also notable from a technical perspective is that the upper green H4 zone is positioned within the upper limits of a weekly supply zone seen at 0.9770-0.9691. However, in order to reach the H4 area, the pair would need to breach daily supply at 0.9736-0.9691, which is located around the lower edge of the said weekly supply.
Our suggestions: The desk has come to a general consensus that waiting to see if H4 price can strike the upper green zone before we look to sell is the better path to take. Apart from benefitting from the H4 and weekly confluence, this would also allow traders to place stops ABOVE the weekly supply at 0.9772.
Data points to consider: FOMC member Brainard speaks at 5.30pm GMT+1.
Levels to watch/live orders:
- Buys: Flat (stop loss: N/A).
- Sells: 0.9750/0.9720 (stop loss: 0.9772).
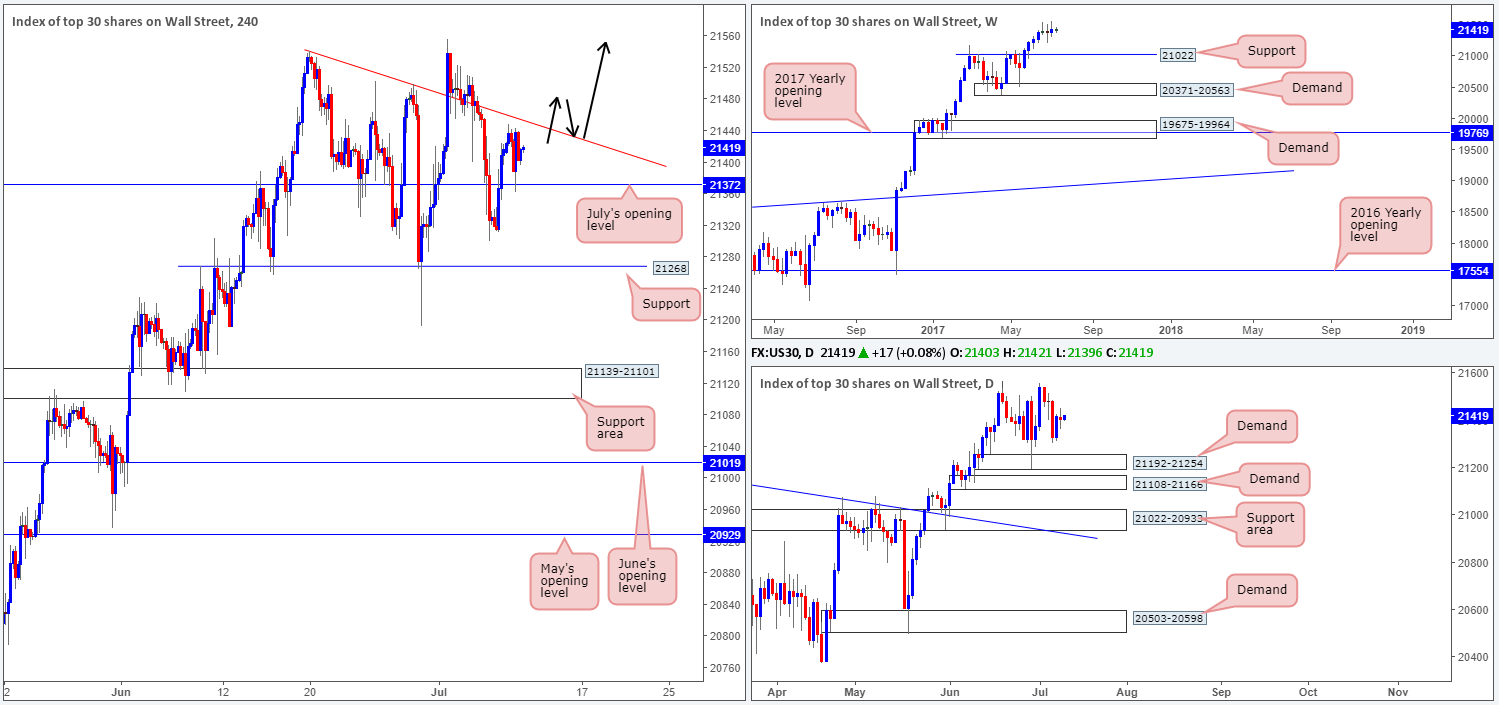
DOW 30:
Despite the H4 candles grinding lower at the moment, the US equity market remains trading with a strong upside bias. On the weekly timeframe, there’s little stopping the unit from pushing higher. Should the index pullback, however, the support level at 21022 will likely offer a floor to trade from considering that it had a relatively sound history as a resistance.
Ultimately, we’re looking for July’s opening level at 21372 to continue providing support, and eventually force the candles above the nearby H4 trendline resistance extended from the high 21541. This, for us, would be a cue to begin looking to buy this market.
Our suggestions: Following a decisive close above the current H4 trendline resistance, the desk will be watching for the piece to retest this line as support and print a reasonably sized H4 bull candle, preferably a full, or near full-bodied candle, before looking to pull the trigger (as per the black arrows).
Data points to consider: FOMC member Brainard speaks at 5.30pm GMT+1.
Levels to watch/live orders:
- Buys: Watch for H4 price to close above the current trendline resistance and then look to trade any retest seen thereafter ([waiting for a H4 bull candle – preferably a full, or near full-bodied candle – to form following the retest is advised] stop loss: ideally beyond the candle’s tail).
- Sells: Flat (stop loss: N/A).
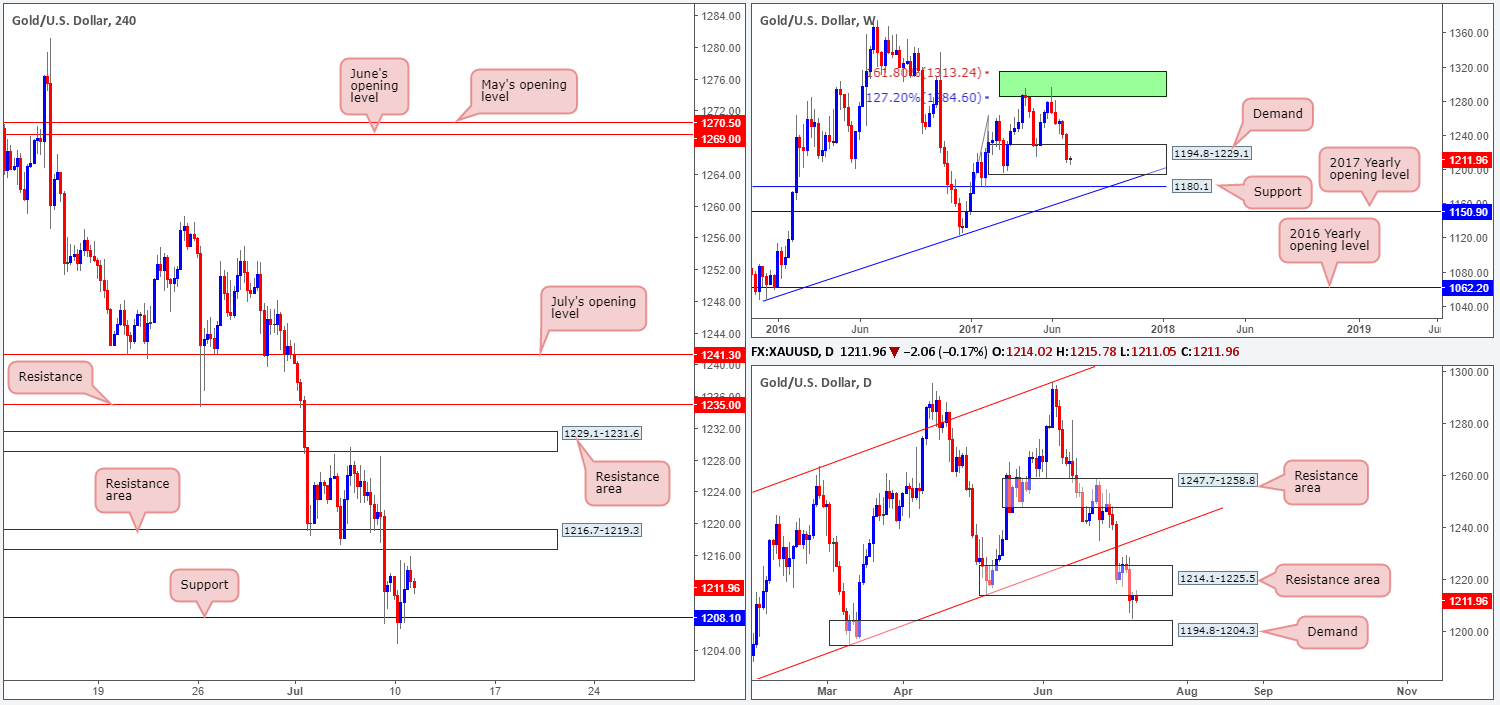
GOLD:
Kicking this morning’s report off with a look at the weekly timeframe, we can clearly see the buyers and sellers battling for position within a demand zone at 1194.8-1229.1. This demand has held price higher once already back in early May, so there’s a solid chance that history may repeat itself here. Punching down to the daily timeframe, Monday’s action came within a cat’s whisker of connecting with a demand base at 1194.8-1204.3 and printed a nice-looking buying tail. Although this is considered a buy signal by many, the yellow metal is also touching base with the underside of a resistance area at 1214.1-1225.5 as well.
H4 support at 1208.1 remains in a stable state right now and could eventually force the unit to challenge the H4 resistance area at 1216.7-1219.3. Given this, and the above notes, there is clearly conflicting signals evident in this market. Buying from the weekly demand not only places traders up against the current daily resistance area, but also the H4 resistance area seen within, as well.
Our suggestions: Before our team becomes buyers in this market, we would require a decisive H4 close above the said H4 resistance area. That way, we can be somewhat confident that the daily resistance area is weakened and the H4 candles will likely reach the H4 resistance area at 1229.1-1231.6, followed closely by H4 resistance at 1235.0.
Levels to watch/live orders:
- Buys: Watch for H4 price to close above 1216.7-1219.3 and then look to trade any retest of this area seen thereafter ([waiting for a H4 bull candle – preferably a full, or near full-bodied candle – to form following the retest is advised] stop loss: ideally beyond the candle’s tail).
- Sells: Flat (stop loss: N/A).